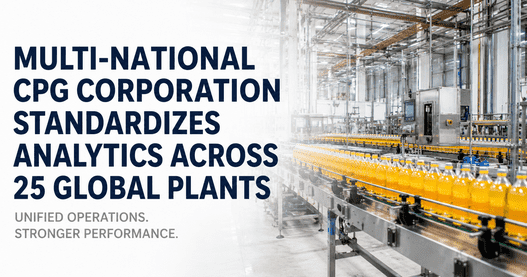
A Fortune 500 consumer packaged goods corporation operating 25 plants across 12 countries was managing manufacturing analytics through 25 separate systems each plant had implemented its own combination of spreadsheets, legacy dashboards, and point solutions for OEE tracking, downtime analysis, and quality reporting. The corporate operations team could not generate a consolidated view of plant performance across the global network. Comparing OEE between a plant in Brazil and a plant in Thailand required manually requesting data from each site, reconciling definitions that varied by plant (one site defined OEE as availability x performance x quality, another used a modified calculation that excluded changeover time), and waiting two to four weeks for the data to arrive. The cost of this fragmentation was measurable: the corporation was spending $2.3 million annually on redundant analytics tools, data reconciliation labor, and the hidden cost of delayed decisions caused by inconsistent reporting. iFactory's Multi-Plant Portfolio Management module provided the standardization layer the organization needed a unified analytics platform deployed across all 25 plants with consistent KPIs, centralized reporting, and role-based dashboards for plant managers, regional directors, and corporate operations leadership. The result: a 30% reduction in total analytics operating costs, a single source of truth for plant performance, and the ability to benchmark any plant against any other plant in the network using identical metrics and data definitions. Corporate operations leaders evaluating enterprise-wide analytics standardization can Book a Demo to review the Multi-Plant Portfolio Management deployment methodology and cost model for their global manufacturing network.
The Fragmentation Problem: 25 Plants, 25 Analytics Systems
The corporation's 25 plants spanned 12 countries across North America, South America, Europe, and Asia-Pacific — producing everything from packaged foods and beverages to home care and personal care products. Each plant had independently selected its analytics tools based on local preferences, existing vendor relationships, and the expertise of individual plant engineers. The result was a patchwork of systems: six plants used a major cloud-based OEE platform, eight used custom Excel dashboards with manual data entry, five used a legacy on-premise SCADA reporting tool that was no longer supported, four used a combination of Tableau dashboards fed by disparate data sources, and two plants had no formal analytics system at all, relying entirely on shift supervisor reports and paper logs. The corporate operations team, based at the global headquarters in Chicago, had no way to answer basic questions about network-wide performance. Which plants had the highest OEE? The question was unanswerable because OEE was calculated differently at each site. Which plants were trending upward in overall equipment effectiveness and which were declining? The data arrived too late and in too many formats to generate a timely comparison. The annual operating cost of maintaining 25 separate analytics systems was $1.2 million in software licensing and subscription fees. The corporate team spent an additional $680,000 annually on data reconciliation — manually converting plant-level reports into a common format for quarterly business reviews. And the delay in data availability meant that underperforming plants were not identified until two to three months after the performance issues began. The total annual cost of analytics fragmentation was $2.3 million, not including the opportunity cost of delayed decisions across the global network. For corporate operations leaders facing similar fragmentation challenges, iFactory's Multi-Plant Portfolio Management module provides a proven path to consolidation. Book a Demo to see a live demonstration of global plant performance benchmarking across 25+ sites.
Solution Architecture: iFactory Multi-Plant Portfolio Management
iFactory's Multi-Plant Portfolio Management module was designed specifically for the enterprise deployment challenge — a single instance of the iFactory platform deployed across all 25 plants, with centralized administration and local configuration flexibility. The architecture is built on three tiers. The data ingestion tier connects to each plant's existing automation infrastructure — PLCs, SCADA systems, historians, and IoT sensors — through OPC-UA, Modbus TCP, and REST API connectors, normalizing data from disparate sources into a common data model before it enters the analytics engine. The analytics tier applies consistent KPI definitions across all plants — OEE, availability, performance rate, quality rate, MTBF, MTTR, planned maintenance percentage, and energy intensity — calculated from the normalized data using identical formulas regardless of the plant's original data source. The reporting tier delivers role-based dashboards: plant managers see their site's performance with drill-down to line and asset level, regional directors see a portfolio view of plants in their region with comparative benchmarking, and corporate leadership sees the global network view with trend analysis, outlier detection, and automated alerts when any plant deviates from expected performance ranges. The deployment across 25 plants was executed in 14 weeks using a phased rollout model — four pilot plants in the first four weeks, six plants in weeks five through eight, and the remaining 15 plants in weeks nine through fourteen. Each plant required an average of three days of on-site configuration and two days of team training, with all plants running on the same iFactory instance by week 14. Organizations evaluating enterprise analytics standardization can review the Multi-Plant Portfolio Management deployment architecture and phased rollout methodology by contacting iFactory's enterprise deployment team.
Deployment: Phased Rollout Across 25 Plants in 14 Weeks
The deployment followed a structured four-phase methodology designed to minimize disruption to plant operations while ensuring consistent configuration across all sites. Phase one was discovery and data mapping — iFactory's enterprise deployment team visited each plant to document its existing data infrastructure, identify data sources and connectivity methods, and map plant-specific equipment hierarchies into the standardized iFactory asset model. Phase two was pilot deployment — four plants representing different regions, product categories, and analytics maturity levels were brought online first, serving as reference implementations that validated the deployment methodology and provided real-world configuration templates for the remaining sites. Phase three was scaled rollout — the next 6 plants were deployed in weeks five through eight using the validated templates and configuration patterns from the pilot phase, with each plant's deployment completed in three days of on-site work and two days of training. Phase four was final deployment and network activation — the remaining 15 plants were deployed in weeks nine through fourteen, and the corporate portfolio dashboard was activated once all sites were connected, giving the Chicago headquarters team real-time visibility into every plant's performance for the first time in the corporation's history. Each plant retained local configuration flexibility for site-specific metrics and dashboard views, but all plants used the same core KPI definitions, the same data quality standards, and the same reporting cadence — ensuring that corporate benchmarking was meaningful and actionable from day one.
Measured Results: 30% Cost Reduction and a Single Source of Truth
The metrics below represent the cumulative results across all 25 plants over a 12-month measurement period following the completion of the iFactory Multi-Plant Portfolio Management deployment. Baseline measurements were taken from the 12-month period before deployment, when the corporation operated 25 separate analytics systems.
Corporate Operations Leader's Perspective: From Fragmented Reporting to Unified Portfolio Management
I lead global manufacturing operations for a Fortune 500 CPG company with 25 plants across 12 countries, and for the six years before deploying iFactory, I was making capital allocation and performance improvement decisions based on data that was three to six weeks old, inconsistently defined, and manually reconciled by a team of four analysts. Every quarterly business review started with a two-week data collection and normalization process before we could even begin discussing plant performance. The plants did not trust the comparisons because they knew the definitions were inconsistent. The regional directors did not trust the rankings because they knew some plants were reporting optimistic numbers while others were conservative. And the executive team did not trust the trend analysis because the data was too stale to be actionable. iFactory's Multi-Plant Portfolio Management module solved every one of these problems. The deployment was structured and predictable — 14 weeks from pilot to full network activation. The plant teams appreciated that they kept local configuration flexibility for site-specific views while adopting the standardized KPI definitions that made corporate benchmarking meaningful. The regional directors got portfolio dashboards that showed them which plants were leading and which needed support, updated daily instead of quarterly. And the executive team finally got a single source of truth for global manufacturing performance. The $700,000 in annual cost savings from eliminating redundant systems and reconciliation labor was a clear business case, but the real value was unmeasurable before deployment: the ability to see a plant's OEE trending down on day two of the trend rather than week eight, and the ability to intervene before a performance dip became a production crisis. For any CPG operations leader managing a multi-plant network, I would recommend starting with a pilot in four plants representing different regions and product types, running the pilot for four weeks, and using the validated results to build the enterprise business case. The technology works, the deployment methodology is proven, and the ROI is clear — 30% cost reduction in the first year and a single source of truth that transforms how you manage global operations.
— Vice President of Global Manufacturing Operations, Fortune 500 CPG Corporation — 25 Plants Across 12 CountriesConclusion: Enterprise Analytics Standardization Delivers Measurable Cost Reduction and Decision Quality Improvement
The 30% reduction in analytics operating costs, the elimination of manual data reconciliation, and the transformation from fragmented reporting to unified portfolio management were not the result of a single technology implementation but of a carefully designed enterprise standardization program that combined a unified analytics platform, consistent KPI definitions, and a proven phased rollout methodology. For corporate operations leaders managing multi-plant manufacturing networks who are spending millions on fragmented analytics systems and the hidden cost of delayed decisions, the path to standardization does not require replacing the automation infrastructure at every plant or implementing a complex new layer of enterprise software. iFactory's Multi-Plant Portfolio Management module connects to each plant's existing data infrastructure, normalizes data from disparate sources into a common data model, applies consistent KPI definitions, and delivers role-based dashboards for every level of the organization — all within a 14-week deployment timeline and with a first-year ROI that is independently measurable from cost reduction alone.
Frequently Asked Questions About Multi-Plant Analytics Standardization
The iFactory platform includes a data quality assessment module that evaluates each plant's data completeness, accuracy, and update frequency during the discovery phase. Plants with complete, real-time data streams are configured for automated reporting. Plants with manual or partial data collection are configured with streamlined manual entry forms that minimize the data entry burden while ensuring consistency. The platform automatically adjusts confidence indicators on reports based on data source type, so corporate users can distinguish between real-time sensor data and manually entered data at a glance.
Yes. The Multi-Plant Portfolio Management architecture separates core KPI definitions — which are configured centrally and applied identically across all plants — from local dashboard views and site-specific metrics. Each plant manager can configure their team's dashboard with additional metrics, custom views, and local benchmarks that are relevant to their operation, while the corporate reporting layer uses only the standardized KPI definitions to ensure consistent benchmarking across the network.
The deployment is designed to require minimal plant IT resources. iFactory's enterprise deployment team handles all technical configuration, including data source connectivity, data model mapping, and dashboard setup. The plant IT team's primary responsibilities are providing network access and authentication credentials, reviewing the data source connectivity plan, and participating in a two-hour handoff session at the end of the three-day on-site deployment. Most plants require less than eight hours of IT team time across the entire deployment cycle.
iFactory supports offline-capable deployment for plants with limited or intermittent internet connectivity. The platform runs a local instance at the plant that collects and stores data during connectivity outages and synchronizes with the central instance when connectivity is restored. The synchronization is compressed and optimized for low-bandwidth connections, requiring less than 50 MB of data transfer per day for a typical plant with 50 to 100 monitored assets.
iFactory offers enterprise licensing structured as an annual platform fee plus a per-plant fee that decreases with scale. For a deployment of 25 plants, the typical annual cost ranges from $180,000 to $320,000 depending on the number of assets per plant, data source complexity, and integration requirements. Enterprise licensing includes central administration, all platform updates, and priority technical support. Most multi-plant deployments achieve full ROI within 6 to 10 months based on analytics cost reduction alone.