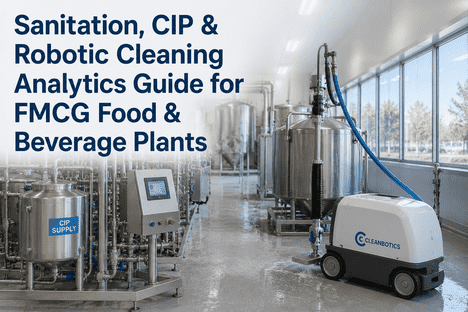
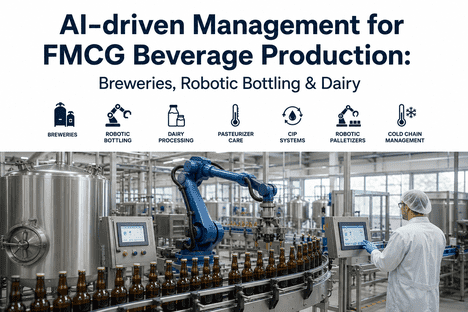
The sanitation manager at a large dairy processing facility reviewed the CIP cycle data for the past quarter. The records showed that every CIP cycle had been completed — all 312 of them — with the correct time, temperature, and chemical concentration logged manually on paper sheets. But when the third-party auditor asked for trend analysis showing that CIP effectiveness was improving over time, the manager could not produce it. The data existed, but it was buried in paper logs and disconnected spreadsheets that made trend analysis impossible. The auditor issued a finding under the facility's sanitation prerequisite program, requiring documented evidence that CIP performance was being systematically analyzed and optimized. The facility had a sanitation program. What it did not have was sanitation analytics. This guide covers the specific analytics requirements for CIP systems, robotic tank cleaning, and sanitation equipment in FMCG food and beverage plants — and how iFactory AI's CIP scheduling and sanitation checklist modules automate the data collection, trend analysis, and compliance documentation that auditors and quality managers demand.
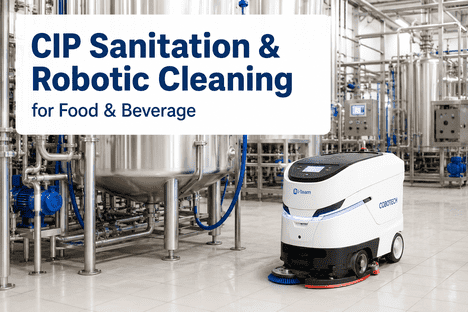
CIP · ROBOTIC CLEANING · SANITATION ANALYTICS
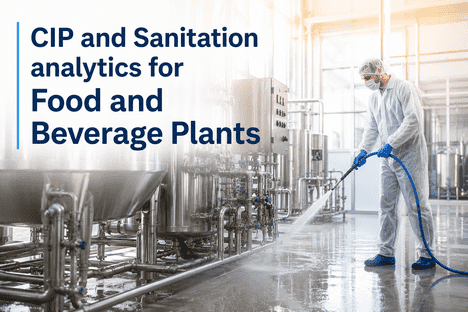
Turn Sanitation Data into Audit-Ready Analytics — Automate CIP Validation, Chemical Monitoring, and Robotic Cleaning Verification
Why Sanitation Analytics Is the Missing Piece in FMCG Food Safety Programs
Most FMCG food and beverage facilities have invested heavily in CIP systems, robotic tank cleaners, and automated sanitation equipment. The hardware is capable. The chemical dosing is precise. The cycle times are controlled. But the analytics layer that connects sanitation equipment performance to food safety outcomes is almost always missing. The CIP system generates temperature, flow, and concentration data that could reveal developing issues — a heat exchanger fouling trend, a spray ball blockage, a chemical pump degrading — but without analytics, this data is collected but never analyzed. The robotic cleaning system completes its programmed cycles, but without analytics, the facility cannot verify that cleaning effectiveness is improving over time or that the robot's path, pressure, and detergent usage are optimized for each vessel.
The cost of missing sanitation analytics shows up in three ways that directly affect the facility's bottom line. First, CIP chemical usage drifts upward without detection because no one is tracking the concentration trend per cycle. Second, cleaning cycle times extend incrementally as heat exchangers foul and spray devices wear, reducing production availability by 30 to 90 minutes per day across the facility. Third, and most critically, the sanitation program fails audit scrutiny because the facility cannot produce documented trend analysis showing that cleaning effectiveness is monitored, measured, and continuously improved. Each of these costs is eliminated by a sanitation analytics program that continuously monitors CIP and robotic cleaning performance.
Without Sanitation Analytics
x
CIP chemical usage drifts upward 5-8% annually without detection — thousands in wasted detergent and sanitizer
x
Cycle times extend 10-15% over 6 months as heat exchangers foul — progressive loss of production time
x
Audit findings for missing trend analysis — repeat non-conformance on sanitation program documentation
With iFactory AI Sanitation Analytics
/
Chemical concentration monitored per cycle — 15-25% reduction in chemical spend through early drift detection
/
CIP cycle time trends tracked — predictive alerts when time extends beyond baseline, triggering maintenance before production loss
Reduction in CIP chemical spend through automated concentration drift detection and optimisation — payback achieved within the first operating quarter
90%
Reduction in sanitation audit preparation time when CIP analytics and robotic cleaning verification reports are generated automatically from live sensor data
30-90
Minutes per day of production time recovered when CIP cycle time drift is detected and corrected before it compounds across multiple cleaning events
The Four Pillars of Sanitation Equipment Analytics for FMCG Food and Beverage
Sanitation equipment analytics for FMCG food and beverage plants covers four distinct categories of equipment, each with specific analytics parameters, measurement frequencies, and compliance documentation requirements. iFactory AI's CIP scheduling and sanitation checklist modules provide pre-configured analytics templates for each category, enabling facilities to deploy comprehensive sanitation analytics in weeks.
CIP Systems
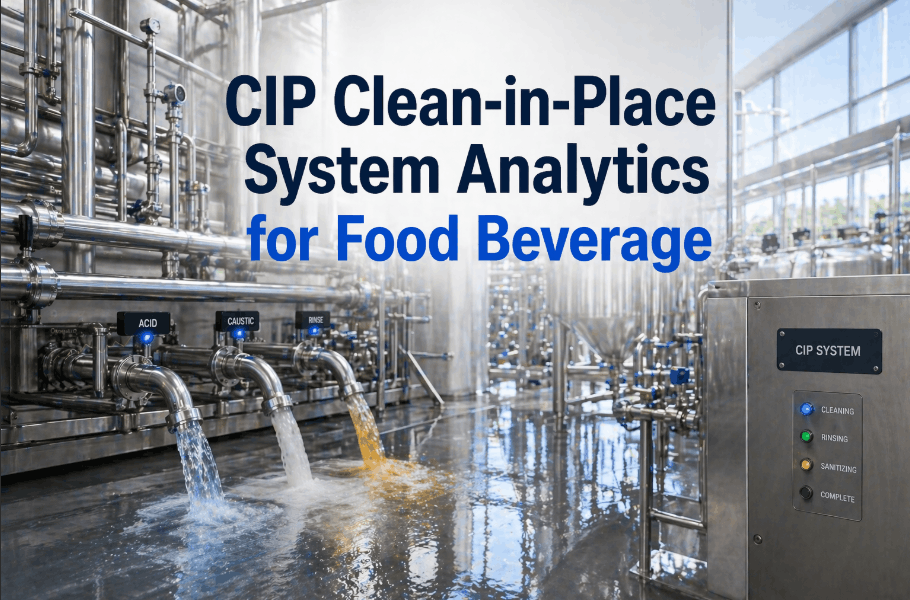
Clean-in-Place Analytics — Temperature, Flow, Concentration, and Cycle Validation
CIP systems are the most critical sanitation equipment in any food or beverage plant, and they generate the most analytics data. The CIP analytics program must monitor temperature profiles across each cycle phase — pre-rinse, caustic wash, intermediate rinse, acid wash, final rinse — and verify that each phase achieves the required temperature for the required duration. Flow rate analytics verify that spray devices are delivering the correct flow for effective coverage, with deviations triggering maintenance alerts for blocked or worn spray balls. Chemical concentration analytics track the conductivity or titration-based concentration readings for each CIP cycle, detecting drift that indicates dosing pump degradation or chemical depletion. Cycle duration analytics track the total cycle time and each phase duration, flagging extensions that indicate heat exchanger fouling, flow restrictions, or chemical effectiveness degradation. iFactory AI's CIP scheduling module automatically collects and analyzes all four parameter categories, generating CIP validation reports per cycle, per vessel, and per time period.
Robotic Cleaners
Robotic Tank Cleaning Verification — Path, Pressure, Coverage, and Cycle Effectiveness
Robotic tank cleaning systems use articulated arms, rotating spray heads, or autonomous crawlers to clean vessels that are difficult or dangerous for human entry. The analytics program for robotic cleaning systems must track the cleaning path completion status — verifying that the robot covered the entire programmed path without skipping zones. Pressure analytics verify that the cleaning nozzle is delivering the required pressure at each point in the path, with deviations indicating nozzle wear, pump degradation, or hose restrictions. Coverage analytics use the robot's position feedback to calculate actual surface coverage versus programmed coverage, flagging areas where the robot is consistently missing. Cycle effectiveness analytics correlate cleaning outcomes — rinse water turbidity, visual inspection results, ATP swab results — with the robot's operating parameters to optimize the cleaning program over time. iFactory AI's platform integrates with all major robotic tank cleaning systems, ingesting position, pressure, and flow data for real-time analytics.
Chemical Dosing
Chemical Dosing and Monitoring Systems — Concentration Verification and Consumption Analytics
Chemical dosing systems for CIP and sanitation applications require analytics across three dimensions. Concentration analytics track the actual concentration of cleaning chemicals at the point of use versus the setpoint, using conductivity cells, titration sensors, or flow-based dosing verification. The trend analysis must detect gradual drift in concentration that indicates dosing pump wear, chemical depletion in bulk tanks, or water quality changes affecting dilution accuracy. Consumption analytics track chemical usage per CIP cycle, per vessel, and per production line, enabling the facility to identify anomalous consumption patterns that indicate leaks, overdosing, or unauthorized cycle modifications. Inventory integration connects consumption analytics with bulk chemical inventory levels, generating automated reorder alerts when stock drops below the minimum threshold for the next production schedule. iFactory AI's chemical monitoring module provides real-time concentration dashboards, automated consumption reports, and predictive reorder alerts.
Sanitation equipment requires documented preventive maintenance programs that include inspection schedules, calibration verification, and performance testing. The analytics program for sanitation PM must track inspection completion rates, calibration due dates and drift trends, and performance test results for each piece of sanitation equipment. For CIP systems, the PM analytics include heat exchanger efficiency trending, pump performance curves, and spray device flow testing. For robotic cleaning systems, the PM analytics include arm joint position accuracy, pressure sensor calibration drift, and nozzle wear rate trends. For chemical dosing systems, the PM analytics include dosing pump stroke accuracy, conductivity cell calibration drift, and flow meter verification. iFactory AI's sanitation checklist module automates PM scheduling, inspection documentation, and performance trend analysis, generating the documented evidence that SQF, FSSC 22000, and BRC auditors require.
CIP Validation Analytics: From Manual Logs to Automated Trend Detection
CIP validation is the process of verifying that a CIP cycle achieved its intended cleaning outcome. Traditional CIP validation relies on manual review of paper chart recorders or digital data logs — a technician reviews the temperature profile, flow rate, and chemical concentration readings after each cycle and signs off if the parameters fall within acceptable ranges. This approach is time-consuming, inconsistent, and provides no trend analysis. If the CIP cycle temperature was 68 degrees Celsius instead of 72 degrees Celsius for the first three minutes of the caustic phase, the manual reviewer may or may not flag it depending on their experience and attention level. And even if every cycle is reviewed, no one is analyzing whether the temperature profile is trending downward over weeks as the heat exchanger fouls.
The iFactory AI CIP validation module automates the entire validation process. For each CIP cycle, the platform automatically compares the actual temperature, flow, concentration, and duration against the validated ranges for that vessel and product type. If any parameter falls outside the validated range, the platform generates an automatic deviation record with the specific parameter, deviation magnitude, and duration. The deviation record is linked to the CIP cycle log and becomes part of the sanitation program documentation. The platform also calculates trend lines for each CIP parameter per vessel, detecting developing issues before they result in out-of-specification cycles. A CIP system that maintained 72 degrees Celsius consistently for six months and has gradually declined to 68 degrees Celsius over the past three weeks is flagged for heat exchanger inspection before it reaches the out-of-specification threshold.
We have six CIP systems serving 12 processing vessels across three production lines. Before deploying iFactory AI, our sanitation team spent 18 hours per week reviewing CIP data logs, signing off on cycle completions, and manually compiling trend reports for monthly quality reviews. After deploying the CIP validation module, the system reviews every cycle automatically. The team now spends two hours per week reviewing exceptions — cycles where the system flagged a parameter outside the validated range. In the first three months, the system detected a fouling heat exchanger on the cheese vat CIP that we would not have caught for another four to six weeks under our manual review process. The heat exchanger was cleaned, the CIP cycle time returned to baseline, and we recovered 22 minutes per day of production time that had been lost to extended cleaning cycles.
Robotic Cleaning System Analytics: Verifying What the Human Eye Cannot Reach
Robotic cleaning systems have transformed sanitation in FMCG food and beverage plants, particularly for large vessels, enclosed tanks, and hazardous environments where human entry is restricted or prohibited. But robotic cleaning introduces a verification challenge: if a human cannot enter the vessel to verify cleaning effectiveness, how does the facility confirm that the robot actually cleaned all surfaces to the required standard? The answer is analytics. Robotic cleaning system analytics provide the documented evidence that the robot completed its programmed path, delivered the required pressure and flow at each point, and achieved the cleaning outcome specified in the sanitation program.
Robotic Cleaning Parameter
Manual Verification
iFactory AI Analytics
Path completion
Not verified — operator assumes path completed
Tracked per cycle — path completion percentage recorded with missed zones flagged
Spray pressure at nozzle
Logged as single reading — trend not tracked
Continuous per-cycle trend analysis — predictive alerts for pump or nozzle wear
Surface coverage
Estimated — no measurement
Calculated from position data — coverage area percentage tracked per vessel
Cleaning verification
ATP swab after cycle — no trend analysis
ATP results correlated with robot parameters — cleaning program optimised from historical data
Chemical consumption
Bulk tank level check — no per-cycle tracking
Per-cycle chemical usage tracked and trended — anomalous consumption flagged automatically
From Sanitation Data to Audit-Ready Documentation
The most time-consuming part of sanitation analytics is not the data collection or the analysis. It is the documentation. The SQF, FSSC 22000, and BRC auditors all require documented evidence that the sanitation program is monitored, analyzed, and continuously improved. iFactory AI automates the documentation chain, generating auditor-ready reports that include CIP cycle validation summaries, robotic cleaning verification reports, chemical consumption trend analysis, sanitation PM completion records, and corrective action documentation linked to specific sanitation equipment analytics findings.
Sanitation Report Generation Time
Manual system:
8-12 hours per week
iFactory AI:
15 minutes per week
Manual compilation of CIP logs, chemical usage data, robotic cleaning reports, and PM records from disconnected systems consumes a full day of sanitation management time per week.
Chemical Cost Monitoring
Manual system:
Monthly — reactive
iFactory AI:
Real-time — predictive
Manual chemical tracking detects drift when the monthly consumption report reveals usage above budget. iFactory AI detects drift at the per-cycle level and alerts the team immediately.
Audit Finding Risk
Manual system:
High — missing trend analysis
iFactory AI:
Low — complete evidence trail
Manual sanitation documentation systems frequently receive findings for missing trend analysis, incomplete records, or lack of documented corrective actions. Automated systems eliminate these gaps.
CIP Cycle Drift Detection
Manual system:
4-6 week delay
iFactory AI:
Real-time — per cycle
CIP cycle time degradation caused by heat exchanger fouling or spray device wear is detected immediately when analytics are automated, not weeks later when the monthly review identifies the trend.
Deployment: From Connection to Sanitation Analytics in Weeks
iFactory AI's CIP scheduling and sanitation checklist modules connect to existing CIP system PLCs, robotic cleaning controllers, chemical dosing systems, and CMMS platforms without requiring new sensors or control system modifications. The first sanitation analytics reports are typically available within two to three weeks of deployment.
Week 1
System integration and parameter mapping
Connect to CIP system PLCs, robotic cleaning controllers, chemical dosing sensors, and CMMS. Map temperature, flow, concentration, pressure, and position parameters to analytics templates.
Week 2
Analytics template configuration and historical baseline
Configure CIP validation templates per vessel and product type. Set robotic cleaning verification parameters. Establish chemical consumption baselines. Configure sanitation PM schedules.
Week 3
Validation and report generation
Validate analytics outputs against historical data. Train sanitation team on platform. Generate first round of auditor-ready sanitation analytics reports and compliance documentation.
Week 4+
Continuous monitoring and optimisation
Automated CIP validation runs continuously. Robotic cleaning reports generated per cycle. Chemical consumption tracked in real time. Predictive alerts for heat exchanger fouling, nozzle wear, and pump degradation.
Conclusion
Sanitation analytics is the missing piece in most FMCG food and beverage plant food safety programs. The CIP systems, robotic tank cleaners, and chemical dosing equipment generate the data. What is missing is the analytics layer that converts that data into actionable insights — detection of heat exchanger fouling trends before they cause out-of-specification cycles, verification of robotic cleaning coverage for vessels that humans cannot enter, and auditor-ready documentation that demonstrates the sanitation program is continuously monitored and improved.
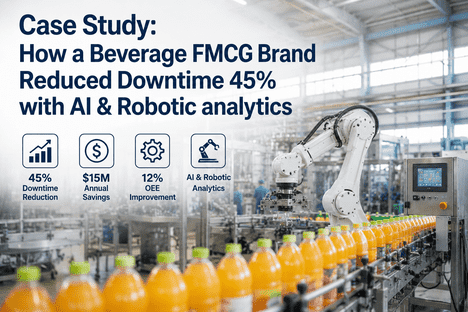
The 15 to 25 percent reduction in chemical spend, 90 percent reduction in audit preparation time, and 30 to 90 minutes per day of recovered production time are not benchmarks. They are the documented outcomes across dairy, beverage, and processed food facilities that have deployed automated sanitation analytics. The sanitation manager who moves from manual log review to automated analytics does not just reduce workload. They eliminate the compliance risk, the chemical waste, and the production lost to undetected CIP cycle degradation that manual systems cannot catch.
iFactory AI's CIP scheduling and sanitation checklist modules are purpose-built for FMCG food and beverage plants — connecting to your existing CIP systems, robotic cleaners, and chemical dosing equipment to deliver automated sanitation analytics, real-time CIP validation, and auditor-ready compliance reports. Book a Demo to see sanitation analytics running on your plant data, or Talk to an Expert to schedule a sanitation analytics readiness assessment for your facility.
Frequently Asked Questions
CIP cycle monitoring is the real-time observation of CIP parameters — temperature, flow rate, chemical concentration, duration — during the cycle. It answers the question of whether the cycle is running within its defined parameters at this moment. CIP validation analytics goes beyond monitoring to answer the question of whether the cycle actually achieved its intended cleaning outcome. Validation analytics compare the actual parameter profile against the validated range for that vessel and product type, document deviations with specific details, and track trend lines that indicate developing issues. Monitoring tells you the cycle is running. Validation analytics tell you the cycle was effective and provides the documented evidence that auditors require. iFactory AI's platform performs both functions, but the validation analytics module is the component that generates the trend analysis and compliance documentation that food safety auditors examine. Book a Demo to see the difference demonstrated on live CIP data.
iFactory AI connects to robotic tank cleaning systems through their native data output interfaces — typically OPC-UA, Modbus TCP, or REST APIs — to ingest position data, pressure readings, flow rates, and cycle status from the robot controller. The platform supports all major robotic cleaning system brands used in FMCG food and beverage applications, including Alfa Laval TankJet, Gamajet, Scanjet, and automated robotic arm systems. The integration does not require modifications to the robot's programming or control system. Data is read from the controller's existing output registers and streamed to the analytics platform. For facilities with multiple robotic cleaning systems from different manufacturers, iFactory AI provides a unified dashboard that aggregates data from all systems into a single sanitation analytics view. Talk to an Expert to verify compatibility with your specific robotic cleaning system model.
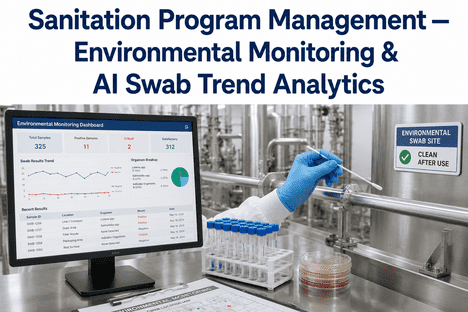
The platform tracks chemical concentration at the point of use, chemical consumption per CIP cycle and per vessel, chemical inventory levels in bulk storage tanks, chemical dosing pump stroke accuracy and degradation trends, water quality parameters that affect chemical effectiveness, and chemical temperature at the point of application. Data is ingested from conductivity cells, titration sensors, flow meters, level sensors, and dosing pump controllers. The platform calculates drift trends for each parameter, comparing current readings against validated ranges and historical baselines. When a parameter drifts beyond the configured threshold, the platform generates a predictive alert that includes the specific chemical, the deviation magnitude, the trend direction, and the recommended corrective action. The chemical monitoring dashboard provides real-time visibility into every chemical parameter across all CIP and robotic cleaning systems in the facility. Book a Demo to see the chemical monitoring dashboard on live data from your facility.
The platform generates sanitation audit documentation in three tiers. Tier one is the daily sanitation summary, which lists every CIP cycle and robotic cleaning cycle completed in the past 24 hours, with validation status for each cycle — parameters within range, parameters with deviations, and corrective actions taken. Tier two is the periodic trend analysis report, covering chemical consumption trends, CIP cycle time trends, robotic cleaning coverage trends, and sanitation PM completion rates for the selected period. Tier three is the comprehensive audit evidence package, which includes the sanitation program description, parameter validation records with trend analysis for the audit period, deviation and corrective action history, and continuous improvement evidence showing that sanitation effectiveness improved over time. All three tiers are generated automatically from the analytics data and are exportable in PDF, Excel, and direct printer formats. Reports are organized by SQF, FSSC 22000, and BRC code element references for easy auditor navigation. Talk to an Expert to see a sample audit evidence package generated for your specific certification scheme.
Yes. iFactory AI's sanitation checklist module supports both automated data ingestion from CIP systems, robotic cleaners, and chemical sensors, and manual data entry for sanitation activities that do not have sensor coverage. The manual checklist module is accessed through the platform's mobile interface or web dashboard and supports configurable checklists for open-surface cleaning, manual tank entry cleaning, floor and drain sanitation, handwashing station verification, and any other sanitation activity that requires documented completion. Manual checklist data is automatically integrated with automated sensor data in the same analytics and reporting engine, providing a unified sanitation program view that includes both automated and manually collected data. The platform tracks manual checklist completion rates, identifies recurring completion delays, and generates the same trend analysis and compliance documentation for manual sanitation activities as it does for automated CIP and robotic cleaning systems. Book a Demo to see the mobile sanitation checklist interface in action.
Your Sanitation Equipment Generates the Data. Let Analytics Turn It Into Actionable Insights and Audit-Ready Evidence.
iFactory AI CIP scheduling and sanitation checklist modules deliver automated CIP validation, robotic cleaning verification, chemical consumption analytics, and auditor-ready compliance documentation — purpose-built for FMCG food and beverage facilities.