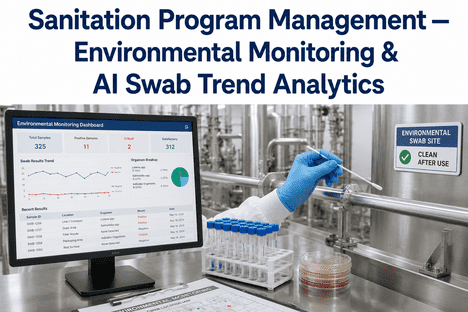
In food, beverage, dairy, and pharmaceutical manufacturing, the sanitation programme is the first line of defence against microbiological contamination — and environmental monitoring (EM) is the evidence that the programme is working. Every swab sample, agar plate, and ATP test result generates data that quality managers must analyse for trends that indicate emerging contamination harbourges before they cause product contamination. Traditional EM programme management relies on spreadsheet tracking, manual trend review, and reactive investigation when a positive result appears — creating a 2–6 week delay between the emergence of a harbourage and the corrective action that eliminates it. AI-driven swab trend analytics platforms ingest historical and real-time EM data — pathogen results (Listeria, Salmonella, Cronobacter), indicator organisms (Enterobacteriaceae, coliforms, E. coli, yeast, mould), and ATP cleanliness readings — to detect harbourage patterns, predict high-risk zones, and recommend targeted sanitation interventions 2–4 weeks before a positive result would trigger a regulatory action. iFactory AI's platform, including its Shift Logbook and environmental monitoring analytics engine, enables quality managers to track EM programme performance, visualise swab trend heatmaps, and automate corrective action workflows from a single dashboard — without replacing existing laboratory information management systems or sampling protocols. Book a Demo to see how iFactory delivers AI-driven environmental monitoring trend analytics for hygienic manufacturing operations.
What Is AI Swab Trend Analytics in Environmental Monitoring?
AI swab trend analytics applies machine learning algorithms to environmental monitoring data — pathogen results, indicator organism counts, ATP readings, and allergen swab data — to automatically detect patterns that indicate emerging contamination harbourges. Unlike traditional EM trend review that relies on manual spreadsheet analysis and subjective interpretation of sporadic positive results, AI systems continuously scan all sampling data simultaneously, correlate results with facility zones, production schedules, sanitation events, and equipment maintenance history, and rank potential harbourges by statistical confidence. Quality managers evaluating AI-driven EM analytics Book a Demo to see how iFactory AI connects with existing LIMS and EM databases.
| Capability | Traditional EM Trend Review | AI Swab Trend Analytics |
|---|---|---|
| Data Sources | Manual spreadsheet entry, LIMS export, paper sampling logs | Automated LIMS integration, real-time swab data, sanitation event records, production schedule correlation |
| Pattern Detection | Manual identification by quality team — depends on individual analyst experience | Automated multivariate pattern detection across all zones, organisms, and time windows simultaneously |
| Detection Timeline | 2–6 weeks from sample collection to harbourage investigation initiation | 24–48 hours from sample result to zone-level harbourage alert with trend visualisation |
| Harbourage Accuracy | Subjective — positive results reviewed in isolation without cross-correlation | Statistical confidence scores with spatial clustering and temporal trend context for each zone |
| Regulatory Reporting | Manual report generation for each audit — days of preparation time | Audit-ready EM trend reports generated on demand with full traceability and corrective action history |
AI Approaches for Environmental Monitoring Trend Analysis
Three primary AI approaches power swab trend analytics in hygienic manufacturing. Each method addresses different EM programme maturity levels, facility types, and pathogen risk profiles. Quality managers evaluating AI approaches Book a Demo to see which fits their facility profile.
Spatial Clustering uses geographic information system (GIS) techniques adapted for facility floor plans to identify zones where positive results cluster beyond expected random distribution. Models like DBSCAN and OPTICS analyse the spatial proximity of swab sample locations and detect statistically significant clusters that indicate potential harbourges. Best suited for facilities with comprehensive zone mapping and consistent sampling location tracking. Delivers zone-level risk heatmaps that quality managers can overlay with sanitation schedules, equipment layouts, and traffic flow patterns to identify harbourage root causes.
Temporal Trend Modelling applies time-series analysis to EM results per zone, per organism, and per sample type. Models such as ARIMA, Prophet, and LSTM networks detect seasonal patterns, production cycle correlations, and gradual positivity rate increases that precede pathogen establishment. Particularly valuable for identifying emerging trends that individual positive results would not trigger — for example, a gradual increase in Enterobacteriaceae positivity rate from 2 % to 8 % over six weeks that precedes a Listeria positive event. Provides quality managers with early warning signals 2–4 weeks before pathogen detection.
Risk Prediction Models use supervised learning to predict the probability of future positive results based on historical data, sampling zone characteristics, sanitation frequency, equipment condition, and production schedule variables. Random forest and gradient-boosted classifiers trained on years of EM data can rank every zone in the facility by predicted risk level for each target organism. Quality managers use risk prediction to dynamically adjust sampling frequency — increasing surveillance in high-risk zones and reducing in low-risk zones — while maintaining or improving overall programme sensitivity. The model continuously updates as new results are entered, improving prediction accuracy over time.
AI Swab Trend Analytics vs. Manual EM Review Comparison
The table below compares AI-driven swab trend analytics against traditional manual EM trend review across the metrics that matter most to quality managers in hygienic manufacturing operations.
| Capability | Manual EM Trend Review | AI Swab Trend Analytics |
|---|---|---|
| Data Ingestion | Manual data entry from lab reports into spreadsheets — 4–8 hours per sampling round | Automated LIMS integration — results populate trend dashboard within minutes of lab entry |
| Harbourage Detection | Manual trend review every 1–4 weeks depending on quality team capacity | Continuous automated scanning — alerts generated within 24 hours of pattern threshold crossing |
| Cross-Correlation | Limited — manually correlating EM results with production, sanitation, and maintenance data is impractical | Automated cross-correlation with production schedule, sanitation events, equipment history, and environmental conditions |
| Corrective Action Tracking | Spreadsheet-based CAPA tracking with manual status updates and follow-up scheduling | Automated CAPA workflow creation with zone-specific corrective action templates, deadline tracking, and effectiveness verification |
| Audit Readiness | Days of report preparation — manual compilation of EM data, trend charts, and corrective action history | Audit-ready EM programme reports with trend visualisations, zone risk heatmaps, and complete corrective action traceability generated in minutes |
Implementation Roadmap for AI-Driven EM Trend Analytics
Deploying AI swab trend analytics follows a structured five-phase sequence that ensures data readiness, model accuracy, organisational adoption, and measurable harbourage reduction advance in parallel.
Expert Review — AI Swab Trend Analytics in Hygienic Manufacturing
We deployed AI swab trend analytics across our ready-to-eat facility approximately eight months ago. The most significant change has been the shift from reactive to proactive environmental monitoring management. Where we used to spend 70 % of our time compiling and reviewing EM data after receiving lab results, we now spend that time investigating and eliminating harbourges before they produce positive results. The system recently identified a harbourage pattern in our raw ingredient staging area that our manual trend review had missed for four months — three sporadic Listeria positives over six months that appeared unrelated when reviewed individually but formed a clear spatial cluster when the AI analysed zone proximity. For quality managers evaluating this technology, the key insight is that AI swab trend analytics does not replace your quality team — it amplifies their effectiveness by eliminating the data management overhead that consumes most of their time and delivering actionable harbourage intelligence that manual review methods cannot detect.
— Director of Food Safety and Quality, Tier 1 Ready-to-Eat Food Manufacturer — SQF, BRCGS, and FSSC 22000 CertifiedConclusion
AI swab trend analytics transforms environmental monitoring from a manual, reactive compliance activity into a predictive, intelligence-driven sanitation programme capability. Machine learning models continuously analyse spatial and temporal EM data patterns, detect harbourage emergence 2–4 weeks before conventional review methods, and deliver ranked zone-level risk assessments with statistical confidence scores. Quality managers achieve 40–60 % reduction in positive pathogen results, 3.5x faster corrective action velocity, and 60–80 % reduction in EM data management overhead. Quality and food safety leaders ready to eliminate harbourage-driven contamination risks Book a Demo to see iFactory AI swab trend analytics deployed in live hygienic manufacturing environments with full Shift Logbook integration.
Frequently Asked Questions
Most hygienic manufacturing facilities require 12–24 months of historical EM data including sample results, zone mapping, and corrective action records for optimal model training. iFactory AI can achieve useful initial results with as little as 6 months of data using pre-trained harbourage signature libraries and transfer learning techniques. The model continues to improve as new data is ingested, with accuracy typically stabilising after 3–4 months of active deployment.
No. AI swab trend analytics complements existing LIMS and EM databases by providing the analytical layer above data storage. LIMS continues to manage sample tracking, lab workflow, and result recording. The AI platform reads from LIMS via standard API connectors and adds automated pattern detection, harbourage alerting, and corrective action workflow automation. The two systems work together — LIMS manages the data, AI extracts the intelligence.
AI swab trend analytics covers the full spectrum of hygienic manufacturing target organisms — pathogens (Listeria monocytogenes, Salmonella spp., Cronobacter sakazakii, pathogenic E. coli, Campylobacter), indicator organisms (Enterobacteriaceae, coliforms, generic E. coli, yeast, mould, aerobic plate count), and cleanliness markers (ATP bioluminescence, protein swabs, allergen swabs). Each organism type receives a separate model instance calibrated to its specific prevalence, seasonality, and zone distribution patterns.
The AI model distinguishes between sporadic positives — random events introduced by equipment, personnel, or raw materials that do not indicate a persistent harbourage — and true harbourage patterns by analysing three dimensions simultaneously: spatial clustering (do positives appear in the same zone repeatedly), temporal recurrence (do positives follow a schedule-correlated pattern), and organism correlation (do multiple organism types trend together in the same zone). Sporadic positives produce random distribution across these dimensions while harbourges produce statistically significant clustering. The model assigns a confidence score to each alert, and quality managers can configure the threshold at which an alert triggers corrective action.
Stage one — LIMS integration and historical data ingestion — typically takes 3–4 weeks. Stage two — baseline computation, zone risk calibration, and trend model training — requires 4–6 weeks. Stage three — pilot deployment with parallel validation — takes 4–6 weeks. Full production deployment with harbourage alerting, corrective action workflows, and audit-ready reporting is achievable within 3–5 months from project initiation, depending on data availability and LIMS integration readiness.