Product recalls are among the most devastating events an FMCG brand can face — costing millions in direct expenses, destroying years of consumer trust overnight, and triggering regulatory scrutiny that can follow a company for decades. Yet the majority of recalls are not inevitable accidents; they are the predictable outcome of reactive quality systems that identify problems only after defective products have already left the facility. Proactive analytics-driven recall prevention is now the defining competitive advantage separating FMCG brands that protect their reputation from those that lose it. This guide breaks down how quality-analytics integration, robotic quality assurance, and asset monitoring combine to make product recall prevention a systematic, measurable discipline — not a matter of luck.
Why FMCG Product Recall Costs Go Far Beyond the Direct Financial Hit
When a major FMCG brand issues a product recall, the press release is only the beginning of the damage. Direct costs — logistics, destruction, retailer chargebacks, regulatory fines — typically range from $10 million to $150 million depending on product volume and distribution reach. But the indirect costs of an FMCG product recall are often larger and longer-lasting: brand equity erosion, lost shelf space, market share surrendered to competitors, and sustained decreases in consumer purchase intent that can persist for three to five years post-recall.
Research consistently shows that consumers who experience a recall-related brand failure are 3.4 times less likely to repurchase from that brand within 12 months — even after the recalled product has been replaced and the safety issue resolved. For private label and premium FMCG products, the reputational damage can be permanent. FMCG brand reputation protection is not a marketing function; it is an operations and quality function, and it starts on the production floor.
The Three Root Causes Behind Most FMCG Product Safety Failures
Effective recall cost prevention in FMCG manufacturing requires understanding where recalls actually originate — not where they are discovered. Most FMCG quality leaders can identify a recall trigger after the fact; the goal of proactive analytics is to identify the upstream process conditions that make recalls possible before any product enters the supply chain. Analysis of FDA, EFSA, and FSA recall data across FMCG categories reveals three dominant root cause clusters.
Equipment Failure and Undetected Process Deviation
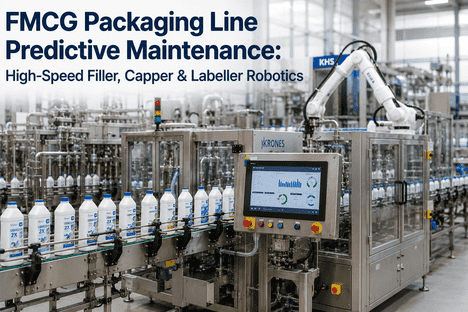
Equipment failure — including metal detector malfunction, filler calibration drift, sealing temperature deviation, and checkweigher tolerance creep — accounts for the largest single category of FMCG product recalls globally. The critical factor is not the failure itself, but the detection latency: in facilities without real-time equipment failure product recall monitoring, deviations frequently persist across multiple production shifts before being identified through end-of-line or post-shipment quality checks. By that point, non-conforming product is often already distributed. Continuous asset monitoring with AI-driven anomaly detection eliminates this latency window entirely, book a demo to see how ifactory's monitoring platform surfaces equipment drift in real time.
Ingredient and Allergen Cross-Contamination
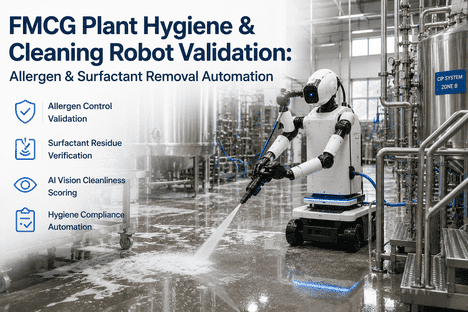
Undeclared allergen contamination — the single most common cause of food and personal care product recalls in developed markets — typically originates not from sourcing failures but from in-process cross-contact events driven by inadequate segregation, incomplete cleaning verification, or line changeover sequence errors. Manual inspection systems cannot reliably detect allergen contamination risk at line speed. Automated quality inspection combined with lot-level ingredient traceability creates the detection density required to identify cross-contamination risk before affected product reaches the packaging stage.
Labeling and Packaging Non-Conformance
Incorrect, missing, or illegible labeling — including allergen declarations, net weight, use-by dates, and country of origin statements — represents a significant and growing share of FMCG recalls, particularly as regulatory labeling requirements increase in complexity across markets. Automated vision inspection systems integrated with production data platforms can validate label placement, legibility, and content correctness at 100% of units produced — a detection rate no manual sampling protocol can match. Brands that have deployed book a demo with ifactory's quality team to assess your current labeling inspection gap.
How Proactive Analytics for Brand Protection Prevents Recalls Before They Begin
Proactive analytics brand protection in FMCG operates on a fundamentally different logic from traditional quality control. Conventional quality systems answer the question: "Did this batch pass inspection?" Analytics-driven recall prevention answers a different question: "What process conditions are converging right now that will cause a failure in the next four hours — and what intervention can prevent it?" The shift from reactive to predictive quality management is what separates facilities that experience recurring recalls from those that have systematically eliminated recall risk from their operational profile. To understand how FMCG product safety analytics can be deployed in your specific production environment, book a demo with ifactory's food and consumer goods compliance team.
Asset Monitoring as the First Line of Defense Against Equipment-Related Recalls
Given that equipment malfunction is the leading single root cause of FMCG product recalls, FMCG product safety analytics must begin with the asset layer. Production equipment in FMCG environments — fillers, sealers, metal detectors, checkweighers, labelers, coding systems — degrades in measurable, predictable ways. Vibration signatures change before bearings fail. Temperature uniformity drifts before seal integrity deteriorates. Rejection rates trend upward before a metal detector misses its first contaminant. These signals are present in equipment data streams weeks before they produce a recall-triggering event — but only if a monitoring platform is in place to detect and act on them.
Recall Readiness Program: What Best-Practice FMCG Brands Do Differently
The distinction between FMCG brands that manage recalls effectively and those that suffer catastrophic brand damage is rarely about whether they experience a quality failure — it is about how rapidly and precisely they can respond when one occurs. A mature recall readiness program built on analytics infrastructure enables FMCG quality teams to compress the time from recall trigger to scope definition from days to hours, limiting consumer exposure, minimizing retail chargeback volume, and preserving the brand equity that public recall events destroy. To book a demo and assess your facility's current recall readiness posture, ifactory's quality analytics team can walk through your existing traceability and monitoring infrastructure.
| Recall Readiness Capability | Manual / Siloed Approach | Analytics-Integrated Approach | Impact |
|---|---|---|---|
| Recall scope definition speed | 24–72 hours | Under 4 hours | 90% faster containment |
| Affected lot identification accuracy | Broad holds (over-recall) | Precise lot-level scope | Up to 95% volume reduction |
| Root cause identification time | Days to weeks | Hours (integrated data) | Faster CAPA closure |
| Regulatory documentation readiness | Manual reconstruction | On-demand export | Immediate regulatory response |
| Consumer and retail notification speed | Delayed by scope uncertainty | Accelerated by precise scope | Reduced brand exposure window |
| Corrective action verification | Assumed from process change | Data-confirmed in real time | Prevents recurrence |
Robotic Quality Assurance: How Automated Inspection Closes the Sampling Gap
Manual quality inspection in FMCG production has a fundamental mathematical limitation: it can sample a fraction of production output, not inspect all of it. At a typical high-speed beverage or ambient grocery line running 400–800 units per minute, even a rigorous manual sampling protocol inspects less than 0.5% of production volume. Robotic quality assurance recall prevention eliminates this gap by deploying automated vision, weight, and integrity inspection systems at line speed — delivering 100% unit-level coverage that no manual protocol can approach.
The operational value of 100% inspection coverage extends beyond defect detection. When every inspection event is logged with timestamp, line ID, and lot code, the resulting dataset enables statistical process analysis that reveals defect pattern trends hours before they would be visible in sampled data — providing quality teams with the lead time needed to intervene before non-conforming product reaches case packing. For FMCG brands operating in categories with low consumer defect tolerance — infant nutrition, pharmaceutical-adjacent wellness products, premium food — 100% automated inspection is no longer optional; it is the expectation of retail partners and regulators alike. Learn more about deploying automated quality inspection at your facility by visiting book a demo with ifactory's robotics and quality team.
Machine vision for seal integrity and fill level inspection operates at line speed without the fatigue-driven accuracy degradation that makes human visual inspection unreliable beyond 20–30 minutes of continuous attention. Vision systems integrated with rejection conveyors and production data platforms create unbroken inspection records that satisfy both internal quality governance and third-party audit requirements.
Automated checkweighing integrated with production analytics enables real-time statistical process control at the weight inspection point — triggering filler adjustment recommendations when weight distribution trends indicate drift, preventing both underfill regulatory exposure and overfill waste simultaneously. This integration is a key component of effective quality analytics integration.
Label and code verification systems using optical character recognition and barcode grade analysis confirm that date codes, batch codes, allergen declarations, and nutritional information are correctly printed, legible, and accurately placed on every unit — catching the labeling errors that, undetected, become the most legally complex and brand-damaging category of FMCG product recalls.
Deploying Analytics-Driven Recall Prevention: A Practical FMCG Implementation Roadmap
Transforming an FMCG quality operation from reactive inspection to analytics-driven recall prevention is a staged journey, not a single deployment event. The most successful implementations follow a risk-tiered prioritization logic — activating monitoring and inspection capabilities on the highest-risk lines and control points first, generating measurable recall risk reduction before full network coverage is complete.
Conduct a structured recall risk assessment across all production lines, identifying the process parameters, equipment assets, and ingredient handling points with the highest historical contribution to quality deviations. Map critical control points to the monitoring and inspection capabilities required to achieve real-time detection coverage. Prioritize lines by risk tier for phased deployment.
Deploy continuous asset monitoring across critical equipment — metal detectors, fillers, sealers, and checkweighers on priority lines. Establish AI performance baselines within 14–21 days of data ingestion. Configure deviation alert thresholds calibrated to the product-specific quality specification for each monitored asset. Connect monitoring outputs to quality analytics dashboards accessible by quality managers across shifts.
Integrate robotic quality assurance systems — vision inspection, automated checkweighing, label verification — with the production analytics platform. Configure inspection data feeds to populate real-time quality dashboards with defect rate trending, rejection event logs, and SPC charts. Validate inspection system accuracy against known defect reference samples before live deployment on each line.
Integrate ingredient lot traceability from receiving through finished product dispatch, creating an unbroken digital chain from supplier certificate through customer delivery. Conduct a mock recall exercise using the integrated traceability and analytics platform — measuring scope definition speed, lot identification accuracy, and regulatory documentation generation time against recall readiness benchmarks.
The Business Case for FMCG Analytics Investment in Recall Prevention
For FMCG quality leaders building the investment case for analytics-driven recall prevention, the financial model is compelling at even conservative recall probability assumptions. A single Class I food recall affecting a mid-size FMCG brand — $25 million in direct costs, 15% market share erosion in core categories, and $8 million in legal and regulatory response — represents a loss that dwarfs the lifetime cost of a comprehensive quality analytics and monitoring platform deployment. The ROI calculation is not "what does this platform save us?"; it is "what is one prevented recall worth?"
Product Recall Prevention Is Now a Strategic Imperative for Every FMCG Brand
The FMCG brands that will define brand reputation leadership over the next decade are those that have embedded analytics-driven recall prevention into the operational fabric of their production systems — not as a compliance exercise, but as a competitive strategy. Proactive analytics brand protection through quality-analytics integration, robotic quality assurance, continuous asset monitoring, and end-to-end lot traceability is no longer the exclusive domain of the largest global players. Purpose-built platforms like ifactory make this capability deployable and cost-effective for mid-size and growing FMCG brands that cannot afford the brand exposure of a preventable recall.
The question for FMCG quality leaders is not whether to invest in analytics-driven recall prevention — it is how quickly that investment can be deployed before the next quality event tests systems that were never designed to prevent it. To assess what a quality-analytics integration and asset monitoring deployment would look like for your specific production environment, book a demo with ifactory's FMCG quality team today.