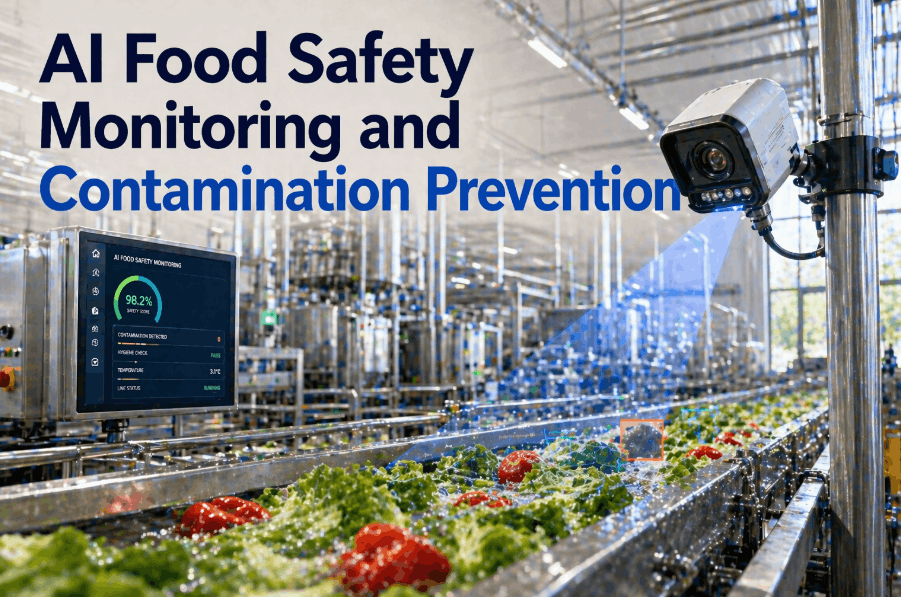
Clean-in-Place (CIP) systems are the critical technical heartbeat of food and beverage sanitation, yet they remain one of the most resource-intensive and historically opaque processes on the plant floor. Without high-resolution data, manufacturers often rely on "over-sanitation" as a safety margin—wasting millions of gallons of water, tons of chemicals, and gigajoules of energy—or worse, they under-sanitize, risking catastrophic batch contamination and federal recalls. CIP system analytics transforms these hidden sanitation cycles into visible, validated, and highly optimized operational assets. By leveraging AI-driven platforms like iFactory (Book a Demo), manufacturers can automate cycle validation, precisely optimize chemical titration, and reduce unplanned downtime through predictive flow and temperature monitoring.
Is Your CIP System Optimized for Safety and ROI?
See how iFactory automates CIP validation, reduces water and chemical waste by up to 25%, and ensures 100% compliance with FSMA and BRCGS sanitation standards through continuous digital monitoring.
The 4 T’s of Digital CIP: Time, Temperature, Titration, and Turbulence
To achieve true, audit-proof sanitation validation, an analytics platform must continuously monitor and correlate the "4 T’s" of CIP: Time (contact duration), Temperature (thermal kill efficacy), Titration (chemical concentration), and Turbulence (flow velocity and mechanical action). In manual or legacy systems, these parameters are often logged only at the beginning and end of a cycle, leaving the critical middle phases unverified. Digital CIP analytics captures high-resolution telemetry from conductivity sensors, magnetic flow meters, and precision RTDs, creating a multi-dimensional "cleaning signature" for every individual cycle, batch, and line.
By correlating these variables in real-time using AI, iFactory identifies "wash-out" events where chemicals were under-dosed due to pump cavitation or where temperatures dropped below the lethal threshold for specific pathogens like Listeria or Salmonella. This level of technical depth allows quality teams to move from reactive swab-testing to proactive, data-driven validation. Many plants Book a Demo after discovering that their "standard" 45-minute wash cycle could be safely optimized to 32 minutes through live turbulence and conductivity monitoring—recovering over 400 hours of production time annually.
Cycle Validation (FSMA/BRC)
Automate the creation of immutable cleaning reports that satisfy the most rigorous unannounced audits. iFactory logs every CIP step—pre-rinse, caustic wash, acid rinse, and final sanitization—mapping them directly to regulatory requirements for contemporaneous process verification. This eliminates the risk of missing supervisor sign-offs or illegible paper logs.
Titration & Chemical Control
Monitor conductivity and pH in real-time to prevent both under-dosing and expensive chemical over-dosing. AI identifies valve leaks, dosing pump drifts, or concentration spikes that lead to chemical waste, wastewater surcharge penalties, or hazardous residue risks on production lines. Achieve consistent ppm levels across all sanitation shifts.
Thermal Efficacy Monitoring
Ensure every square inch of the product circuit—including dead-legs and tank ceilings—reaches the required temperature for the specified time. iFactory tracks the "Total Heat Unit" delivery, identifying cold spots caused by steam supply fluctuations or failing heat exchangers. Verify the pathogen kill-step with absolute data certainty.
Turbulence & Flow Velocity
Mechanical action is critical for biofilm removal. The platform monitors Reynolds numbers and flow rates to ensure turbulent flow is maintained throughout the circuit, preventing "shadow zones" where sanitation fails. The system alerts if velocity drops below the validated 1.5 m/s threshold required for effective mechanical scrubbing.
Biofilm Prevention: Predicting Pathogen Harborages Through Data
Biofilms are the "invisible enemy" in food manufacturing, often surviving standard CIP cycles if the turbulence or chemical concentration drifts even slightly. iFactory’s biofilm predictive module analyzes long-term trends in sanitation signatures, identifying lines where "slow-drift" in flow velocity or temperature creates ideal conditions for harborage. By correlating these technical drifts with environmental swab data, the platform provides a predictive risk score for every circuit in the facility.
When a risk threshold is breached, the system automatically recommends an "Aggressive Sanitation Cycle"—adjusting titration and thermal duration specifically to disrupt emerging biofilms before they can seed into production batches. This proactive approach to Section 4.11 compliance ensures that your facility moves beyond "Clean-to-the-Eye" and achieves "Technically Sterile" status, a critical differentiator for Grade AA+ BRC ratings. Book a Demo to see biofilm risk modeling.
Quantifying Water and Energy Recovery in Digital CIP Operations
CIP systems are typically the largest consumers of water and steam in a food plant. Analytics allows for the implementation of Advanced Water Recovery Systems (WRS) by precisely identifying when rinse water is clean enough to be diverted for reuse in pre-rinse cycles. iFactory’s turbidity and conductivity sensors provide the high-speed "Go/No-Go" signals needed to automate these recovery loops, often reducing total water intake by 18-25% while maintaining absolute safety thresholds. Book a Demo to see water recovery ROI modeling.
Energy optimization is achieved by monitoring heat exchanger efficiency during the CIP heating phase. Fouled or scaled heat exchangers require significantly more steam to reach set-point temperatures, increasing energy costs per cycle and extending sanitation windows. iFactory identifies these efficiency drifts in real-time, triggering predictive maintenance work orders to descale exchangers before energy waste compounds. This data-driven approach to utility management transforms CIP from a "necessary cost" into a primary driver of the plant’s sustainability and ESG goals.
| CIP Resource Metric | Manual Baseline | AI-Optimized Goal | Primary Recovery Lever | Annual ROI Impact |
|---|---|---|---|---|
| Water Usage | Fixed-timer rinses | Turbidity-based rinses | -22% Water Volume | $45k – $110k |
| Chemical Spend | Manual titration checks | Continuous conductivity | -18% Chemical Cost | $30k – $85k |
| Energy (Steam) | Fixed temp set-points | Exchanger delta-T optimization | -12% BTU per Cycle | $25k – $60k |
Optimize Your CIP Cycles with Live Technical Evidence
iFactory eliminates sanitation guesswork with real-time signature monitoring, automated reporting, and resource recovery logic tailored to your specific facility layout.
Predictive CIP Hardware Health: Preventing Sanitation Downtime
A CIP system is only as reliable as its physical components—pumps, valves, and heating elements. When a CIP supply pump fails or a chemical dosing valve sticks during the sanitation window, it doesn't just delay production; it creates a risk of unvalidated batches and emergency maintenance overtime. iFactory’s hardware analytics engine monitors vibration, amperage, and valve actuation times to identify "pre-failure" signatures in your sanitation equipment.
By applying predictive maintenance (PdM) to the CIP skid, manufacturers can schedule repairs during planned changeovers rather than during the critical "Sanitation Shift." This ensures that the CIP system is always at peak performance, delivering the exact turbulence and titration levels required for validation. Book a Demo to see predictive CIP hardware monitoring in action.
Quantifying the Operational Risk of CIP Analytics Gaps
The cost of a single sanitation failure is measured in millions of dollars in recall fees and brand damage, yet many plants still rely on "Faith-Based Sanitation"—the dangerous assumption that if the pump is on, the circuit is clean. Deferred investment in CIP analytics leaves the facility vulnerable to three primary risks: unvalidated pathogen kill-steps, chemical cross-contamination, and unannounced audit failures. iFactory provides the visual, time-stamped evidence needed to move from assumption to absolute data-driven certainty.
How AI-Driven Analytics Reshapes Modern Sanitation Workflows
Traditional CIP management relies on static "Cleaning Cards" and annual validation audits. AI-driven CIP analytics inverts this by providing Continuous Validation. The platform continuously compares the live cleaning signature against the "Golden Batch" profile, identifying subtle drifts in temperature or pressure that indicate failing gaskets, pump wear, or mineral scaling in the product lines before they lead to a sanitation failure or batch contamination event.
iFactory’s predictive engine also optimizes the sanitation schedule itself based on live production data. By correlating product run-times, ingredient types, and allergen loads with CIP efficacy, the system recommends the shortest possible safe cleaning cycle for each specific product changeover. This evidence-based optimization consistently reduces changeover downtime by 12-18%, allowing for more production runs per shift without compromising rigorous hygiene standards. Book a Demo to see your changeover optimization potential.
CIP Performance Roadmap: From Baseline to Autonomous Sanitation
CIP System Analytics — Frequently Asked Questions
Can iFactory's digital CIP records satisfy a BRC or SQF auditor?
Yes. iFactory generates time-stamped, unalterable digital cleaning reports that meet the "Process Verification" requirements of BRCGS Issue 9 and SQF Edition 9. Auditors can view detailed temperature curves and chemical concentration logs on-screen, often eliminating the need for physical paper archive reviews and reducing audit duration by 40%.
How do you measure turbulence and mechanical action in the CIP circuit?
We calculate the Reynolds Number (Re) in real-time by correlating flow meter data with pipe diameter and fluid viscosity. BRC requirements typically mandate a minimum flow velocity (e.g., 1.5 m/s) to ensure mechanical removal of soils—iFactory provides continuous verification of this velocity across every single sanitation cycle.
Does the platform help with chemical titration for high-risk allergens?
Absolutely. By monitoring conductivity and pH with high precision, iFactory ensures that chemical concentrations remain within the validated range for allergen removal. The system provides an automated "Allergen Clear" signal only when the titration, temperature, and turbulence signatures meet the required safety threshold.
What is the average payback period for CIP analytics investment?
Most plants achieve full ROI in 5–14 months. This is driven by three factors: direct chemical/water savings (20%), production uptime recovery from shorter changeovers (40%), and risk avoidance of sanitation-related batch failures and federal recalls (40%).
Can we integrate analytics into a legacy CIP skid without a PLC upgrade?
Yes. iFactory can use "bolt-on" IoT sensors (clamping ultrasonic flow meters, non-invasive RTDs) to capture the necessary telemetry without requiring a costly PLC or SCADA system overhaul. This allows for rapid digitization of legacy sanitation assets without production interruptions.
Digitize Your CIP System for Safety and Efficiency
iFactory delivers live cycle validation, chemical titration tracking, and resource recovery — purpose-built for high-compliance food and beverage plants.