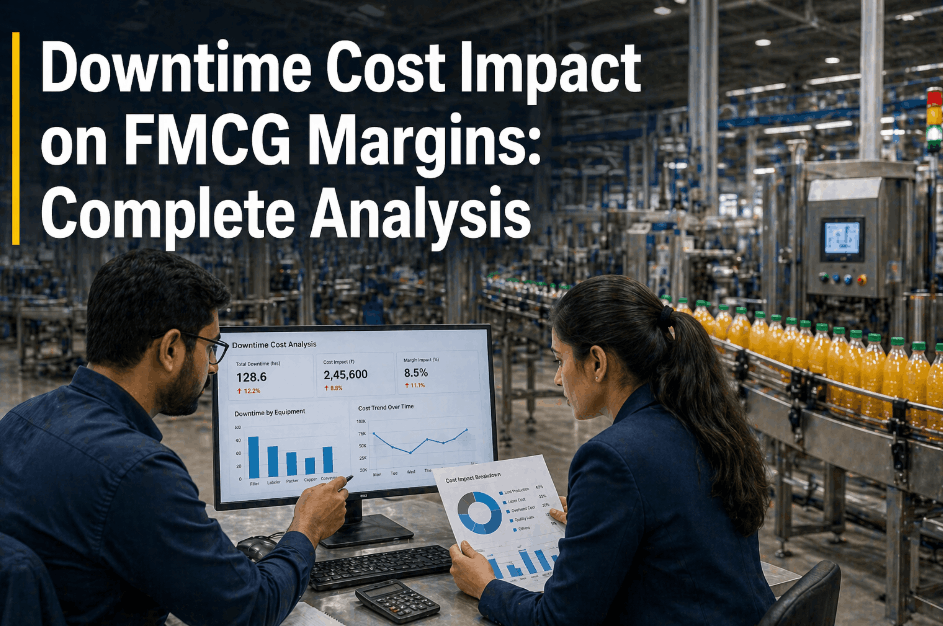
In FMCG manufacturing, unplanned downtime is not merely an operational inconvenience — it is a direct, measurable assault on your profit margins. Every minute a filler, wrapper, or packaging line stands idle translates into compounding financial losses that cascade across production scheduling, labor costs, material waste, and customer commitments. Understanding the true downtime cost in FMCG is the first step toward building a financial case for prevention investment. If you'd like to see how leading FMCG facilities calculate and control these losses in real time, you can Book a demo to explore our production intelligence platform.
Are Hidden Downtime Costs Silently Eroding Your FMCG Margins?
Get a complete financial picture of production loss and build the ROI case for downtime prevention — powered by real-time asset intelligence.
The True Per-Hour Downtime Cost in FMCG: What the Numbers Actually Reveal
The FMCG sector operates on notoriously thin margins — typically between 5% and 15% net profit for food and beverage manufacturers. Within this context, the financial impact of downtime on FMCG production is devastating. Industry benchmarks suggest that a single hour of unplanned downtime on a high-speed packaging line can cost between £8,000 and £35,000, depending on line speed, product SKU value, and contracted customer commitments. Yet most production sites measure downtime only in hours lost, not in pounds eroded — a critical gap in financial visibility that allows FMCG margin erosion to go unchecked. The true figure is typically 2.5 to 4 times the headline lost-revenue number, and many operations still manage this exposure with spreadsheets and hindsight — a reactive posture that guarantees losses will recur. You can Book a demo to see how our platform quantifies these losses automatically, in real time, across every asset on your floor.
Lost Throughput Revenue
The immediate revenue loss from units not produced during the downtime window. Calculated using line speed, product margin, and duration of the stop event.
In-Process Material Waste
Product in transition during a stop event is frequently scrapped. For food manufacturers, this includes perishable raw materials and partially filled packaging that cannot be re-used.
Idle Labor Cost
Operators, technicians, and line supervisors continue to draw wages during unplanned stops. On a fully staffed 30-person line, idle labor can add £400–£900 per hour to the total downtime bill.
Customer Penalty Clauses
Major FMCG retailers enforce service-level agreements with financial penalties for missed delivery windows — a downstream cost that is rarely captured in standard downtime reporting.
Overtime Recovery Premiums
Volume lost during a downtime event must be recovered, typically at 1.25x to 1.5x labor cost. This premium directly compresses the margin on the recovered production run.
Expedited Logistics Cost
Delayed production that must be shipped faster to meet customer windows incurs premium freight costs, further amplifying the total FMCG downtime economics beyond the factory gate.
Per-Hour Downtime Cost by Equipment Type: FMCG Benchmarks
Not all downtime is equal. The equipment failure cost in FMCG varies dramatically based on asset criticality, line speed, and the product being manufactured. A stoppage on a high-speed beverage filler running at 36,000 units per hour carries a fundamentally different financial signature than a stoppage on a secondary labelling machine. The table below provides benchmark cost ranges by asset category to support more precise downtime financial modeling for FMCG operations.
| Equipment Type | Typical Line Speed | Est. Cost Per Hour Stopped | Primary Loss Driver | Margin Impact |
|---|---|---|---|---|
| High-Speed Filler (Beverage) | 30,000–50,000 u/hr | £18,000–£35,000 | Lost throughput + waste | Critical |
| Flow Wrapper (Confectionery) | 200–600 packs/min | £8,000–£22,000 | Material waste + labour | High |
| Cartoning Machine | 100–350 cartons/min | £6,000–£14,000 | Throughput loss | Medium |
| Tray Sealer / Thermoformer | 40–120 trays/min | £5,000–£12,000 | Perishable waste + delay | High |
| Palletiser / End-of-Line | Full line constraint | £4,000–£9,000 | Full line stoppage cascade | Medium |
| Labeller / Coder | Varies | £2,000–£6,000 | Compliance hold risk | Moderate |
These figures represent estimated ranges based on industry-reported data and should be modelled against your specific line configuration, product margin profile, and customer contract terms. To build a precise financial model for your facility, you can Book a demo and work with our engineering team on a site-specific downtime cost calculator.
How Cascading Production Losses Amplify FMCG Margin Erosion
One of the most underestimated dimensions of FMCG production loss cost is the cascade effect. A single asset failure does not confine its damage to the stopped line. In integrated FMCG production environments — where upstream mixing, filling, and downstream packaging operate in tight sequence — a 45-minute stop on a critical filler can cascade into 3 to 4 hours of downstream disruption, including buffer depletion, cleaning-in-place (CIP) cycle restarts, and cold-chain holds for temperature-sensitive products. This multiplier effect means that the true production downtime cost analysis must account for the entire value stream, not just the stopped asset.
Asset Failure Event
A mechanical or electrical failure stops a critical asset. The clock starts immediately — every second of diagnostic delay compounds the financial exposure.
Buffer Depletion & Upstream Backup
Upstream processes continue until buffers fill, then halt — spreading the stoppage impact backward through the production sequence and creating work-in-progress (WIP) quality risk.
Quality Holds & Compliance Risk
Temperature-sensitive or time-critical products in the buffer zone may require quality assessment or disposal — adding material cost and regulatory complexity to the financial impact.
Recovery Run & Schedule Compression
Once the asset is restored, the production schedule must be compressed to recover lost volume — displacing planned maintenance windows and creating secondary risk of further equipment failure.
Customer & Commercial Fallout
Delayed deliveries trigger SLA penalties, expedited freight costs, and retailer relationship damage — costs that are absorbed weeks after the original stop event and rarely connected to their root cause in financial reporting.
Building the ROI Case for Downtime Prevention Investment in FMCG
The most powerful shift in downtime prevention ROI thinking occurs when operations directors stop treating maintenance investment as a cost line and start modeling it as a margin protection mechanism. A structured financial model for FMCG downtime economics compares the annualized cost of unplanned stoppages — using the complete cascade cost methodology described above — against the total cost of ownership for a predictive maintenance and production intelligence platform. The math is typically decisive. Facilities that implement data-driven downtime prevention consistently report OEE improvements of 6 to 12 percentage points within 18 months, translating directly into recovered margin contribution that dwarfs the technology investment. In food manufacturing specifically, where FMCG profit impact from downtime intersects with food safety compliance costs, the financial case is even more compelling. You can Book a demo and we'll walk through a financial model built on your facility's actual OEE and margin data.
Sum of all unplanned stoppage hours × weighted average cost per hour, including cascade multipliers, material waste, labour premiums, logistics penalties, and commercial fallout. Most FMCG sites underestimate this figure by 40–60%.
A 5-percentage-point OEE improvement on a mid-size FMCG line running at £20,000/hr throughput value represents £2.5M+ in annual recovered margin contribution — before accounting for quality, waste, and compliance savings.
The total cost of ownership for a modern production intelligence platform — including hardware, software, and integration — is typically recovered within 8 to 14 months on a single high-value FMCG line.
Dividing total downtime exposure by platform investment cost produces the margin protection multiple — the financial return for every pound invested in prevention. Industry benchmarks consistently show multiples of 3x to 7x over a 3-year horizon.
Reactive vs. Predictive: The Downtime Cost Equation Compared
The operational and financial difference between a reactive maintenance posture and a predictive one is not incremental — it is structural. The table below illustrates how FMCG margin impact accumulates differently across the two approaches, helping operations and finance leaders align on the priority for investment. Many FMCG manufacturers find that once this comparison is expressed in financial terms rather than maintenance KPIs, the board-level case for platform investment becomes straightforward. To review a customized version of this analysis for your facility, you can Book a demo with our production economics team.
| Financial Dimension | Reactive Maintenance | Predictive / Data-Driven | Margin Differential |
|---|---|---|---|
| Unplanned Stoppage Frequency | 8–15 events/month per line | 1–3 events/month per line | High |
| Average Stoppage Duration | 45–120 minutes | 10–25 minutes | High |
| Material Waste Rate | 1.8–3.5% of throughput | 0.4–0.9% of throughput | Medium |
| Overtime Recovery Cost | Frequent, unbudgeted | Rare, planned | High |
| Customer Penalty Exposure | Regular SLA breaches | Near-zero breach rate | High |
| OEE Performance | 55–68% | 78–88% | Critical |
5 Steps to Quantify and Reduce Downtime Cost in Your FMCG Facility
Transforming downtime from a vague operational metric into a precise financial control variable requires a structured methodology. The following five-step framework is used by leading FMCG manufacturers to build visibility, accountability, and ultimately a prevention-first culture around production loss cost management.
Establish a Complete Downtime Cost Model
Move beyond simple lost-throughput calculations. Build a financial model that captures all six cost layers: throughput loss, material waste, idle labour, overtime recovery, logistics premium, and customer penalties. This baseline is the foundation of all subsequent ROI analysis.
Classify Assets by Financial Criticality
Rank every production asset by its per-hour downtime cost contribution. This criticality ranking — not asset age or maintenance preference — should drive the prioritisation of predictive monitoring investment and planned maintenance frequency.
Deploy Real-Time OEE Monitoring on Critical Assets
Instrument your highest-cost assets with real-time telemetry that captures micro-stops, speed losses, and performance degradation before they escalate into full stoppages. Visibility at this level transforms the FMCG downtime cost analysis from retrospective to predictive.
Integrate Financial KPIs into Shift-Level Reporting
Express downtime in pounds per shift, not just minutes. When operators and supervisors see the financial impact of every stoppage in real time, the cultural shift toward ownership and prevention accelerates dramatically — this is the connection between operational data and FMCG margin impact awareness on the shop floor.
Close the Loop with a Quarterly Prevention ROI Review
Formal quarterly reviews that compare prevented downtime cost against platform investment keep the financial case for prevention alive at board level. This governance loop ensures that maintenance improvement is treated as a margin strategy, not a cost overhead — sustaining investment and focus over the long term.
Stop Measuring Downtime in Minutes. Start Measuring It in Margin.
Our production intelligence platform gives FMCG manufacturers a complete financial picture of downtime exposure — and the predictive tools to eliminate it before it strikes.
Frequently Asked Questions: Downtime Cost in FMCG
How do you calculate the true cost of downtime in an FMCG facility?
True downtime cost requires summing six distinct layers: lost throughput revenue, in-process material waste, idle labour cost, overtime recovery premiums, expedited logistics, and any customer penalty charges triggered by service-level failures. Most facilities only capture the first layer, which means their reported downtime cost underestimates actual FMCG margin erosion by 40–60%.
Which FMCG equipment types carry the highest downtime cost per hour?
High-speed fillers in beverage manufacturing typically carry the highest per-hour cost — often £18,000 to £35,000 — due to the combination of extreme throughput rates, perishable material risk, and the tight supply chain commitments associated with major retailer accounts. Flow wrappers and thermoformers in chilled food manufacturing also carry high per-hour costs due to perishable WIP risk.
What is a realistic ROI timeline for downtime prevention investment?
For most FMCG operations deploying production intelligence and predictive maintenance technology on high-criticality assets, the platform investment is recovered within 8 to 14 months. Over a 3-year horizon, the downtime prevention ROI multiple typically ranges from 3x to 7x, driven by OEE improvements of 6 to 12 percentage points and corresponding margin contribution recovery.
How does downtime affect food safety and regulatory compliance costs?
Unplanned stoppages in food manufacturing can create additional compliance cost through temperature excursion holds, CIP restart requirements, and batch traceability complexity. Product that cannot be cleared for release following a stoppage event must be disposed of — adding both direct material cost and potential regulatory documentation burden that amplifies the total food manufacturing downtime cost.
Can small and mid-size FMCG manufacturers justify downtime prevention technology investment?
Yes. The financial case for downtime prevention technology is proportional to throughput value and downtime frequency — not facility size. A mid-size FMCG operation running a single high-value packaging line at 60–70% OEE typically has sufficient unplanned stoppage exposure to justify and rapidly recover a platform investment, particularly when customer penalty clauses and perishable waste are included in the cost model.