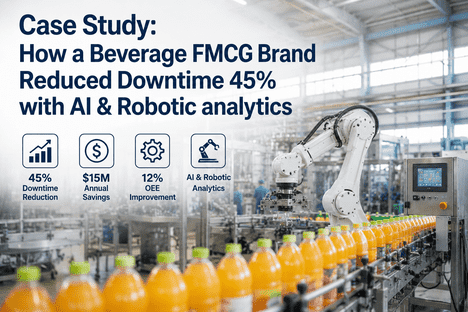
Case Study: How a Beverage FMCG Brand Reduced Downtime 45% with AI & Robotic analytics
By Seren on June 13, 2026
This case study documents how a major beverage FMCG manufacturer operating 8 production facilities across three countries, producing 2.4 billion units annually across carbonated soft drinks, juices, and water deployed iFactory's AI-powered predictive analytics platform and robotic inspection programme to eliminate the unplanned downtime that was costing them $33M per year. With over 340 production lines, 12,000+ assets under maintenance, and a workforce of 180 maintenance technicians, the business operated in a high-volume, low-margin environment where every hour of unplanned downtime directly eroded profitability. Within 18 months of platform deployment, the manufacturer achieved a 45% reduction in unplanned downtime across all 8 facilities, $15M in annual maintenance cost savings, a 12-point OEE improvement from 68% to 80%, and a projected enterprise-wide ROI of 4.2x. Book a Demo to review the complete case study data and deployment methodology for your beverage production network.
AI-powered predictive analytics and robotic inspection across 8 facilities, 340+ lines, and 12,000+ assets — delivering measurable results in under 18 months.
Why Reactive Maintenance Was Costing $33M Per Year
Before iFactory deployment, the maintenance operation was characterised by reactive firefighting rather than planned intervention. Root cause analysis conducted at programme start identified four interconnected failure patterns that together accounted for 91% of all unplanned downtime events across the network. Fillers, carbonation systems, and pasteurisers had no vibration, temperature, or pressure monitoring meaning the first sign of trouble was a catastrophic failure during production. Robotic palletisers at three facilities experienced repetitive joint and gripper failures that took 6–12 hours to repair. Clean-in-place (CIP) systems accumulated chemical residue and flow blockages undetected until a sanitation cycle failed mid-production. Conveyor systems across all sites had no centralised health monitoring, so bearing failures, belt tracking issues, and motor overloads were discovered only when a line stopped.
FOUR ROOT CAUSES — 91% OF ALL UNPLANNED DOWNTIME
1
No predictive visibility on critical assets — fillers, carbonation systems, and pasteurisers had zero condition monitoring; 38% of all downtime events came from this gap alone
2
Robotic system failures undetected until breakdown — palletiser joint wear, gripper misalignment, and servo drive degradation discovered only after line stoppages averaging 8 hours each
3
CIP system reliability blind spots — chemical dosing drift, pump cavitation, and heat exchanger fouling accumulated without detection, causing 22 sanitation failures in 12 months
4
Conveyor network fragmentation — no centralised health monitoring across 18 miles of conveyor; bearing failures, belt tracking drift, and motor overloads discovered only after line stoppages
Filling machines in carbonated soft drink production operate at speeds of 40,000–80,000 bottles per hour, with filler valves, carbonation pressure regulators, and pasteuriser heat exchangers under constant thermal and mechanical stress. A single filler valve failure can cause product overflow, glass breakage, or fill weight deviation — resulting in 15–30 minutes of lost production and up to 20,000 units of scrapped product. Before iFactory, these assets had no condition monitoring; failures were discovered only when product quality alarms triggered or the line stopped. iFactory ingested filler bowl vibration, valve actuation timing, carbonation pressure stability, pasteuriser temperature zone differentials, and CIP return flow data into ML models that predicted valve seal degradation 2–3 weeks in advance, heat exchanger fouling 5–7 days before efficiency loss, and carbonation membrane failure with 78% accuracy. Book a Demo to see iFactory's filler line prediction models in production.
2-3 week lead time78% prediction accuracy38% of downtime events
02
Robotic Palletiser & Packaging System Condition Monitoring
Robotic palletising systems across three facilities handled over 1.2 million units per day per site, with six-axis industrial robots operating 20 hours per day. Joint bearing wear, gripper pad degradation, and servo drive current drift were the dominant failure modes — each causing 6–12 hours of unplanned downtime for repair or replacement. iFactory connected to each robot's servo drive telemetry, joint temperature sensors, gripper cycle counters, and vision system error logs. ML models trained on historical joint failure data detected precursor signatures — increased servo current draw, joint temperature excursions above baseline, and gripper position drift — 3–5 days before failure. Alerts routed directly to maintenance teams with specific joint identification, predicted remaining cycles, and recommended intervention window. Review the complete robotic health monitoring deployment for your beverage facility by requesting a demo.
3-5 day predictionRobotic joint + gripper71% intervention success
03
Conveyor Network & CIP System Health Surveillance
Conveyor systems spanning 18 miles across 8 facilities had no centralised monitoring before deployment. Bearing temperature rise, belt tracking deviation, motor current spikes, and gearbox vibration were monitored only during quarterly lubrication rounds. CIP systems faced similar gaps — chemical dosing pump degradation, spray ball fouling, and heat exchanger scaling developed over weeks without detection until a sanitation cycle failed, forcing a line shutdown and manual cleaning. iFactory deployed IoT vibration and temperature sensors on conveyor drive units and CIP pumps, integrating data through existing PLC infrastructure. The Shift Logbook captured operator CIP cycle reports and conveyor inspection findings alongside sensor data, enabling the platform to distinguish between normal operating variation and early-stage failure signatures.
18 miles of conveyorCIP flow + temp monitoringShift Logbook correlation
How iFactory Transformed Beverage Plant Telemetry Into Predictive Intelligence
iFactory is the AI software intelligence layer for beverage manufacturing — not a sensor manufacturer or hardware vendor. The platform integrates with existing PLCs, SCADA systems, robotic servo drives, CIP control panels, ERP systems (SAP, Oracle), and IoT sensor gateways already deployed across your production facilities. The Shift Logbook captures operator shift reports, daily inspection findings, and maintenance notes alongside the real-time sensor stream, creating a unified data fabric for predictive model training and fleet-wide reliability analysis. Book a Demo to see how iFactory connects your beverage plant telemetry to predictive intelligence.
Vibration · motor current · belt tracking · bearing temp
Bearing, belt & motor degradation forecast
$1.6M conveyor downtime saved
BEVERAGE FMCG — AI & ROBOTIC ANALYTICS CASE STUDY
45% Downtime Reduction $15M Annual Savings 12pt OEE Gain
iFactory's AI-powered predictive analytics and robotic inspection platform connects your beverage production floor data to actionable intelligence — giving maintenance and production teams the visibility they need to prevent failures before they happen.
Predictive Analytics Use Cases for Beverage FMCG Manufacturing
Carbonated Soft Drinks
Filler Valve & Carbonation System Prediction
Continuous
Filler valve seal degradation and carbonation pressure instability are the leading causes of fill weight deviation and product quality loss in CSD production. iFactory monitors valve actuation timing, bowl pressure stability, CO2 flow consistency, and filler bowl vibration. ML models trained on 24 months of historical filler performance data predict valve seal failure 2–3 weeks in advance, enabling preventive seal replacement during scheduled flavour changeovers. Carbonation membrane fouling is detected 5–7 days before CO2 absorption efficiency drops below specification. Every prediction event is logged in the Shift Logbook with full traceability to the sensor data that triggered the alert.
Robotic palletisers in beverage plants handle 1.2M+ units daily, with joint bearing wear and gripper pad degradation causing the longest unplanned repairs — averaging 8 hours per event. iFactory connects to each robot's servo drive telemetry, joint temperature sensors, and gripper vision system error logs. The platform detects servo current drift patterns and joint temperature excursions 3–5 days before the predicted failure, enabling maintenance teams to schedule joint bearing replacement or gripper pad changes during off-peak hours. False positive rate was documented at 9% across the first 12 months of operation.
CIP system failures in beverage plants cause production delays averaging 3–4 hours while sanitation cycles are repeated or manual cleaning is performed. iFactory monitors CIP return flow rate, chemical dosing pump current, heat exchanger temperature differential, and tank level trends across each sanitation cycle. The platform detects pump cavitation onset — a precursor to complete pump failure — up to 10 days in advance. Heat exchanger fouling is flagged when temperature differential efficiency drops 12% below baseline. The Shift Logbook correlates CIP cycle data with QA lab results to validate cleaning effectiveness.
What iFactory Delivered Across 8 Beverage FMCG Facilities
45%
Reduction in unplanned downtime
From $33M annual loss to $18M — across all 8 facilities
$15M
Annual maintenance cost savings
Reduced reactive spend, emergency parts, and overtime
12pt
OEE improvement
68% to 80% — driven by availability, performance, quality
4.2x
Projected enterprise ROI
Full deployment across 8 facilities in 18 months
FAQ
iFactory is the AI software intelligence layer — not a sensor manufacturer or hardware vendor. The platform integrates with existing PLCs, SCADA systems, robotic servo drives, CIP control panels, ERP systems, and IoT sensor gateways already deployed across your beverage production facilities. Your plant selects the sensor and telemetry hardware; iFactory turns the data into predictive intelligence, maintenance alerts, and shift-ready work orders via the Shift Logbook and CMMS integration.
Initial deployment for a single facility with 30–50 production lines typically requires 8–12 weeks from project kickoff to live operation. The timeline includes machine connectivity setup (2–3 weeks), historical data ingestion and model training (3–4 weeks), dashboard configuration and user acceptance testing (2–3 weeks), and operator training with go-live support (1–2 weeks). For multi-site rollout, as demonstrated in this case study, all 8 facilities were deployed over 18 months using a phased approach — starting with the two highest-downtime sites, proving value, then expanding to the remaining six facilities. Standardised integration frameworks ensure that once connectivity is established for one filling line or robotic palletiser, replicating it across identical assets at other sites requires minimal additional engineering.
Yes. iFactory connects to SAP, Oracle, JDE, Microsoft Dynamics, and major CMMS platforms. The Shift Logbook captures operator defect reports, shift handover notes, and maintenance actions alongside sensor-generated predictions. Every prediction event, sensor reading, and maintenance action is recorded with full traceability for audit, compliance, and continuous model improvement — enabling your team to move from reactive beverage plant maintenance to data-driven reliability across the entire production network.
Model tuning typically requires 6–12 months of operation on a specific production network to eliminate false positives from variable production conditions — product changeovers, seasonal demand fluctuations, different packaging formats — tune threshold parameters for each asset class, and build maintenance team confidence. The platform's continuous learning loop improves prediction precision over time as more operating data and failure events accumulate across different beverage types, line configurations, and facility conditions. iFactory recommends starting with one asset class and one failure mode — such as filler valve seal prediction — proving value before expanding to the full production ecosystem.
Deploy iFactory for Your Beverage FMCG Production Network
AI-powered predictive analytics and robotic inspection platform connecting filling lines, robotic palletisers, CIP systems, and conveyor networks into one unified intelligence layer — with ML-based failure prediction, Shift Logbook integration, CMMS workflow automation, and plant-wide OEE analytics.