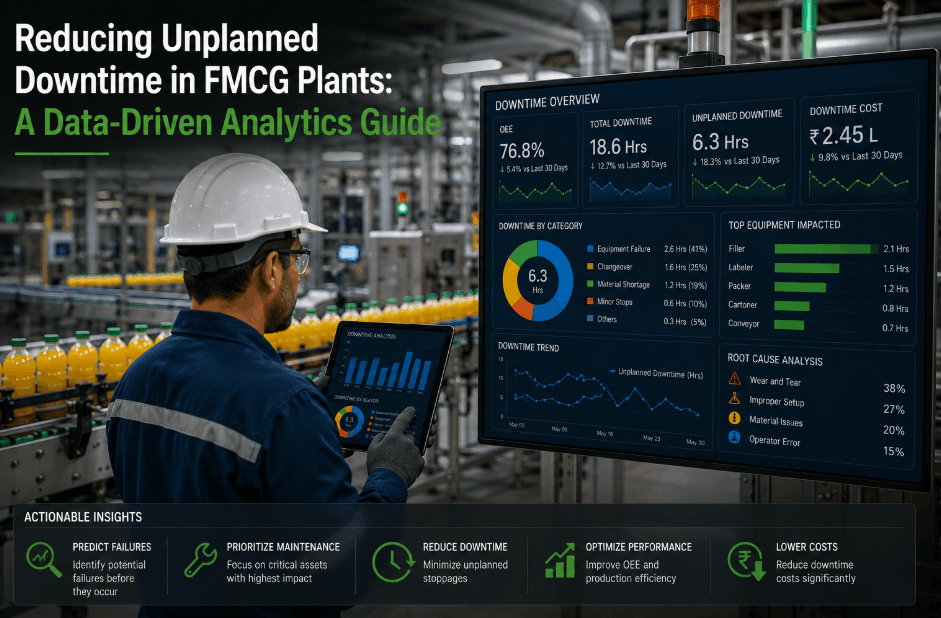
The average FMCG plant operates at just 60-65% OEE — meaning 35-40% of planned production capacity is being lost to downtime, speed losses, and quality defects every single day. In an industry where downtime costs 10-20% of goods sold, changeovers consume 20% of planned production time, and 42% of all downtime comes from equipment failures, those losses compound into millions. The gap between a 60% OEE plant and an 85% world-class operation represents a hidden factory of untapped capacity — no new equipment, no new lines, just smarter use of what you already have. This guide breaks down exactly where FMCG lines lose efficiency, and how IoT, predictive maintenance, and real-time analytics recover it. Book a free demo to see your hidden factory.
15-25% of capacity is recoverable with smart technology
The 6 Big Losses Killing Your FMCG Line Efficiency
Every OEE point lost traces back to one of these six categories. Smart technologies target each one differently:
Bearing failures, seal degradation, motor burnout, control faults. Each incident averages 4 hours. 42% of all downtime. Predictive maintenance eliminates 40-60% of these events.
Multi-SKU plants with 8-15 changeovers/day lose 20% of planned production time. SMED + AI scheduling reduces changeover time 30-50%.
Jams, misfeeds, sensor trips lasting under 2 minutes. Invisible in manual tracking. Real-time monitoring makes them visible and fixable.
Running below nameplate speed due to worn components, poor settings, or operator caution. IoT identifies when lines are underperforming vs. ideal rate.
2-5% of output lost to startup waste after every changeover. Standardized recipes + first-article inspection protocols reduce this dramatically.
Fill variations, seal failures, label misplacement, cosmetic defects. AI vision at line speed catches what human eyes miss — 99.5%+ accuracy.
63% of all FMCG losses come from availability issues — unplanned stops and changeovers. That's where predictive maintenance and smart scheduling deliver the biggest, fastest ROI. Book a demo to see how iFactory targets your top losses.
How Smart Technologies Fix Each Loss
IoT Condition Monitoring → Eliminates Unplanned Stops
Wireless sensors on motors, bearings, conveyors, pumps, and packaging equipment capture vibration, temperature, and acoustic signatures 24/7. ML algorithms detect degradation patterns 3-6 weeks before failure and auto-generate work orders. Typical result: 40-60% reduction in unplanned stops.
AI Scheduling & SMED → Faster Changeovers
AI optimizes production sequences to minimize changeover frequency. Automated parameter pre-sets eliminate manual trial-and-error setup. SMED methodology with digital work instructions standardizes every changeover. Result: 30-50% changeover time reduction, enabling smaller lot sizes and lower inventory.
Real-Time OEE Dashboards → Kills Hidden Speed Losses
Live monitoring of availability, performance, and quality across every line — with instant alerts when any metric drops. Micro-stops and slow cycles become visible for the first time. Pareto analysis auto-identifies the top 3-5 loss categories. Result: 10-15 point OEE improvement within 12-18 months.
AI Vision Inspection → Zero-Defect Quality
Computer vision systems inspect fill levels, label placement, seal integrity, and print quality at production speed — thousands of units per minute. Every inspection auto-logged for FSMA, HACCP, and ISO compliance. Equipment-to-quality correlation links defects to maintenance events. Result: 99.5%+ defect detection, 30-45% quality improvement.
Connected CMMS → Closes the Loop
A unified platform links sensor data, maintenance workflows, work orders, spare parts, OEE metrics, and quality records into one system. When a sensor detects degradation, CMMS auto-generates work orders, assigns technicians, orders parts, and schedules repair during planned downtime. No manual interpretation. No forgotten alerts.
See Your Hidden Factory — Book a 30-Minute Demo
Our FMCG specialists will show you real-time OEE dashboards, predictive maintenance alerts, and AI quality inspection running on your line profile.
The OEE Journey: What Good Looks Like
Starting Out
Significant unplanned downtime. No structured loss tracking. Reactive maintenance dominant. 15-25% recoverable capacity waiting.
Typical FMCG Plant
Some tracking in place. Hidden speed and quality losses. Real-time monitoring and predictive maintenance deployment begin here.
Above Average
Structured loss elimination active. Predictive maintenance deployed. AI-driven scheduling. Approaching world-class performance.
World-Class
Continuous improvement culture. AI-driven predictive operations. Top 5% of FMCG manufacturers. Self-optimizing production lines.
ROI Summary: What FMCG Plants Are Achieving
Getting Started: 3 Phases
Measure & Monitor
Weeks 1–8Deploy IoT sensors on highest-impact lines. Launch real-time OEE dashboards. Begin predictive maintenance on top-5 failure modes. Baseline your Six Big Losses. First measurable improvements in 90-120 days.
Optimize & Eliminate
Months 3–9Activate AI changeover scheduling. Deploy computer vision quality inspection. Expand sensor coverage to all critical assets. Connect OEE data to maintenance workflows. Target the next 5 loss categories via Pareto analysis.
Scale & Self-Optimize
Month 10+Roll out across all lines and sites. Deploy digital twins for process simulation. Target autonomous scheduling and self-optimizing production. Enterprise-level OEE benchmarking and continuous improvement.
Every OEE Point You Recover Is Pure Profit
See real-time OEE dashboards, predictive maintenance, AI quality inspection, and changeover optimization — all built for FMCG speed and compliance.