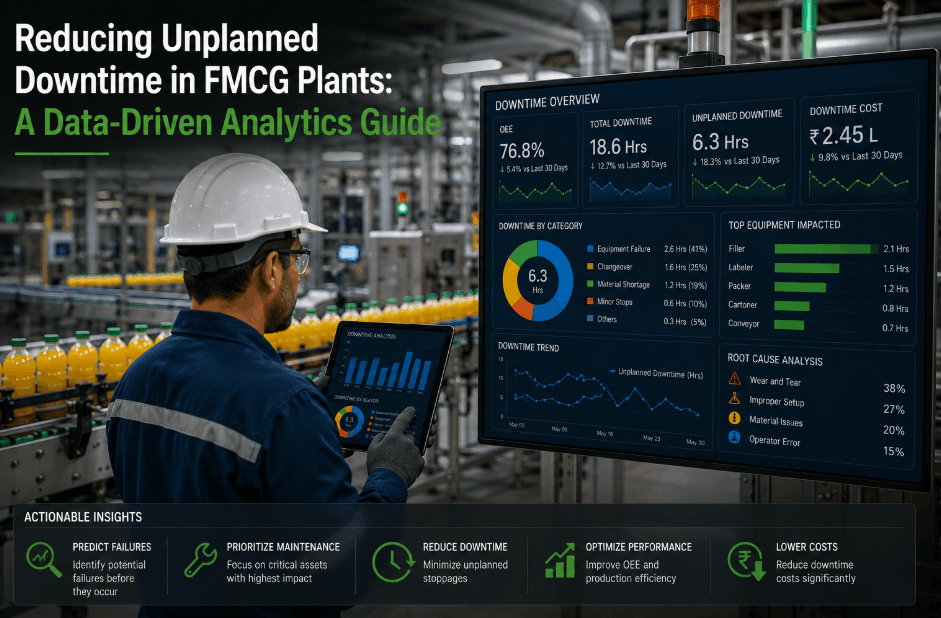
Reducing unplanned downtime in FMCG plants is now the single highest-leverage operational improvement available to consumer goods manufacturers. With unplanned downtime costing FMCG plants between $10,000 and $50,000 per hour — and the average mid-sized plant absorbing 80–150 hours of unplanned stoppage every year — a structured, data-driven downtime reduction program routinely returns multi-million dollar annual savings. Modern AI-driven analytics and predictive analytics platforms now cut unplanned downtime by 40–60% within the first 12 months, simply by replacing manual stoppage logs with continuous, automated capture and root cause classification. Plants that book a demo with iFactory consistently expose two to three major loss categories that were invisible to the existing downtime tracking process.
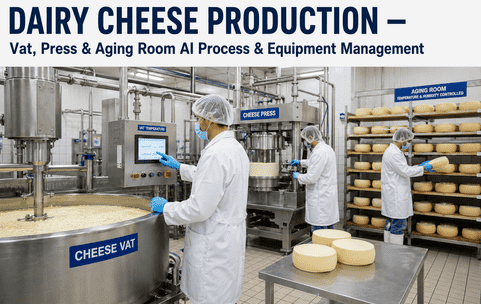
Cut FMCG Plant Unplanned Downtime by 40–60% With Data-Driven Analytics
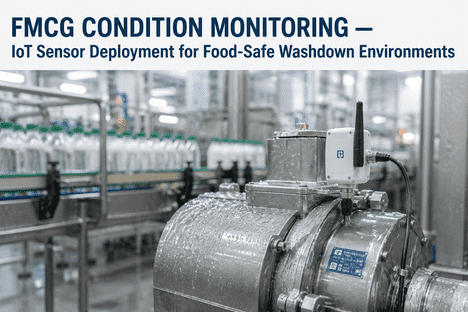
iFactory's downtime tracking platform captures every stoppage automatically — categorizing root causes and exposing the patterns that manual logs miss.
The Hidden Cost of Unplanned Downtime in FMCG Manufacturing
The direct hourly cost of unplanned downtime in an FMCG plant is the most visible — and the most underestimated — component of total downtime loss. Lost throughput is only the headline number; the full cost picture includes raw material giveaway during stoppage and restart, scrap from product trapped in the line, overtime labor for breakdown response, expedited freight on emergency spare parts, and the cascading impact on customer service levels when production windows are missed. Manufacturers that book a demo with iFactory typically discover their fully-loaded downtime cost is 2.5–3x what their finance teams have historically reported — because indirect costs were never being captured against the downtime event.
Lost Throughput
The direct production volume that fails to ship during the stoppage. On a high-speed FMCG line, this typically represents 50–65% of the total downtime cost.
Material Scrap
Product trapped in the line during stoppage — partially-processed material that cannot be recovered. Scrap loss is concentrated in thermal processing and filling operations.
Restart Yield Loss
Off-specification product produced during line stabilization after restart. Frequently larger than the initial scrap loss on long thermal or pressure-driven processes.
Breakdown Response Cost
Overtime, premium-freight spare parts, contractor call-out fees, and the cascade impact on planned maintenance schedules pushed aside to handle the unplanned event.
Why Manual Downtime Tracking Always Underestimates True Loss
Manual downtime tracking — operators writing stoppage causes on shift sheets or entering them into a SCADA terminal at end of shift — systematically underestimates total downtime by 30–50%. Three structural problems drive this gap: short stoppages under 5 minutes are almost never logged, root causes default to the easiest available category rather than the actual cause, and changeovers in progress at shift boundaries get split or omitted entirely. Automated downtime capture eliminates all three failure modes — and the truthful picture is invariably worse than the reported one. Teams that book a demo with iFactory often see their measured downtime rise by 30–50% in week one — not because performance got worse, but because the true picture is finally being captured.
Automated Capture
Every stoppage logged automatically from PLC signals — including the 60-second minor stops invisible to manual logging.
Cause Classification
AI-driven categorization assigns root cause from sensor patterns rather than operator selection — eliminating cause-of-convenience bias.
Pareto Analysis
Continuous Pareto ranking of downtime causes by frequency, duration, and total impact — surfacing the 20% of causes driving 80% of loss.
Targeted Action
Improvement teams focus on the highest-impact loss categories — converting analysis into measurable downtime recovery.
The Six Highest-Impact Downtime Reduction Strategies for FMCG Plants
A successful FMCG plant analytics program for downtime reduction concentrates on strategies that address the largest loss categories with the fastest payback. The six strategies below — used across world-class consumer goods manufacturers — consistently deliver 40–60% unplanned downtime reduction when implemented in sequence and supported by automated data capture.
Automate Downtime Capture First
Before targeting any specific loss, replace manual logs with sensor-derived stoppage capture. Without truthful data, every subsequent improvement initiative is targeting the wrong category. This single change typically uncovers 20–30 minutes per shift of previously invisible micro-stoppages.
Deploy Predictive Analytics on Critical Assets
Vibration, motor current, and thermal analytics on the 20% of rotating assets driving 80% of mechanical breakdowns. Predictive lead time of 7–14 days converts catastrophic unplanned events into scheduled interventions, eliminating the most expensive downtime category.
Apply SMED to Top Changeovers
Single-minute exchange of dies principles applied to the five longest changeovers on each line. Typical reduction of 30–50% in changeover time releases significant planned downtime back into production — often the largest availability gain in high-mix FMCG operations.
Eliminate Minor Stops Systematically
Minor stops under 5 minutes typically account for 15–25% of total downtime once captured accurately. Pattern analysis usually shows three to five root causes generating the majority of these stops — addressable through targeted engineering or operator training intervention.
Build Critical Spares Strategy from Failure Data
Most breakdown duration extends beyond mechanical repair time because parts aren't on-site. Automated downtime data exposes which assets generate emergency parts orders most frequently — driving rational, data-backed critical spares inventory decisions.
Embed Shift Huddle Reviews
Daily 10-minute shift handover huddles reviewing the top three downtime events from the previous shift. Maintains organizational focus, surfaces emerging issues quickly, and prevents the same root causes recurring across shifts.
Root Cause Analysis: From Stoppage Symptom to Permanent Fix
Recording downtime is necessary but not sufficient. Sustainable downtime reduction requires disciplined root cause analysis that traces each significant stoppage from immediate symptom back to the underlying systemic cause — and resolves it permanently rather than restoring the line. The four-stage framework below is used across leading FMCG plants and aligns with the structured problem-solving disciplines built into modern AI-driven analytics platforms. Engineers who book a demo with iFactory walk through live root cause workflows on the platform.
| Stage | Question Answered | Typical Tools Used | Output |
|---|---|---|---|
| Detection | What stopped, when, and for how long? | Automated stoppage capture, PLC event logs | Time-stamped downtime event record |
| Categorization | What type of stoppage was this? | AI cause classification, sensor pattern matching | Root cause category and affected asset |
| Investigation | Why did this happen, and why now? | 5 Whys analysis, fishbone diagrams, sensor history | Underlying systemic cause |
| Resolution | What permanent change prevents recurrence? | Engineering change, SOP update, predictive alerting | Closed-loop fix verified by downtime data |
Expose Every Stoppage. Eliminate Every Recurring Cause.
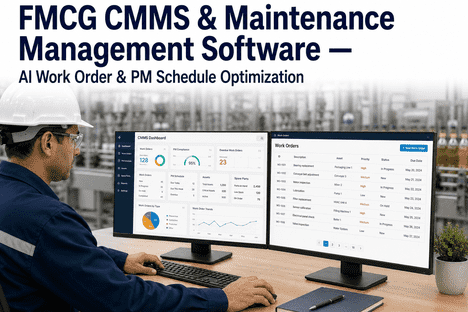
iFactory captures every downtime event automatically, classifies the root cause, and tracks recurrence — turning analytics into measurable downtime reduction.
Building an FMCG Downtime Reduction Roadmap: A 12-Month Framework
A credible FMCG downtime reduction program follows a 12-month roadmap that sequences capability building, data capture, and improvement execution in the right order. Plants that attempt advanced analytics before establishing reliable downtime data invariably stall; plants that build the data foundation first compound gains across every subsequent improvement initiative. Manufacturers that book a demo with iFactory receive a customized roadmap calibrated to their current downtime baseline and maintenance maturity level.
Truthful Baseline
Deploy automated downtime capture across primary lines. Establish true downtime baseline, top-10 cause Pareto, and shift-by-shift variance profile.
Top Cause Elimination
Focus root cause teams on the three largest loss categories per line. Typical 15–25% downtime reduction from this phase alone, without capital investment.
Predictive Layer
Deploy condition sensors and predictive models on critical rotating assets. Convert mechanical breakdowns from unplanned to scheduled interventions.
Sustainment & Scale
Embed daily huddles, monthly Pareto reviews, and quarterly maintenance strategy refreshes. Roll proven approaches to additional lines and sites.
Reducing Unplanned Downtime in FMCG: Frequently Asked Questions
What does unplanned downtime typically cost an FMCG plant?
Fully-loaded unplanned downtime costs FMCG plants between $10,000 and $50,000 per hour depending on line speed, product value, and direct labor exposure. The average mid-sized FMCG plant loses $3–8 million annually to unplanned downtime that structured analytics can substantially recover.
How much downtime reduction is realistic in the first year?
FMCG plants combining automated downtime capture with focused root cause action typically achieve 40–60% reduction in unplanned downtime within 12 months. Predictive analytics on critical assets adds further reduction in year two as more failure modes come under condition-based management.
Why does measured downtime rise when we deploy automated capture?
Manual logs systematically under-report downtime by 30–50% — short stops aren't logged, causes default to easy categories, and shift-boundary events get split. Automated capture exposes the true picture, which is invariably worse than reported and provides the honest baseline needed for real improvement.
Which loss categories should we target first for downtime reduction?
Always target the largest loss category exposed by accurate data capture. For most FMCG plants, this is either equipment breakdowns, changeover time, or minor stops — all three respond quickly to structured improvement programs without requiring major capital investment.
Do we need to replace our existing PLCs or SCADA to deploy downtime analytics?
No. iFactory's downtime analytics layer integrates with existing PLCs and SCADA through standard industrial protocols, extracting stoppage data and feeding it into automated cause classification without requiring controller replacement or major rewiring.
Ready to Cut Unplanned Downtime by 40–60% on Every FMCG Line?
iFactory's downtime tracking and root cause analysis platform turns every stoppage into structured intelligence — driving sustainable, measurable downtime reduction across FMCG operations.