Packaging line performance is the final — and most fragile — link in the FMCG production chain. Fillers, cappers, labelers, and cartoners operating at 400–1,200 units per minute accumulate mechanical wear at rates that fixed calendar-based maintenance schedules cannot track accurately. The result: unplanned stoppages, excessive changeover times, and OEE scores stuck below 75% despite significant capital investment in modern packaging equipment. Book a Demo to see how iFactory's Preventive Analytics Scheduling platform drives packaging line OEE above 90% with equipment-specific condition monitoring.
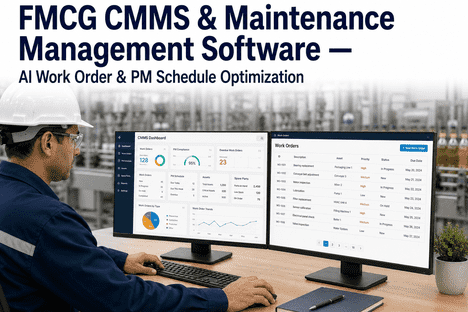
Transform Your Packaging Line OEE with AI-Driven Preventive Analytics
iFactory's equipment-specific PM scheduling reduces FMCG packaging line stoppages by up to 74% — delivering measurable OEE improvement within the first 90 days.
Why FMCG Packaging Lines Chronically Underperform OEE Targets
World-class FMCG packaging operations target an Overall Equipment Effectiveness score of 85% or higher. The reality for most plants is significantly lower — industry surveys consistently show average packaging line OEE between 55% and 72%, with the gap driven almost entirely by unplanned downtime and speed losses that are preventable with condition-based maintenance. The root cause is structural: fillers, cappers, labelers, and cartoners each have distinct mechanical failure modes, but most FMCG plants apply a single uniform maintenance schedule across all equipment types.
A rotary filler degrades through valve seat wear and piston seal fatigue — failure modes that manifest as fill volume drift weeks before catastrophic failure. A high-speed labeler fails through label web tension drift and applicator pad wear — detectable as early as 10–14 days before adhesion failures create label rejects. These are fundamentally different degradation pathways requiring equipment-specific analytics strategies, not generic monthly PM rounds. iFactory's packaging line analytics platform delivers exactly this granularity — monitoring each machine type with the specific sensor suite and AI models its failure profile demands.
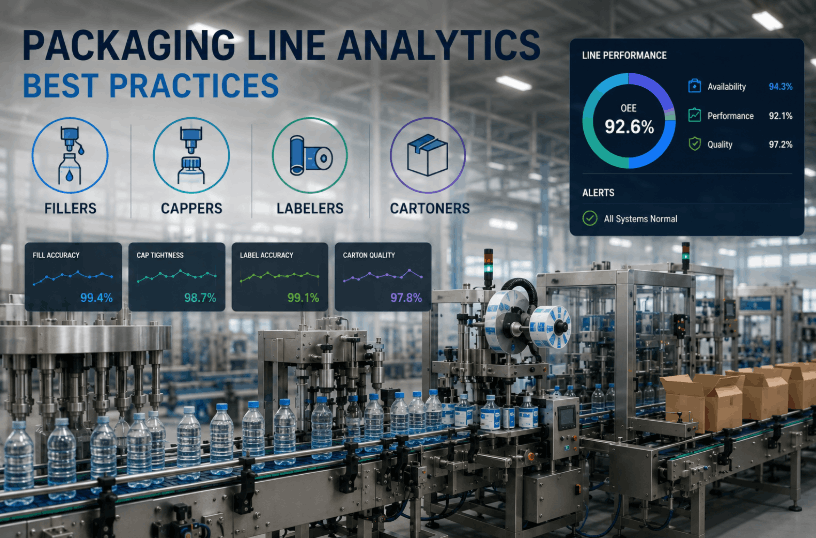
Packaging Equipment PM Best Practices: Filler, Capper, Labeler & Cartoner Analytics
Effective packaging line analytics requires understanding the unique mechanical degradation profile of each equipment type. The following equipment-specific frameworks represent current best practice for condition-based maintenance scheduling in high-speed FMCG packaging environments.
Filling Machine Analytics: Monitoring Valve, Piston & Flow Consistency
Filling machines — whether volumetric piston fillers, gravity fillers, or flow-meter-based systems — fail through a predictable sequence of mechanical degradation events. Piston seal wear causes progressive fill volume drift, initially detectable only through statistical process control monitoring of net weight data. Valve seat erosion creates inconsistent valve closure times, measurable as micro-variations in fill cycle duration. Product contact surface fouling in viscous product fillers alters flow resistance, visible as drive motor torque drift across production runs.
iFactory's filler analytics module monitors fill weight standard deviation in real time, triggering alerts when sigma values breach product-specific control limits — providing 2–3 week advance warning of valve or piston degradation before net content compliance violations occur. Book a Demo to see fill weight SPC monitoring in action.
Capping Machine Analytics: Torque Consistency, Spindle Wear & Closure Integrity
Capping equipment is one of the highest-frequency failure sources on FMCG packaging lines, generating consumer complaints through under-torqued closures, cross-threaded caps, and seal liner damage. The primary mechanical failure mode is spindle clutch wear — causing applied torque to drift below specification over thousands of capping cycles, producing closures that fail tamper-evidence tests or allow product spoilage through insufficient hermetic sealing.
iFactory monitors capper spindle torque signatures on every closure cycle, building a statistical baseline for each spindle head and alerting maintenance when torque delivery degrades beyond ±5% of specification. Rotary chuck wear — identified through abnormal vibration signatures during cap pickup — is flagged independently, allowing targeted component replacement rather than full spindle assembly changeovers.
Labeling Machine Analytics: Web Tension, Applicator Wear & Registration Accuracy
High-speed pressure-sensitive labelers operating at 400+ labels per minute accumulate wear through label web tension drift, applicator pad degradation, and drive roller slip. These failure modes manifest as gradual label placement registration errors — initially within tolerance, but trending toward label skew, label bridging, and adhesion failures that require line stoppages for re-labeling of finished product. For FMCG products with mandatory label information requirements (nutrition facts, allergen declarations, barcodes), label placement failures also create regulatory non-compliance exposure.
iFactory's labeler analytics module tracks web tension sensor data and drive motor speed differentials in real time, detecting the earliest signs of tension drift before registration errors become visible. Applicator pad wear is monitored through pressure sensor data, with automatic work order generation when pad pressure delivery falls below product-specific application thresholds. Book a Demo to explore labeler condition monitoring.
Cartoner Analytics: Carton Feed, Glue System & Folding Mechanism Monitoring
Cartoning machines represent one of the most mechanically complex assets on the FMCG packaging line — combining carton blank feeding, product loading, hot melt glue application, and folding mechanism synchronization into a high-speed continuous process. The most common failure modes are hot melt glue nozzle clogging (causing open-flap cartons that fail retailer inspection), vacuum cup wear on carton blank feeders (causing feed jams at high speeds), and folding cam profile wear (producing cartons with inconsistent fold geometry).
iFactory monitors cartoner glue system temperature and pressure in real time, flagging nozzle blockage events before they generate line rejects. Vacuum cup performance is tracked through cycle-level pickup success rate data, with replacement alerts generated based on cumulative cycle count and performance trend analysis rather than fixed calendar intervals.
Moving Beyond Calendar PM: Condition-Triggered Packaging Maintenance Scheduling
The fundamental limitation of calendar-based packaging equipment PM is that it treats all production conditions as identical — scheduling maintenance at fixed intervals regardless of whether the line has run three SKUs at 60% speed or one SKU at 100% speed for the entire maintenance window. A filler running high-viscosity sauces accumulates valve and seal wear at a rate 3–4x faster than one running water-based beverages. Fixed monthly PM schedules create exactly two failure modes: over-maintenance (replacing perfectly functional parts) and under-maintenance (failure occurring between service intervals during peak demand).
iFactory's Preventive Analytics Scheduling module replaces fixed PM intervals with dynamic, condition-triggered work orders generated by the AI platform when equipment health scores breach pre-defined thresholds. This approach reduces unnecessary PM labor by 35–45% while simultaneously eliminating the under-maintenance failure events that drive unplanned packaging line downtime.
| PM Dimension | Calendar-Based Approach | iFactory Condition-Based |
|---|---|---|
| Filler Valve Replacement | Every 90 days (fixed) | When fill sigma drift detected |
| Capper Spindle Inspection | Monthly manual torque check | Real-time torque signature monitoring |
| Labeler Web Tension | Weekly tension gauge check | Continuous 24/7 sensor tracking |
| Cartoner Glue System | Operator visual check each shift | Automated temperature & pressure monitoring |
| Failure Prediction Window | No prediction (reactive) | 3–4 weeks advance warning |
| Unnecessary PM Labor | 35–45% wasted on healthy assets | Only condition-confirmed tasks executed |
| Changeover Optimization | Static changeover schedules | AI-optimized changeover sequencing |
Packaging Line Changeover Optimization: Reducing Format Change Downtime with Analytics
Packaging changeover is one of the most significant — and most underestimated — sources of OEE loss in FMCG operations. A multi-SKU packaging line executing 8–12 format changes per week can lose 15–20% of available production hours to changeover activities that should take 35 minutes but routinely extend to 70+ minutes due to component pre-wear, mis-adjusted tooling, and undetected equipment drift accumulated during the previous production run.
iFactory's packaging analytics platform tracks equipment condition continuously across production runs, identifying components that are approaching wear thresholds likely to extend changeover times. Before the changeover window begins, the platform provides maintenance teams with a targeted component status report — identifying the specific items (worn guide rails, drift in capper spindle torque, label web tension offset) that will extend changeover time if not addressed proactively. Book a Demo to explore changeover optimization analytics.
Pre-Changeover Equipment Assessment
iFactory generates an automatic pre-changeover equipment health report 2 hours before each scheduled format change — identifying components with degraded condition scores that will extend setup time if not addressed during the changeover window itself.
Targeted Component Staging
Based on AI health scores, the platform automatically generates parts staging requests for any components flagged for replacement during the changeover — ensuring spare parts are on the line before the changeover begins, eliminating parts-hunting delays.
Post-Changeover Baseline Validation
After changeover completion, iFactory validates that all monitored parameters — fill weight sigma, torque delivery, web tension, glue temperature — have returned to the new SKU's established baseline before production restart approval is granted.
Changeover Time Analytics & Continuous Improvement
Every changeover event is recorded with detailed time-stamped activity logs, enabling root cause analysis of extended changeovers and continuous reduction of average changeover time through equipment condition trend management.
The Financial Impact of Packaging Line Analytics: OEE, Waste, and Line Efficiency ROI
For FMCG manufacturers operating in competitive retail environments with tight margin structures, packaging line OEE directly determines profitability. A 10-percentage-point improvement in OEE on a line running at $8,000 per hour throughput value represents $800 per hour of recovered productive capacity — or approximately $4.5 million annually on a 2-shift, 260-day operation. The business case for packaging line analytics is not marginal; it is transformational.
| Cost / Value Category | Without Analytics | With iFactory | Annual Impact |
|---|---|---|---|
| Unplanned Packaging Stoppages | 18–22% OEE loss | Under 5% with condition PM | $1.2M+ recovered throughput |
| Packaging Reject Rate (Label/Closure) | 1.8–3.2% reject rate | Under 0.4% reject rate | $145,000/yr per line |
| Emergency Maintenance Labor | $58,000/yr per line | $11,000/yr per line | $47,000/line |
| Changeover Time Loss | 70+ min avg changeover | 38 min avg changeover | $280,000/yr (8 changes/wk) |
| Packaging Asset Lifespan | 10–12 year average | 16+ year lifespan | $120,000 CapEx deferral |
For a mid-size FMCG operation with 3 packaging lines, iFactory customers consistently report total annual value realization exceeding $1.8 million, with full ROI achieved within 7–9 months of deployment.
Deploying Packaging Line Analytics Without Disrupting Production: The 90-Day Roadmap
FMCG packaging lines operate in continuous production environments where sensor installation downtime must be minimized. iFactory's deployment methodology is engineered around this constraint — with sensor installation executed during scheduled format changes and planned sanitation windows, requiring no dedicated installation downtime in most packaging configurations.
Sensor Deployment & Equipment Mapping
IoT sensors installed on all packaging equipment during scheduled changeover and sanitation windows. Each filler, capper, labeler, and cartoner mapped to its specific analytics module. PLC and SCADA integration completed for existing process data feeds.
Equipment Baseline & AI Model Training
Machine learning models learn normal operating signatures for each equipment type across all running SKUs. Fill weight baselines, torque profiles, web tension norms, and glue system setpoints established per product format.
Predictive Alerts & Condition-Triggered PM
First condition-triggered work orders generated. Maintenance teams transition from calendar rounds to AI-directed interventions. Typically 3–6 developing equipment issues identified and resolved before generating line stoppages.
Full OEE Integration & Reporting
Packaging line OEE dashboards activated. Changeover optimization analytics live. KPI reporting automated to plant management. Compliance documentation aligned with SQF/BRC equipment maintenance requirements.
Frequently Asked Questions: Packaging Line Analytics for FMCG
Can iFactory monitor older packaging equipment without native digital outputs?
Yes. iFactory's universal IoT bridge provides non-invasive vibration, temperature, and current monitoring for legacy packaging equipment with no digital communication ports. The platform converts analog machine behavior into digital health scores without requiring OEM modifications to the equipment.
How does the AI handle different packaging formats and SKU changeovers?
iFactory's AI models are format-aware. The platform stores separate baseline health profiles for each SKU and packaging format, automatically switching the active comparison model when a changeover is initiated. This prevents false alerts caused by the legitimate differences in equipment operating parameters between, for example, a 250ml bottle run and a 1L carton run.
What packaging line OEE improvement should we realistically expect?
iFactory customers running packaging lines with a starting OEE of 62–72% consistently achieve 82–90% OEE within the first 6 months of deployment. The primary improvement driver is elimination of unplanned stoppages, which typically account for 12–18 percentage points of OEE loss on FMCG packaging lines.
Can the platform generate PM compliance records for SQF or BRC audits?
Absolutely. iFactory auto-generates audit-ready equipment maintenance records for every condition-triggered PM event, including sensor trend data, work order history, and post-maintenance validation readings. These records are timestamped and stored in a searchable format aligned with GFSI documentation requirements.
How does iFactory handle filler analytics for different product viscosities?
The filler analytics AI models are viscosity-aware. Separate torque, pressure, and flow baselines are maintained for each product recipe, ensuring that the normal increased motor load seen when running a high-viscosity sauce does not trigger false-positive alerts designed for a low-viscosity beverage application.
Stop Letting Preventable Stoppages Limit Your Packaging Output
iFactory's Preventive Analytics Scheduling platform is already protecting FMCG packaging operations at leading brands and co-manufacturers. See a live walkthrough of the packaging analytics dashboard — no obligation.