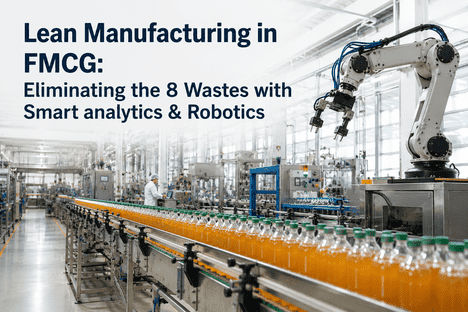
FMCG manufacturers operate in a paradox: margins measured in basis points demand relentless cost discipline, yet the production environment high-speed lines, frequent SKU changeovers, aging equipment running alongside new assets, and raw material variability generates waste across every lean category simultaneously. The 8 wastes of lean manufacturing Defects, Overproduction, Waiting, Non-utilised Talent, Transportation, Inventory, Motion, and Excess Processing are not theoretical categories on an FMCG plant manager's whiteboard. They are measurable cost lines in the P&L, each consuming margin that the commercial team cannot recover through pricing. Smart analytics and robotics have transformed waste elimination from a manual Kaizen event activity where waste is identified during a week-long workshop, eliminated on one line, and returns on the adjacent line within a month into a continuous, automated detection-and-correction loop that runs across every production line, every shift, without requiring plant manager attention for every waste event. The 2025-2026 benchmark data shows that FMCG facilities deploying integrated analytics and robotics platforms achieve 40-55% faster waste reduction than facilities relying on manual lean methods alone, with waste elimination sustained at 90%+ after 12 months compared to the 50-60% sustainment rate typical of manual Kaizen initiatives. This guide provides FMCG plant managers with a structured framework for identifying, measuring, and eliminating each of the 8 wastes through smart analytics and robotics with specific detection methods, elimination strategies, and the technology architecture that makes continuous waste elimination possible without continuous human intervention.
The 8 Wastes in FMCG Manufacturing: How Analytics and Robotics Detect and Eliminate Each One
Each of the 8 lean wastes manifests differently in FMCG production, and each requires a specific combination of analytics detection and robotic correction to eliminate sustainably. The traditional approach — training operators to spot waste, conducting Kaizen events to remove it, and relying on standard work audits to prevent recurrence — creates improvement cycles measured in months. Analytics and robotics compress this cycle to minutes by detecting the waste signature in real-time data and either alerting the plant manager for intervention or triggering an automated correction through a robotic process control loop. The following framework maps each waste category to its FMCG-specific manifestation, the analytics detection method, the robotic elimination strategy, and the iFactory platform capability that enables both.
The Analytics Infrastructure for Continuous Waste Detection
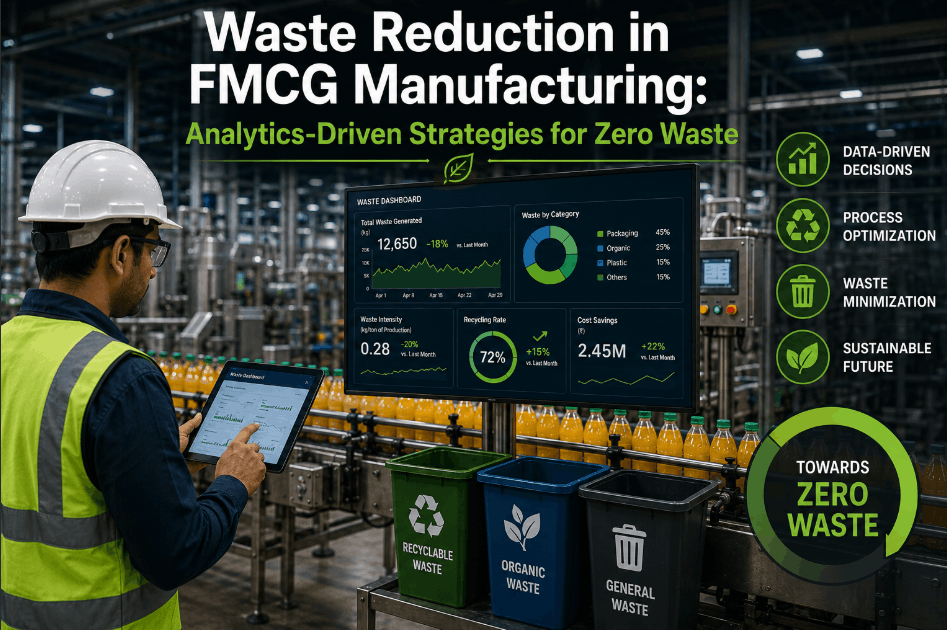
Detecting all 8 waste categories simultaneously across every production line requires an analytics infrastructure that ingests data from multiple sources — machine sensors, PLC historians, vision inspection systems, checkweighers, MES production records, CMMS maintenance logs, WMS inventory movements, and operator time tracking — and correlates them against the waste signature for each category. The iFactory waste detection analytics platform is purpose-built for this multi-source correlation, processing over 200,000 data points per production line per shift and identifying waste events within the same shift they occur — not in the weekly or monthly waste report that arrives too late for corrective action. The platform tracks waste events by category, production line, SKU, shift, and operator team, building a waste Pareto that enables the plant manager to focus elimination resources on the waste categories and locations delivering the highest cost impact. The waste dashboard shows the current waste rate for each category across every line — the plant equivalent of a financial dashboard showing margin consumption by waste category in real time. Talk to an expert about configuring waste detection for your FMCG production lines and SKU portfolio.
Robotic Elimination Loops: How Closed-Loop Control Systems Sustains Waste Reduction Without Human Intervention
The limitation of analytics-only waste detection is that it identifies waste but relies on human action to eliminate it — and human-dependent waste elimination degrades over time as shift rotations, personnel changes, and production pressure erode adherence to the elimination protocol. Robotics closes this gap by linking waste detection directly to automated correction. When the analytics platform detects a defect waste signature — a filling weight drift trend, a seal temperature deviation, a label placement shift — the robotic control loop automatically adjusts the process parameter back to the target range without requiring an operator or maintenance technician to intervene. The detection-to-correction cycle compresses from hours (detect in analytics, alert operator, operator investigates, operator adjusts, verify adjustment) to seconds (detect in analytics, trigger robotic adjustment, verify correction, log event). The same closed-loop principle applies across multiple waste categories: overproduction is prevented by robotic line stop at planned batch quantity; waiting is reduced by predictive analytics that triggers robotic changeover preparation; motion waste is eliminated by robotic material presentation systems. The plant manager's role shifts from detecting and eliminating waste manually to configuring the detection thresholds and correction rules that the automated system executes continuously. Talk to an expert about configuring robotic waste elimination loops for your highest-waste production lines and SKU categories.
We ran Kaizen events twice a year on every packaging line. Every event identified the same waste categories — overfill on liquid fills, waiting time during changeovers, and operator motion to retrieve packaging materials. Every event implemented countermeasures. Every event delivered improvement for about 4 to 6 weeks before the waste gradually returned. The root cause was not the Kaizen method — it was the absence of continuous detection. Waste that you cannot see returning will return. We deployed the iFactory waste detection platform with robotic fill weight control and automated material presentation on our two highest-volume beverage lines. The waste detection system identified overfill events within 30 seconds and the robotic control loop corrected the fill nozzle within 2 seconds. The waiting time during changeovers dropped 45% because the predictive analytics told us exactly when to stage materials. The operators who had spent 30% of their shift walking to retrieve materials now spend that time on line optimisation. Our annual waste cost dropped from $3.1M to $1.2M in 14 months. The Kaizen events now focus on process innovation, not waste re-discovery.
The Waste Elimination Dashboard: What the Plant Manager Sees in Real Time
The plant manager's waste elimination dashboard is organised around a single question: which waste category on which production line is consuming the most margin right now, and what is the automated system doing about it? The dashboard displays current waste cost per production line — calculated from the measured waste quantity multiplied by the unit margin for the SKU being produced — ranked from highest to lowest waste cost. Each waste category shows the current detection status (normal, trending, alert, correction active), the automated elimination action in progress, and the waste cost avoided year-to-date by the elimination loop. The plant manager can drill into any waste category on any line to see the trend chart — waste rate before and after the automated elimination loop was activated — and the sustainment confirmation showing that the waste has not returned at a rate above the target threshold. The dashboard also tracks the waste elimination pipeline: waste categories detected in the last 7 days, elimination loops in development, and elimination loops pending validation. This provides a complete visual management system for the plant's waste elimination programme — with every element measured, tracked, and sustained by the analytics and robotics platform rather than by manual audit. Talk to an expert about configuring the waste elimination dashboard for your FMCG facility.
- Waste identified during quarterly Kaizen events — 4-6 weeks between waste event and detection
- Elimination dependent on manual standard work adherence — sustaining waste reduction for 50-60% of initiatives beyond 12 months
- Waste cost calculated from annual P&L review — no real-time waste cost visibility
- Operator time consumed by data logging and waste monitoring — 30-40% of shift on non-value-adding activity
- Waste Pareto updated annually — same waste categories recurring year after year
- Waste detected within the shift it occurs — continuous analytics scanning across all 8 waste categories
- Elimination sustained at 90%+ by automated detection loops and robotic correction — waste recurrence triggers automated intervention within seconds
- Waste cost displayed in real time by category, line, and SKU — margin impact tracked by the minute
- Operator time recovered for process improvement — analytics and robotics handle data collection, inspection, and correction
- Waste Pareto updated live — new waste categories surfaced before they become significant cost lines
Conclusion: Waste Elimination in FMCG Manufacturing Is No Longer a Manual Activity It Is an Automated Capability That Runs Every Shift, Every Line, Every Minute
The 8 wastes of lean manufacturing are the most reliable margin leakage indicator in FMCG production — and they have historically been the most difficult to eliminate permanently because manual detection methods cannot sustain the vigilance required to prevent waste recurrence across every line, every shift, and every SKU changeover. Smart analytics and robotics change this paradigm fundamentally by shifting waste elimination from a periodic human activity — the Kaizen event, the waste walk, the standard work audit — to a continuous automated capability that operates across the entire production footprint without requiring plant manager or operator attention for every waste event.
The evidence from FMCG manufacturing in 2025-2026 is clear: facilities deploying integrated analytics and robotics platforms for waste elimination achieve 40-55% faster waste reduction than facilities relying on manual lean methods, sustain 90%+ of waste elimination after 12 months compared to 50-60% for manual initiatives, and eliminate an average of $2.3M in annual waste cost per plant. The plant manager's role transforms from waste detective and elimination project manager to waste elimination system designer — configuring the detection thresholds, elimination rules, and robotic control loops that the platform executes continuously.
iFactory AI's lean analytics and robotics platform is built specifically for FMCG plant managers who need to eliminate the 8 wastes permanently — not through periodic events that require constant re-engagement, but through automated detection and robotic elimination loops that sustain waste reduction every shift, every line, every minute. Book a Demo to see the waste elimination platform configured for your production lines and waste profile — or talk to an expert about a free waste detection and elimination assessment for your FMCG facility.