Waste reduction in FMCG manufacturing has transitioned from a sustainability "nice-to-have" to a core operational necessity. With the FMCG sector responsible for nearly 40% of global plastic waste and significant percentages of organic material loss, the financial pressure to optimize material yield is at an all-time high. Traditional waste management relies on retroactive scrap weighing and manual logs, which fail to identify the precise moment—and the precise machine—where material loss occurs. In 2026, industry leaders are deploying analytics-driven "Zero Waste" strategies that utilize robotic precision and real-time production data to eliminate defects at the source. Facilities that book a demo with iFactory are discovering that over 15% of their hidden waste is generated during unmonitored changeovers and minor equipment micro-stops, all of which can be eliminated through predictive analytics.
Turn Production Waste into Profit with AI-Driven Tracking
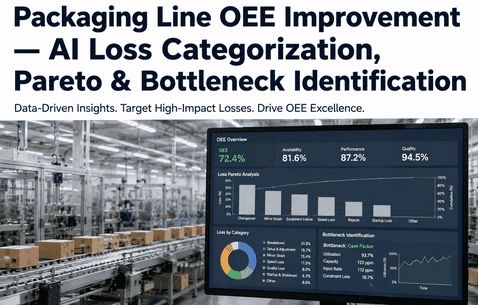
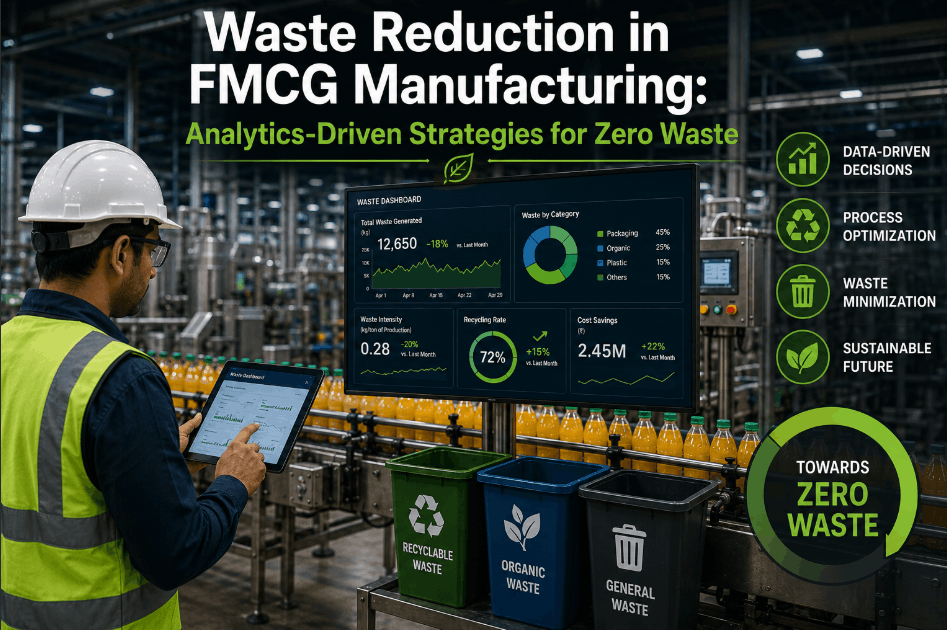
iFactory’s waste analytics platform identifies material leakage points in real-time, reducing packaging defects by 65% and ingredient overfills by 40%. Achieve your Zero Waste targets with data, not guesswork.
The 6 Failure Patterns of FMCG Material Management
Most FMCG plants operate with a "hidden factory"—a parallel production stream that produces scrap, overfills, and wasted energy. Identifying these patterns requires moving beyond simple mass-balance equations and into real-time sensor integration. iFactory’s analytics engine identifies the following six patterns that collectively erode up to 12% of total manufacturing margins. Facilities that book a demo receive a facility-wide material loss heat map during the initial integration phase.
Precision Overfill (Giveaway) Waste
Minor overfills of liquid or dry ingredients might seem negligible per unit, but across millions of units, they represent tons of lost product. iFactory correlates filler valve timing with weight check data to eliminate "product giveaway" while maintaining legal fill requirements.
Packaging Defect & Seal Failures
Misaligned labels, crushed cartons, and faulty heat seals account for the majority of plastic and cardboard waste. Robotic vision systems integrated with iFactory identify seal integrity issues in real-time, stopping the line before a batch of thousands is ruined.
Changeover and Start-Up Losses
The transition between product variants is the highest-risk period for waste. Inadequate machine calibration during start-ups leads to "stabilization scrap." iFactory optimizes changeover parameters to reach steady-state production 30% faster, saving material and time.
Ingredient Spoilage & Perishability
Inadequate temperature tracking in raw material silos or slow inventory turnover leads to organic waste. Predictive shelf-life modeling within our platform alerts production planners to prioritize older batches, reducing raw material spoilage by over 25%.
Water Intensive Washdown Waste
Cleaning and sanitation are critical but often use 3x the necessary water and chemicals. iFactory tracks flow rates and turbidity during CIP (Clean-in-Place) cycles to optimize water usage, reducing effluent discharge and lowering environmental compliance costs.
Energy Leakage in Idle States
Conveyors, HVAC, and compressors running during non-productive micro-stops contribute to "energy waste." Our analytics correlate machine state with power draw, automatically identifying opportunities to de-energize systems when they aren't adding value.
7 Stages to Analytics-Driven Zero Waste in FMCG
Transitioning to a circular economy model requires more than just recycling bins; it requires a complete digital overhaul of how material flows are monitored and controlled. iFactory’s 7-stage roadmap provides the framework for turning raw data into a zero-waste reality. Facilities that implement this roadmap see an average material yield increase of 4.2% within the first 12 months. Book a Demo to see our waste mitigation workflow.
Material Flow & Loss Mapping
Conduct a granular audit of every material entry and exit point. We deploy IoT sensors at scrap chutes, filler bowls, and packaging discharge points to create a "digital twin" of your material flow, identifying the 20% of sources responsible for 80% of waste.
Inline Robotic Vision Integration
Deploy high-speed robotic vision at critical packaging and assembly nodes. iFactory’s AI models analyze 100% of production—not just periodic samples—to detect label skew, seal failures, and cap misalignments before product leaves the machine.
Real-time Mass Balance Analytics
Implement continuous mass-balance tracking that compares raw material input with finished good output. Any discrepancy creates an immediate "Yield Deviation Alert," allowing supervisors to intervene in minutes rather than discovering losses during end-of-shift reconciliations.
Changeover Stabilization Optimization
Digitalize changeover procedures with real-time feedback. iFactory guides technicians through machine adjustments using historical "Best Run" data, ensuring the first unit off the line after a changeover is a saleable unit, eliminating stabilization scrap.
Closed-Loop Water & Chemical Recovery
Monitor effluent quality in real-time to identify opportunities for water reuse in non-contact applications. iFactory optimizes biocide and chemical dosing to reduce chemical waste and ensure discharge compliance without over-treatment.
Energy-to-Waste Correlation Modeling
Correlate energy consumption with production scrap. iFactory identifies equipment that consumes excessive energy when operating inefficiently, allowing for predictive maintenance that addresses both material waste and energy over-consumption.
Zero-Waste Compliance Reporting
Generate automated ESG and sustainability reports. Our platform provides the verified data trail required for "Zero Waste to Landfill" certifications, reducing audit preparation from weeks to a single click. Demonstrate your circular economy progress to stakeholders with absolute data confidence.
Quantifying the Impact of Analytics-Driven Waste Reduction
Waste reduction isn't just about the environment; it’s about the bottom line. By tracking material yield and energy efficiency in real-time, FMCG manufacturers can unlock significant hidden value. iFactory’s dashboards provide the granular data needed to turn sustainability from a cost center into a profit driver. Book a Demo to see your plant's sustainability ROI.
Waste Management Evolution: Manual Tracking vs. iFactory Analytics
The shift from manual scrap logs to real-time waste intelligence changes the fundamental economics of FMCG production. Manual tracking is slow, inaccurate, and reactive; iFactory's digital infrastructure is fast, precise, and proactive.
| Waste Category | Traditional Manual Approach | iFactory Analytics-Driven Approach | Waste Reduction Impact |
|---|---|---|---|
| Packaging Scrap | Weekly scrap bin weighing | Robotic vision identifying every defect | Scrap reduction –65% |
| Ingredient Overfills | Periodic manual weight checks | Dynamic filler valve calibration | Giveaway waste –40% |
| Changeover Loss | Operator "best guess" setup | Digitalized "Best Run" parameter locking | Start-up scrap –72% |
| Water Consumption | Fixed CIP cleaning cycles | Turbidity-driven cycle optimization | Water waste –30% |
| ESG Reporting | Manual spreadsheet reconstruction | Real-time verified compliance dashboard | Audit prep –90% |
High-Impact Waste Nodes in Modern FMCG Facilities
Not all waste is equal. High-speed automation nodes generate waste at such high velocities that even minor deviations can lead to tons of scrap in a single shift. iFactory prioritizes monitoring at these critical nodes to ensure maximum material protection.
Eliminating Ingredient Giveaway
High-speed fillers are the largest source of "hidden waste." iFactory monitors each filler head's performance, identifying precision drift before it exceeds tolerance, ensuring every milligram of product reaches the customer.
Zero-Defect Packaging Precision
Packaging is where the most visible waste occurs. Our robotic vision systems monitor seal integrity and label alignment at 600+ units per minute, ensuring no substandard packaging reaches the warehouse.
Optimizing Resource Consumption
Utilities are the largest sources of water and energy waste. iFactory’s closed-loop analytics ensure cleaning cycles use exactly the required resources, preventing over-cleaning and unnecessary material discharge.
Zero-Waste Performance & Circular Economy KPIs
Our benchmarking data reflects the performance gains achieved by 50+ FMCG facilities after 12 months of iFactory implementation. These progress bars demonstrate the power of moving from reactive waste management to proactive, data-validated optimization.
Waste Reduction in FMCG Manufacturing — FAQs
What is the largest source of material waste in FMCG?
While packaging scrap is most visible, "Giveaway Waste" (ingredient overfills) is often the largest financial loss. High-speed fillers can lose tons of product annually due to minor calibration drift. iFactory eliminates this by correlating filler performance with check-weigher data in real-time.
How does AI-driven vision reduce plastic waste?
Standard inspections catch 1 defect every 1,000 units. Robotic vision monitors 100% of production. By identifying a seal failure the moment it starts, iFactory can stop the line or eject the single defective unit, preventing entire pallets of product from being scrapped due to contamination risk.
Is real-time mass balance tracking necessary for Zero Waste certification?
While not always strictly required, it is the only way to prove material integrity to auditors. Real-time mass balance provides the verified data trail that proves no material is entering unmonitored waste streams, making Zero Waste to Landfill certification much simpler to achieve and maintain.
Can waste analytics integrate with existing ERP systems?
Yes. iFactory syncs waste data directly with your ERP (SAP, Oracle, etc.) to ensure that inventory levels and cost-of-goods-sold (COGS) are accurate. This integration ensures that the financial team has a clear view of how waste reduction is impacting the bottom line.
How long does it take to see ROI on waste tracking?
Most FMCG facilities achieve a positive ROI within 4-7 months. By identifying a single major overfill issue or reducing start-up scrap by 50%, the platform often pays for its annual subscription cost in the first quarter of deployment. The long-term value comes from sustained yield increases and audit readiness.
How do you track "Energy Waste" in a manufacturing context?
We correlate energy consumption with machine states (Running, Idle, Faulted, Changeover). iFactory identifies "Vampire Loads"—systems that pull significant power when they should be in low-energy or off states—allowing you to automate power-downs and reduce your carbon footprint.
Eliminate Hidden Production Waste and Accelerate Your Zero-Waste Journey
iFactory's AI-driven waste tracking platform delivers the real-time intelligence needed to stop material losses, reduce packaging scrap, and optimize resource efficiency. Don't let your profit end up in the scrap bin—deploy predictive waste analytics today.