FMCG manufacturers operate in a high-volume, low-margin environment where raw material volatility, energy inflation, labor shortages, and increasing compliance overhead have compressed operating margins to 5–12% for most product categories. A 25% reduction in operational cost achieved through analytics-driven decision-making, robotic process optimization, and intelligent maintenance scheduling translates directly to margin expansion that most FMCG companies cannot achieve through revenue growth alone. This article presents 10 proven strategies that collectively deliver that 25% cost reduction target, grounded in data from iFactory AI deployments across snack food, beverage, packaged goods, and personal care facilities operating 50+ production lines. Each strategy is mapped to the iFactory platform capability that enables it, with documented savings ranges from live deployments. Book a Demo to receive a facility-specific cost reduction analysis based on your current OEE, maintenance spend, and energy consumption data.
Strategy 1: Predictive Maintenance Analytics — Eliminate Unplanned Downtime Costs
Unplanned downtime is the single largest controllable cost in FMCG manufacturing, representing 3–8% of total operational expenditure depending on asset intensity and maintenance maturity. For a mid-size FMCG facility with $200M in annual operating cost, that translates to $6–16M in downtime-related losses annually — including lost production output, emergency repair premiums, overtime labor, expedited freight on replacement parts, and quality scrap during restart cycles.
iFactory's predictive maintenance module ingests real-time PLC telemetry — vibration, temperature, motor amp draw, pressure — and applies AI models trained on each asset's normal operating envelope to detect deterioration patterns 2–14 days before failure. The result is a shift from reactive emergency repairs to planned condition-driven interventions scheduled during normal production windows. Documented installations show 40–55% reduction in unplanned downtime events and 18–25% reduction in total maintenance spend within 12 months of deployment. to see a predictive maintenance ROI projection for your facility.
Strategy 2: Robotic Health Monitoring & Utilization Optimization
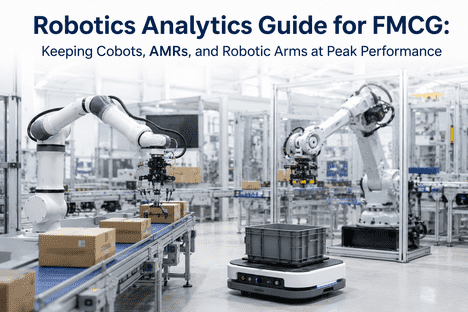
FMCG facilities increasingly depend on robotic palletisers, case packers, pick-and-place systems, and automated guided vehicles — but robot downtime is disproportionately expensive because it cascades across downstream operations. A single failed palletising robot on a high-speed beverage line can stall an entire packaging hall within 12 minutes of failure, creating a cost multiplier that far exceeds the robot's repair expense.
iFactory's Robotics AI module monitors joint temperatures, cycle time deviation, end-effector alignment drift, and controller fault codes across every robot in the facility. The platform identifies degradation patterns — a 3ms increase in cycle time over 14 days, a 2-degree joint temperature rise that compounds with each shift — and generates predictive work orders before the robot faults. Facilities using iFactory Robotic Health Monitoring report 35–50% reduction in unplanned robot downtime and a 12–18% increase in effective robot utilization through reduced fault-clearing interventions and optimized changeover sequences.
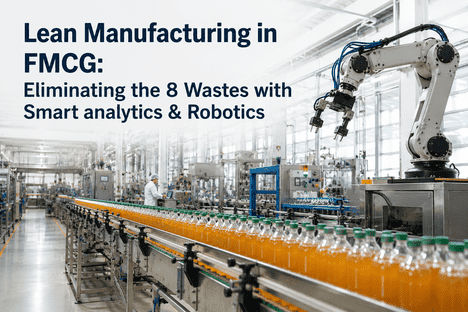
Strategy 3: OEE Analytics & Line Performance Optimization
Overall Equipment Effectiveness is the unifying metric that quantifies how well an FMCG line converts available production time into quality output. A typical FMCG facility operates at 60–75% OEE, meaning 25–40% of potential production capacity is lost to downtime, speed loss, and quality defects. Each percentage point of OEE improvement in a high-volume snack or beverage plant recovers $500,000–$1,200,000 in annual output value without incremental capital expenditure.
iFactory's OEE Analytics module provides real-time visibility into each of the three OEE components — availability, performance, and quality — at line, shift, and asset level. The platform automatically attributes losses to root causes: micro-stops from conveyor jams, speed reduction from upstream starved conditions, quality rejects from seal temperature drift. With this attribution data, reliability teams target the specific loss categories that matter most, achieving 8–15 percentage points of OEE improvement within 6–9 months of deployment. The cost reduction flows directly from more output per input dollar — lower unit cost without adding labor, energy, or materials.
Strategy 4: Energy Consumption Analytics & Demand Optimization
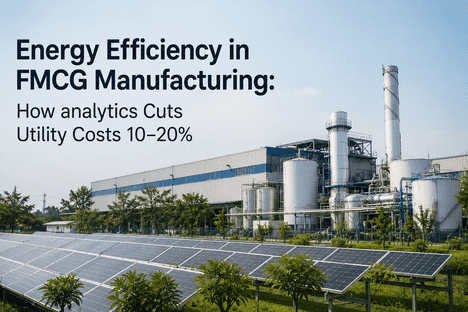
Energy is the second-largest operating cost in most FMCG facilities after raw materials, comprising 8–18% of total operational expenditure depending on product category. Baking, frying, freezing, refrigeration, compressed air, and HVAC systems are the primary consumers — and most facilities operate these systems at fixed setpoints regardless of production load, ambient conditions, or energy pricing windows.
iFactory's Energy Monitoring module tracks consumption at the circuit and machine level, correlating energy use with production volume to calculate specific energy consumption per unit of output. The platform identifies three categories of savings: (1) baseline load reduction — equipment running during non-production periods that should be shut down, (2) process optimization — adjusting setpoints based on actual thermal load rather than fixed schedules, and (3) demand management — shifting high-consumption tasks to lower-pricing windows. Deployed facilities achieve 12–22% reduction in total energy cost without reducing production throughput.
Strategy 5: Spare Parts Inventory Optimization & MRO Spend Reduction
FMCG maintenance organizations carry $3–8M in MRO inventory across typical multi-plant operations — and 25–40% of that inventory turns over less than once per year. The cost of carrying excess inventory (storage, insurance, obsolescence, capital tied up) plus the cost of emergency procurement (expedited freight, premium pricing, rush handling) together represent 15–25% of total maintenance spend.
iFactory's parts and inventory module integrates work order history with consumption forecasting to optimize stock levels. Every time a work order is completed, the platform updates part consumption velocity, lead time variability, and criticality weighting — then recalculates min-max levels and reorder points automatically. The results: 20–30% reduction in MRO inventory value within 12–18 months, 40–60% reduction in emergency parts orders, and elimination of stockout-driven downtime through automated low-stock alerts tied to reorder workflows.
Strategy 6: Quality Analytics & Scrap Reduction
Quality rejects and rework consume 3–6% of FMCG production value in most facilities — representing direct material loss, energy waste, and labor hours that cannot be recovered. The root causes of quality defects — seal temperature drift, fill weight variation, package integrity failure, colour inconsistency — are almost always detectable through process parameter trends before they produce out-of-spec product.
iFactory's quality control management and statistical quality control (SQC) modules monitor critical process parameters in real time, applying control limit rules that trigger corrective action before parameters drift outside specification. When a parameter approaches the upper control limit, the platform alerts the line operator and — if the drift continues — generates a maintenance work order to investigate the root cause. Facilities using iFactory's SQC integration report 30–50% reduction in quality-related scrap and a corresponding decrease in material cost of goods sold within 6 months.
Strategy 7: Shift Scheduling & Labor Productivity Analytics
Labor is the third-largest operating cost in FMCG manufacturing, and most facilities operate with 15–25% hidden labor inefficiency — overtime premiums for tasks that could be performed during standard hours, shift overlap that adds cost without adding coverage, and technician time lost to searching for parts, instructions, or authorization.
iFactory's team management and shift logbook modules provide real-time visibility into labor allocation by shift, line, and task type. The platform tracks technician hours against work order types — planned vs. reactive — and identifies the specific tasks that consume disproportionate labor time. With this data, plant management can restructure shift assignments, reduce overtime by aligning technician coverage with actual workload patterns, and eliminate the 2–4 hours per technician per week lost to administrative tasks (paperwork, parts searching, supervisor check-ins). Deployed facilities report 10–18% reduction in total maintenance labor cost and 20–30% reduction in overtime spend within 6 months.
Strategy 8: Water & Wastewater Analytics (CIP Optimization)
For beverage, dairy, and liquid-food FMCG facilities, clean-in-place (CIP) operations consume 15–25% of total water usage and generate proportional wastewater treatment costs. Most CIP systems operate on fixed-time or fixed-volume cycles regardless of actual soil load, resulting in significant chemical, water, and energy waste.
iFactory's production monitoring module tracks CIP cycle parameters — flow rate, temperature, conductivity, chemical concentration — and correlates them with production run characteristics (product type, run length, changeover sequence) to optimize each CIP cycle for the actual cleaning requirement rather than a fixed template. The platform identifies CIP cycles where parameters exceed the minimum cleaning threshold and recommends optimized setpoints that maintain hygienic standards while reducing resource consumption. Facilities achieve 20–35% reduction in water usage, 15–25% reduction in chemical consumption, and 10–18% reduction in CIP energy cost within 6 months of optimization. Book a Demo to see a CIP optimization analysis based on your current cycle parameters.
Strategy 9: Compliance-Driven Cost Avoidance & Audit Readiness
Regulatory compliance in FMCG — FDA food safety, FSMA, BRCGS, SQF, GFSI — generates significant indirect costs: audit preparation time, corrective action documentation, non-compliance penalties, and lost revenue from customer audits that disqualify facilities with compliance gaps. The cost of a single regulatory non-compliance event can reach $500,000–$2,000,000 when recall costs, production shutdown, and legal exposure are included.
iFactory's safety compliance, EHS management, and smart document management modules automate the compliance workflow — including inspection scheduling, audit trail generation, corrective action tracking, and document version control. The platform maintains a live compliance dashboard showing the status of every regulatory requirement, due date, and assigned owner — eliminating the manual audit preparation cycle that consumes 200–400 hours annually at most facilities. By embedding compliance checks into the daily work order workflow rather than treating compliance as a separate audit activity, facilities reduce audit preparation time by 40–60% and eliminate the cost of non-compliance events entirely.
Strategy 10: Integrated Cost Analytics & Operational Dashboard — The 25% Reduction Target
Each of the nine strategies above targets a specific cost category. Strategy 10 is the multiplier that ensures the combined savings reach and sustain 25%: an integrated cost analytics platform that tracks every cost dimension — maintenance spend, energy consumption, labor productivity, scrap rate, MRO inventory, water usage, compliance cost — on a single operational dashboard with drill-down to line, shift, and asset level. Without integrated analytics, individual strategy savings erode over time because there is no mechanism to detect when a cost category re-accelerates.
iFactory's automated analytics reporting and operational dashboard modules aggregate data from every platform capability — predictive maintenance, OEE, energy, quality, inventory, labor, CIP, compliance — into a unified cost-per-unit view. Plant and enterprise leadership see a single Operational Cost Index that tracks the combined effect of all strategies against the 25% reduction target. When a category trends in the wrong direction, the dashboard surfaces the specific asset or process driving the variance and triggers an investigation workflow before the cost drift compounds. Facilities running the integrated dashboard maintain 85–95% of initial cost savings at 18 months post-deployment — versus 40–60% savings retention for facilities that deploy individual strategies without integrated cost analytics. Book a Demo to see how the iFactory operational dashboard consolidates all 10 strategies into a single cost management view.
The Combined Impact: How 10 Strategies Deliver 25% Cost Reduction
The table below summarizes the average cost reduction contribution of each strategy based on documented results across iFactory's FMCG deployment base. Individual facility results vary based on current cost structure, asset intensity, and deployment scope — but the combined effect across all 10 strategies consistently reaches or exceeds 25% reduction in total operational cost within 12–18 months.
| Strategy | Cost Category Targeted | Average Cost Reduction | Typical Timeline to Full Impact | iFactory Platform Module |
|---|---|---|---|---|
| 1. Predictive Maintenance Analytics | Unplanned downtime, emergency repairs | 18–25% of maintenance spend | 6–12 months | Predictive Maintenance, EAM |
| 2. Robotic Health Monitoring | Robot downtime, fault clearance | 35–50% of robot-related downtime | 3–6 months | Robotics AI |
| 3. OEE Line Analytics | Lost output, unit cost | 8–15 OEE points (12–20% output gain) | 6–9 months | OEE Analytics, Production Monitoring |
| 4. Energy Optimization | Electricity, gas, compressed air | 12–22% of energy cost | 3–9 months | Energy Monitoring |
| 5. MRO Inventory Optimization | Inventory carrying cost, emergency procurement | 20–30% of MRO inventory value | 12–18 months | Parts & Inventory, Vendor Management |
| 6. Quality / Scrap Reduction | Material loss, rework | 30–50% of scrap cost | 3–9 months | Quality Control, SQC |
| 7. Labor Productivity | Overtime, shift inefficiency | 10–18% of maintenance labor cost | 3–6 months | Team Management, Shift Logbook |
| 8. CIP Optimization | Water, chemicals, energy | 20–35% of CIP water cost | 3–6 months | Production Monitoring |
| 9. Compliance Cost Avoidance | Audit prep, non-compliance risk | 40–60% of audit overhead | 3–6 months | Safety Compliance, EHS, Document Management |
| 10. Integrated Cost Analytics | All categories — savings retention | 85–95% savings retention at 18 months | Ongoing | Analytics Reporting, Operational Dashboard |
Building the Business Case: From Strategy to Budget Approval
The combined cost reduction of 25% across the 10 strategies produces a financial impact that is large enough to justify a formal capital investment review. For a $200M FMCG facility, 25% operational cost reduction recovers $50M in annual savings — but the deployment cost to achieve that target is a fraction of that number.
iFactory structures every enterprise deployment in phases aligned with the highest-impact strategies first: typically OEE analytics and predictive maintenance in Phase 1 (addressing the largest cost categories — downtime and output loss), followed by energy and CIP optimization in Phase 2 (addressing the fastest-payback categories — utilities), and inventory, labor, and compliance in Phase 3. Each phase generates documented savings that fund the next phase investment, eliminating the need for a single, large upfront capital allocation. Typical first-year platform investment for a multi-line facility ranges from $85,000–$220,000, with payback achieved within 8–14 months from first-phase savings alone. The full 10-strategy deployment across 12–18 months delivers a 3–6× enterprise ROI measured against total platform and implementation cost.
Conclusion: Cost Reduction Is a System Architecture Decision
The 10 strategies presented in this article are not independent initiatives that can be deployed in isolation. Each strategy relies on the same data infrastructure — real-time asset telemetry, digital work order execution, integrated cost analytics — to deliver its savings contribution. Facilities that deploy individual strategies without the underlying platform architecture see initial savings erode as data silos re-form and manual processes re-emerge around the point solutions. The 25% cost reduction target is achievable only when all 10 strategies operate on a unified platform that connects sensor data to work orders to cost dashboards in a single closed loop.
iFactory AI provides that unified platform — purpose-built for FMCG manufacturing with pre-configured OEE models, predictive maintenance rule sets, energy baselines, CIP optimization templates, and cost analytics dashboards. The first step toward 25% cost reduction is not selecting which strategy to deploy first — it is establishing the data infrastructure that makes all 10 strategies possible. Book a Demo to see the iFactory platform consolidated cost reduction architecture and receive a facility-specific savings estimate based on your current operational data.
Frequently Asked Questions
Which of the 10 strategies delivers the fastest payback?
Energy optimization (Strategy 4) and CIP optimization (Strategy 8) typically deliver the fastest payback — within 3–4 months — because they require minimal configuration and produce immediate reductions in utility consumption. Predictive maintenance (Strategy 1) delivers the largest absolute savings but requires a baselining period of 4–6 weeks before threshold-based cost avoidance begins.
Can the 10 strategies be deployed incrementally, or must they be implemented together?
They are designed for phased deployment. iFactory structures every implementation starting with Strategies 1 and 3 (predictive maintenance and OEE analytics) as the data foundation, then adding energy, quality, inventory, and labor modules in subsequent phases as the platform matures. Each phase is independent but builds on the same asset hierarchy and data infrastructure.
What size facility is needed to justify the full 10-strategy deployment?
Facilities with $50M+ in annual operational expenditure (typically 3+ production lines or a single high-speed line running 24/7) generate sufficient cost reduction value to justify the full platform investment within 12–18 months. Smaller facilities typically deploy the first 4–5 strategies in Phase 1 and expand based on demonstrated ROI.
How does iFactory integrate with existing ERP, SCADA, or PLC systems?
iFactory connects via OPC-UA, MQTT, Modbus, and REST APIs to existing PLC and SCADA infrastructure without requiring changes to control logic. For ERP integration, the platform supports bidirectional synchronization with SAP PM, Oracle EAM, Infor, and most major CMMS platforms for asset master data, work order status, and parts consumption.
What is the typical enterprise ROI for a full 10-strategy deployment?
Based on documented results across iFactory's FMCG deployment base, the 3-year enterprise ROI for a full-scope deployment ranges from 3.2× to 6.8×, depending on facility size, current cost structure, and deployment speed. First-year payback is typically achieved within 8–14 months from Phase 1 savings alone.