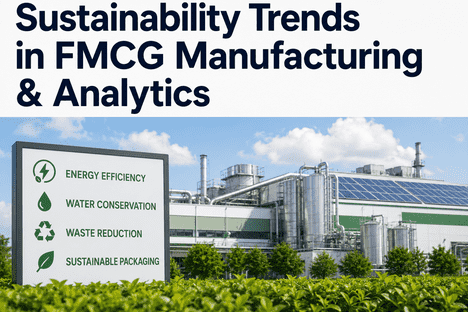
Fast-moving consumer goods (FMCG) manufacturing accounts for approximately 5–8% of global industrial CO₂ emissions — a carbon footprint driven not primarily by direct fossil fuel combustion but by the embedded energy in production processes: steam generation for sterilization and evaporation, compressed air for pneumatic conveying and packaging machinery, refrigeration for cold chain and storage, HVAC for clean rooms and conditioned spaces, and the electricity consumed by motors, pumps, conveyors, and fillers that operate across multi-line, multi-shift production schedules. The pathway to net-zero in FMCG is fundamentally an analytics problem: Scope 1 emissions (direct fuel combustion in boilers, ovens, furnaces, and fleet vehicles) and Scope 2 emissions (purchased electricity, steam, heating, and cooling) are generated by equipment and processes that are already instrumented with sensors, meters, and PLCs — but the data from those instruments is siloed in separate SCADA, BMS, and utility management systems, never correlated to production output, and reviewed weeks or months after the energy was consumed. AI-driven carbon analytics closes this gap by connecting real-time energy and emissions data to production scheduling, equipment efficiency, and maintenance activity — enabling FMCG manufacturers to track carbon intensity per unit of production, identify abatement opportunities with verified savings, and report progress against Science Based Targets initiative (SBTi) commitments with auditable data. iFactory AI's industrial software platform, including its Carbon Tracking module and ESG Dashboard, enables FMCG sustainability teams to deploy comprehensive emissions analytics without replacing existing energy meters, utility billing systems, or corporate sustainability reporting platforms. Book a Demo to see how iFactory connects production data to carbon intelligence across your FMCG facility.
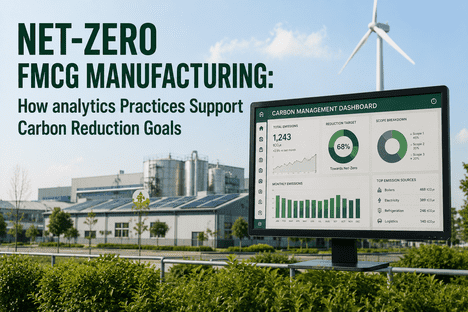
Turn Production Data Into Carbon Reduction Intelligence
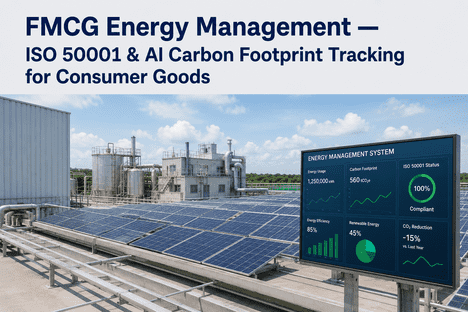
iFactory's Carbon Tracking module connects to your existing energy meters, utility bills, and production systems — delivering per-unit carbon intensity tracking, automated abatement opportunity identification, and SBTi-aligned reporting without replacing your existing instrumentation or sustainability platforms.
The Carbon Challenge in FMCG Manufacturing: Why Scope 1 and 2 Emissions Persist
FMCG manufacturers have made significant progress in renewable electricity procurement — many of the largest global FMCG companies have achieved 60–100% renewable electricity coverage through power purchase agreements and on-site solar. Yet Scope 1 emissions from natural gas and diesel combustion in boilers, ovens, dryers, furnaces, and fleet vehicles remain the dominant and most difficult-to-abate component of the FMCG carbon footprint. The structural reason is that process heat — steam for CIP sterilization, hot water for cleaning, thermal energy for drying and evaporation — accounts for 55–75% of total energy consumption in a typical food and beverage FMCG facility, and the industrial heat pumps, biomass boilers, and electric steam generators needed to replace natural gas-fired equipment have capital costs and technology maturity timelines that constrain rapid deployment. Until electrification of process heat becomes economically viable at scale, the most effective carbon reduction lever available to FMCG manufacturers is energy efficiency — producing the same output with less thermal and electrical energy through analytics-driven optimization of the equipment and processes that consume energy.
Process Heat Share of FMCG Energy
Steam, hot water, and direct thermal energy for sterilization, evaporation, drying, and cleaning — the dominant and most difficult-to-abate energy end-use in food, beverage, and personal care manufacturing.
Electric Motor & Drive Share
Motors powering conveyors, pumps, compressors, fans, and fillers — the second-largest energy consumer. Analytics-driven motor efficiency optimization, VFD utilization, and compressed air leak reduction offer immediate Scope 2 savings.
Refrigeration & HVAC Share
Cold storage, chilled water systems, clean room HVAC, and refrigerated transport — a significant energy consumer where analytics-driven setpoint optimization, defrost scheduling, and condenser maintenance deliver 15–30% energy reduction.
Compressed Air Share
Compressed air is the most expensive utility in FMCG plants — 1 kW of compressed air requires 7–10 kW of electrical input. Uncontrolled leaks, inappropriate end-uses, and fixed-speed compressor operation waste 20–40% of compressed air energy.
Emissions Sources and Analytics Abatement Strategies by Scope
Effective carbon reduction requires granular visibility into emissions sources across all three scopes, correlated to production activity. The table below documents the primary emissions sources in FMCG manufacturing, the data sources and analytics methods iFactory uses to track each source, the typical abatement potential through analytics-driven efficiency, and the SBTi-aligned reporting framework for each category. Sustainability managers who have Book a Demo consistently report that per-equipment carbon intensity visibility reveals abatement opportunities that facility-level energy audits miss entirely.
| Emissions Scope | Primary Sources in FMCG | Data Source for Analytics | Analytics Abatement Method | Typical Reduction |
|---|---|---|---|---|
| Scope 1 — Stationary Combustion | Natural gas boilers, steam generators, ovens, dryers, furnaces, thermal fluid heaters | Gas meter hourly data, steam flow meters, burner modulation signals, boiler efficiency trends from flue gas O₂ and temperature | AI boiler efficiency optimization, steam demand forecasting, condensate return rate tracking, burner staging optimization, insulation degradation detection | 8–18% |
| Scope 1 — Mobile Combustion | Forklift fleet, material handling vehicles, delivery trucks, yard tractors | Fuel dispensing records, engine hours, telematics data, route optimization systems | Electric vehicle transition analytics, route efficiency optimization, idle time reduction through shift scheduling, battery charging optimization for electric fleet | 5–25% |
| Scope 1 — Refrigerants | Industrial refrigeration systems, cold storage, chillers, refrigerated transport | Refrigerant inventory records, leak detection system data, make-up gas logs, equipment runtime and head pressure trends | Leak rate trending and automated alerting, predictive maintenance for condenser and evaporator coils, defrost cycle optimization via AI, refrigerant transition planning analytics | 10–30% |
| Scope 2 — Purchased Electricity | Motor-driven systems (conveyors, pumps, fans, compressors), lighting, HVAC, refrigeration, office equipment | Utility meter interval data (15-min or hourly), sub-meter data by zone/line, motor VFD speed signals, lighting zone schedules | Night-line and weekend base load reduction, motor load optimization, VFD retro-commissioning analytics, compressed air leak detection, HVAC setpoint optimization, peak demand reduction | 12–25% |
| Scope 3 — Purchased Goods & Services | Raw materials, packaging, ingredients, third-party processing, waste disposal | Supplier emission factors, purchase order data, waste disposal records, transportation distance and mode | Supplier emission factor tracking, packaging weight reduction analytics, waste diversion rate monitoring, transportation mode optimization, water consumption tracking | Variable |
How Analytics Drive Carbon Reduction Across FMCG Production
The fundamental insight of analytics-driven carbon management is that emissions are a function of production activity — and every production activity can be optimized. iFactory's Carbon Tracking platform connects energy and emissions data to production output, equipment efficiency, and maintenance activity through a five-stage analytics pipeline that transforms raw meter data into verified carbon reduction.
Real-Time Energy & Emissions Monitoring
iFactory connects to existing utility meters, sub-meters, gas meters, steam flow meters, and compressor power monitors through OPC-UA, Modbus, MQTT, and utility API integrations — reading energy consumption data at 15-minute intervals or finer. Emissions factors from the EPA eGRID, IEA, or corporate-specific factors are applied automatically to convert energy consumption to CO₂-equivalent emissions per scope. Live dashboards display facility-level, zone-level, and equipment-level carbon intensity (kg CO₂e per unit of production) updated every 15 minutes — providing the real-time visibility that monthly utility bills cannot deliver.
Production-Correlated Carbon Intensity Tracking
Carbon data is meaningless without production context. iFactory correlates energy and emissions data to production output (units, liters, kilograms, batches) from the MES, ERP, or Shift Logbook, computing carbon intensity per unit of production in real time. A shift producing 12,000 cases with 8.2 tCO₂e has a different carbon intensity than a shift producing 10,500 cases with 7.9 tCO₂e — the analytics platform identifies which shifts, lines, and products have above- or below-average carbon intensity and quantifies the savings from replicating best-performing production patterns.
Base Load & Non-Production Waste Identification
The largest single source of avoidable emissions in FMCG facilities is energy consumed during non-production hours — overnight, weekends, and holidays — when production equipment, HVAC, compressed air, and lighting continue to operate at production-level consumption despite zero output. iFactory's base load analytics identify the minimum energy consumption during non-production hours per zone, compute the cost and emissions impact of the excess, and rank reduction opportunities by savings potential. Typical facilities identify $50,000–$250,000 per year in avoidable energy waste through non-production hour analysis alone.
Equipment Efficiency & Degradation Analytics
Equipment energy efficiency degrades over time — boiler efficiency drops 1–3% per year from scale buildup on heat transfer surfaces; compressor efficiency declines 2–5% from worn valves and degraded intercooler performance; chiller efficiency erodes 3–6% from condenser fouling and refrigerant charge loss. These efficiency losses are invisible to operators and maintenance teams because the degradation happens gradually — 0.1–0.5% per month — and is masked by production volume changes and seasonal ambient conditions. iFactory's AI models track energy efficiency per asset over time, normalizing for production rate and ambient conditions, and flag efficiency degradation the moment it exceeds the learned deterioration rate — enabling condition-based cleaning, maintenance, and replacement scheduling that reverses efficiency loss.
Verified Abatement Reporting & SBTi Disclosure
Every analytics-identified abatement action — base load reduction, efficiency improvement, leak repair, schedule optimization — is tracked through the Shift Logbook with pre- and post-implementation energy and emissions data, producing auditable verified savings reports. iFactory's ESG Dashboard aggregates verified abatement data into SBTi-aligned progress reports, CDP disclosure templates, and internal sustainability dashboards — eliminating the manual data collection and spreadsheet consolidation that consumes 60–80% of sustainability team reporting time.
Book a Demo to see how iFactory's carbon analytics pipeline connects energy data to production context and delivers verified, auditable carbon reduction — not modeled estimates but measured savings from actual meter data.
"Our sustainability team spent 14 person-weeks per quarter manually collecting energy data from 23 facilities, normalizing it to production output, and consolidating it into our CDP report. iFactory's Carbon Tracking module automated 90% of that work in the first month after deployment. More importantly, the per-line carbon intensity tracking revealed that our highest-volume production line had 22% higher carbon intensity than an identical line in the same facility — because the line was running at 75% utilization with the same HVAC and compressed air load as the 95% utilized line. We saved $380,000 in energy costs and 1,200 tCO₂e annually by adjusting the production scheduling to consolidate orders on the more efficiently utilized line. That single insight paid for the entire platform investment in the first quarter."
iFactory Carbon Tracking & ESG Dashboard: Capabilities for FMCG Net-Zero Programs
iFactory's Carbon Tracking module and ESG Dashboard are purpose-built for FMCG manufacturers that already have energy meters, utility billing data, and production tracking systems but lack the analytics layer to convert operational data into verified carbon reduction and SBTi-aligned reporting. The platform connects to existing instrumentation through standard industrial protocols and provides seven core capabilities for net-zero program management.
Real-Time Carbon Intensity Dashboards
Per-facility, per-line, per-product carbon intensity (kg CO₂e per unit of production) updated every 15 minutes from connected meter data and production output signals. Carbon intensity trended daily, weekly, monthly, and year-over-year against SBTi reduction targets with automatic variance alerts when intensity deviates from the reduction trajectory.
Base Load & Non-Production Waste Analytics
Automated identification of energy consumption during non-production hours per zone, line, and equipment category. Night-line minimum power analysis separates production-related consumption from standby waste. Each waste source quantified in kWh, tCO₂e, and cost with ranked reduction recommendations.
Equipment Efficiency Degradation Monitoring
AI-powered efficiency trend tracking for boilers, compressors, chillers, steam systems, and motor-driven equipment. Degradation detection with 0.5% sensitivity — catching efficiency loss months before it would be visible in monthly utility bills. Condition-based maintenance recommendations with verified energy and carbon savings.
Verified Abatement Tracking
Every carbon reduction action tracked through the Shift Logbook with pre-implementation baseline and post-implementation measurement. Verified savings calculated from meter data, not engineering estimates. Audit trail includes date, time, equipment, action taken, measured energy reduction, and calculated emissions reduction for SBTi and CDP verification.
SBTi-Aligned Reporting & Target Tracking
Automated consolidation of Scope 1 and 2 emissions data into SBTi-aligned reporting templates. Near-term and long-term reduction target tracking with trajectory visualization, progress-to-date reporting, and forecast completion dates based on current reduction rate and planned abatement actions.
CDP & ESG Disclosure Automation
Automated population of CDP climate change questionnaire, ESG report templates (GRI, SASB, TCFD-aligned), and internal sustainability dashboards. Eliminates the manual spreadsheet consolidation and data validation work that consumes sustainability team capacity.
Production Scheduling Carbon Optimization
Integration with MES and production scheduling systems enables carbon-aware production planning — shifting energy-intensive production to hours with lower grid carbon intensity, consolidating production on higher-efficiency lines, and scheduling equipment cleaning and maintenance to avoid non-production energy waste.
The ROI of Carbon Analytics in FMCG Manufacturing
The business case for carbon analytics in FMCG manufacturing combines direct energy cost savings, carbon compliance risk reduction, and sustainability reporting efficiency gains. Facilities deploying iFactory's Carbon Tracking platform alongside their existing energy management and sustainability programs report measurable improvements across four key metrics within the first quarter of operation.
Verified emissions reduction per unit of production within 6 months of deployment through base load elimination, efficiency recovery, and production scheduling optimization.
Automated data collection, normalization, and report generation eliminates manual spreadsheet consolidation — freeing sustainability team capacity for abatement action planning.
Direct energy cost reduction through base load waste elimination, equipment efficiency recovery, and compressed air leak detection for a mid-size FMCG facility.
Full platform investment recovered through energy cost savings alone within the first year. Carbon reporting efficiency gains and compliance risk reduction provide additional unquantified value.
Implementation Approach for FMCG Carbon Analytics
iFactory follows a structured deployment methodology designed specifically for FMCG sustainability programs — integrating with existing energy meters, utility data sources, and production tracking systems without disrupting established reporting workflows. The implementation timeline for a typical multi-line FMCG facility is 4–6 weeks from data connection to operational carbon dashboards.
Carbon Analytics Deployment Phases
Connect utility meter interval data (electric, gas, water, steam) through utility API, OPC-UA, Modbus, or manual CSV import. Configure emissions factors per scope and region. Integrate production output data from MES, ERP, or Shift Logbook.
Platform ingests 12 months of historical energy and production data to establish carbon intensity baselines per facility, line, and product category. SBTi reduction targets configured with trajectory visualization. ESG Dashboard templates customized.
Night-line minimum power analysis completed. Non-production hour waste quantified per zone and ranked by savings potential. First set of abatement recommendations delivered to facility management for action.
Carbon dashboards live with real-time intensity tracking. Verified savings reporting operational. Sustainability team trained on ESG Dashboard, CDP report generation, and SBTi progress tracking. 30-day supervised operation with weekly model refinement.
Net-Zero FMCG Manufacturing — Common Questions Answered
How does iFactory handle emissions factor selection and updates across different regions and reporting frameworks?
iFactory's Carbon Tracking module includes a comprehensive emissions factor library covering Scope 1 (stationary and mobile combustion factors per fuel type from EPA, IPCC, IEA, and national inventory sources), Scope 2 (location-based and market-based factors from EPA eGRID, IEA, AIB, and national grid operator data), and Scope 3 (purchased goods, transportation, waste, and business travel factors from EPA, DEFRA, and industry association sources). Emissions factors are updated automatically when regulatory sources publish revisions, with a change log tracking every factor update for audit trail. Facilities can override library factors with corporate-specific or supplier-specific emissions factors where more accurate data is available. The platform always reports both location-based and market-based Scope 2 factors in alignment with the GHG Protocol Scope 2 Guidance.
Does iFactory's carbon tracking require new sub-metering installations, or can it work with existing utility data?
iFactory is designed to work with the data sources already available in most FMCG facilities — no new sub-metering is required for initial deployment. The platform ingests data from: utility interval meters through Green Button, utility API, or CSV export; existing sub-meters and energy management systems via OPC-UA, Modbus, BACnet, or MQTT; gas meters, steam flow meters, and thermal energy meters through Modbus or PLC connection; and production output data from MES, ERP, or Shift Logbook. For facilities with minimal sub-metering, iFactory provides virtual sub-metering analytics that estimate zone-level and equipment-level energy consumption from production schedules, equipment runtime data, and nameplate ratings — enabling carbon intensity tracking by line and product category without capital investment in new meters. As sub-meters are added over time, the virtual estimates are replaced with measured data, improving accuracy without requiring a large upfront capital investment.
How does iFactory ensure that reported carbon reductions are verified and auditable for SBTi and CDP disclosure?
Every carbon reduction action tracked through iFactory follows a verified savings protocol: baseline energy consumption is established from 12 months of historical meter data normalized to production output and ambient conditions; the abatement action is documented in the Shift Logbook with date, time, equipment, action taken, and responsible personnel; post-implementation energy consumption is measured from the same meter data sources for a minimum of 30 days of operation; the verified savings are calculated as the difference between baseline and post-implementation consumption using the same production normalization factors. The complete audit trail — baseline data, action documentation, post-implementation data, and savings calculation — is stored in the platform and exportable for third-party verification. This methodology aligns with the GHG Protocol for Project Accounting, ISO 14064-2, and SBTi's Measurement, Reporting, and Verification (MRV) requirements.
Can iFactory integrate with existing corporate sustainability reporting platforms and ESG software?
Yes. iFactory's ESG Dashboard is designed to serve as the operational data layer that feeds into corporate sustainability reporting platforms — not as a replacement for enterprise-level ESG reporting systems. The platform supports automated data export through API, CSV, and direct integration with major ESG reporting platforms including Salesforce Net Zero Cloud, SAP Sustainability Management, Enablon, Greenstone, and Persefoni. iFactory delivers the granular facility-level, line-level, and product-level carbon intensity data that enterprise ESG platforms cannot provide, while the enterprise platform handles corporate-level consolidation, financial materiality assessment, and investor-grade reporting. This architecture allows FMCG manufacturers to deploy operational carbon analytics at the facility level without disrupting their corporate sustainability reporting infrastructure. The Shift Logbook captures the operational context and verified savings data that sustainability teams need for meaningful CDP and TCFD disclosure.
What is the difference between iFactory's Carbon Tracking module and the energy monitoring features in a typical SCADA or BMS system?
SCADA and BMS systems provide raw energy data — meter readings, trend charts, and alarm thresholds — but lack the production context, carbon analytics, and reporting capabilities required for net-zero program management. iFactory's Carbon Tracking module adds five capabilities that SCADA and BMS systems do not provide: production-correlated carbon intensity (kg CO₂e per unit of production) computed from the same energy data plus production output from the MES or Shift Logbook; automated emissions factor application and Scope classification per the GHG Protocol; base load and non-production hour waste identification with quantified savings potential; verified savings tracking with audit trail for SBTi and CDP disclosure; and automated SBTi target trajectory tracking with progress reporting. iFactory does not replace SCADA or BMS systems — it connects to them, reads the energy data they already capture, and adds the carbon intelligence layer that transforms raw meter readings into actionable net-zero program management.
Deploy Carbon Tracking & ESG Dashboard for Your FMCG Facility
iFactory's Carbon Tracking module connects to your existing energy meters, utility data, and production systems — delivering per-line carbon intensity tracking, automated abatement identification, base load waste elimination, equipment efficiency monitoring, and SBTi-aligned reporting in 4–6 weeks with zero new meter installation required.