Every EHS Manager in FMCG manufacturing faces the same converging pressure in 2025: ISO 50001 certification deadlines are accelerating, retailer sustainability scorecards are tightening, and ESG reporting frameworks from CSRD in Europe to SEC climate disclosure rules in the US demand granular, auditable energy data that manual tracking systems cannot reliably produce at portfolio scale. Energy management is no longer an environmental initiative it is the operational foundation of market access, regulatory compliance, and cost competitiveness in consumer goods manufacturing. FMCG facilities that deploy AI-driven energy monitoring and carbon footprint tracking are not running sustainability pilots. They are building the data infrastructure that will determine retailer shelf access, investor confidence, and regulatory standing through the end of this decade. The question for EHS Managers is not whether to invest in energy management systems it is how to deploy AI analytics that convert energy data into ISO 50001-ready performance indicators and verifiable carbon reduction evidence, without adding headcount to manage the technology layer.
AI Energy Monitoring · ISO 50001 Compliance · Carbon Footprint · ESG Reporting · Retailer Scorecard
Turn Energy Data Into Certified Management System Evidence Without Building a Data Science Team.
iFactory delivers AI-powered energy monitoring, automated ISO 50001 EnPI tracking, carbon footprint calculation, and ESG-ready reporting as a fully managed service — live across your FMCG facilities in weeks, not quarters.
15–25%
Typical energy intensity reduction achieved by FMCG facilities with ISO 50001-certified EnMS within the first three years — driven by the Plan-Do-Check-Act cycle requiring data that only continuous monitoring provides
18,000+
ISO 50001 certifications issued globally as of 2025 — a 40% increase over the previous three years, reflecting accelerating adoption driven by regulatory mandates and retailer supply chain requirements
40%
Of FMCG companies now face mandatory ESG reporting under CSRD or SEC rules — requiring Scope 1, 2, and 3 emissions data that demands automated energy tracking across all facilities and supply chain tiers
3.2x
Retailer sustainability scorecard weighting for energy management in 2025 vs 2020 — meaning a poor energy score now directly impacts shelf allocation, listing fees, and preferred supplier status
Why ISO 50001 and Carbon Tracking Now Define EHS Leadership in FMCG
The convergence of regulatory mandates, retailer requirements, and investor expectations has elevated energy management from a facility-level operational concern to a board-level strategic imperative in FMCG manufacturing. Three structural drivers explain why EHS Managers in consumer goods cannot afford to treat ISO 50001 certification or carbon footprint tracking as discretionary programmes.
The Regulatory Horizon
CSRD, SEC climate rules, and ISO 50001 are converging into a single compliance requirement
The Corporate Sustainability Reporting Directive (CSRD) requires approximately 50,000 EU-based and EU-exporting companies to report detailed energy and emissions data under the European Sustainability Reporting Standards. In the US, the SEC's climate disclosure rules mandate Scope 1 and Scope 2 emissions reporting for publicly traded companies, with Scope 3 disclosure requirements phased in from 2026. ISO 50001 certification is increasingly referenced in both frameworks as a recognised methodology for energy performance improvement and carbon reduction verification. EHS Managers who align their energy monitoring infrastructure with ISO 50001 requirements are building a single data architecture that satisfies all three regulatory obligations — rather than managing parallel reporting systems for each mandate separately.
The Retailer Lever
Walmart, Tesco, Carrefour and others are making energy performance a supplier gate condition
Major retailers have embedded energy management metrics into their sustainability scorecards and supplier qualification frameworks. Walmart's Project Gigaton, Tesco's Supplier Playbook, and Carrefour's For Food Transition programme all require suppliers to disclose energy intensity, carbon reduction targets, and verified improvement data. The scorecard weighting for energy performance has more than tripled since 2020. For FMCG manufacturers supplying multiple retailers, each with its own reporting template and scoring methodology, the administrative burden of manual data compilation is becoming unsustainable — and the competitive penalty for a poor score is direct shelf access reduction. AI-enabled energy monitoring that automatically generates retailer-specific scorecard data from a single facility-level energy data set is the infrastructure that separates preferred suppliers from those losing listing position.
The Cost Imperative
Energy is the second-largest controllable operating cost in most FMCG facilities
Energy consumption typically represents 8–15% of total manufacturing costs in FMCG — second only to raw materials. For a mid-size food processing facility with $50M in annual operating costs, this translates to $4M–$7.5M in energy spend that is directly addressable through AI-driven energy monitoring and optimisation. The ISO 50001 requirement to establish Energy Performance Indicators (EnPIs) and track them through documented management review creates a governance structure that sustains energy reduction beyond initial efficiency projects. Without automated data collection and AI-powered anomaly detection, the EnPI monitoring obligation becomes a manual burden that consumes EHS team capacity without delivering the energy cost reduction that justifies the investment.
Your Energy Data Is the Foundation of ISO 50001 Certification and Retailer Scorecard Compliance. iFactory's AI Turns It Into Auditable, Automated Evidence.
AI-powered energy monitoring, automated EnPI calculation, carbon footprint tracking, and ESG-ready reporting — deployed as a managed service for EHS Managers who need ISO 50001 and retailer compliance without managing the data infrastructure.
How AI Transforms ISO 50001 Energy Management — From Manual EnPI Tracking to Continuous Performance Intelligence
ISO 50001's Plan-Do-Check-Act cycle requires organisations to establish energy baselines, define EnPIs, monitor performance against targets, investigate significant deviations, and document management review evidence. Each of these steps demands data collection and analysis at a frequency and granularity that manual systems cannot sustain at portfolio scale. AI-powered energy monitoring transforms ISO 50001 implementation from a documentation exercise into a continuous performance intelligence system.
1
Capability · ISO 50001
Automated EnPI Calculation and Baseline Tracking
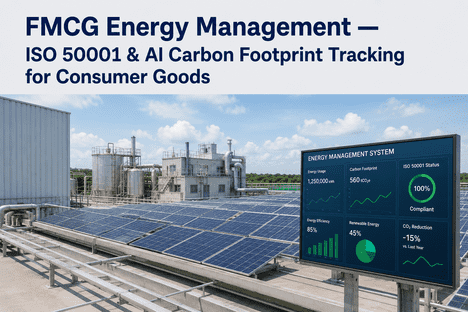
AI models ingest energy consumption data from utility meters, sub-meters, and production equipment sensors alongside production volume data to calculate normalised EnPIs — energy per unit of production, energy per operational hour, energy per throughput metric. The system automatically establishes baselines from historical data, tracks current performance against baseline, and flags statistically significant deviations that require investigation under the ISO 50001 Check phase. EnPI trends are visualised in configurable dashboards that serve as the evidence layer for management review meetings — eliminating the manual spreadsheet compilation that typically consumes 10–20 hours per review cycle. For facilities with variable production volumes — the norm in FMCG — the normalised EnPI calculation ensures that energy performance is measured against operational activity, not absolute consumption, providing the fair baseline assessment that ISO 50001 certification auditors require.
Automated baseline establishment · Production-normalised EnPIs · Management review ready dashboards
2
Capability · Carbon
Scope 1, 2, and 3 Carbon Footprint Calculation
AI-driven carbon tracking automatically calculates Scope 1 emissions from on-site fuel combustion (natural gas, propane, diesel for generators), Scope 2 emissions from purchased electricity based on utility-specific or location-based emission factors updated quarterly, and Scope 3 upstream emissions from purchased energy and fuel extraction. The platform sources emission factors from EPA eGRID, IEA, and DEFRA databases with automatic updates, ensuring carbon calculations remain aligned with the latest regulatory guidance. Carbon intensity — tonnes CO2e per unit of production — is tracked alongside absolute emissions, providing the dual metric that CSRD and SEC disclosure rules require. Facilities can model reduction scenarios — what-if switching to renewable electricity procurement, converting boiler fuel from natural gas to biomass, or installing combined heat and power — with projected carbon savings calculated against current baseline and displayed in board-ready format.
Scope 1+2+3 automated · EPA eGRID / IEA / DEFRA factors · Reduction scenario modelling included
3
Capability · AI Detection
Anomaly Detection and Energy Waste Identification
Machine learning models trained on facility-specific energy consumption patterns detect deviations from expected usage in real time — identifying energy waste events that manual monitoring would miss until the next utility bill arrives. Compressed air leaks, HVAC scheduling errors, production equipment left running during idle periods, steam trap failures, and lighting control malfunctions are detected within hours rather than weeks, with quantified energy and cost impact calculated automatically. Each anomaly triggers a notification to the responsible EHS or maintenance team member with the estimated energy loss and recommended corrective action. ISO 50001's requirement to investigate significant deviations in energy performance and document corrective actions is automated end to end — the detection, impact quantification, corrective work order generation, and verification are all tracked within the platform, creating the audit trail that certification bodies require.
Real-time anomaly detection · Quantified energy loss · Automated corrective action workflow
4
Capability · Reporting
ESG and Retailer Scorecard Report Generation
The platform generates automated reports in the formats required by each reporting framework — CSRD-format energy and emissions disclosures, SEC climate rule data tables, CDP questionnaire responses, and retailer-specific scorecard submissions including Walmart's Gigaton reporting template and Tesco's Supplier Sustainability Playbook metrics. Each report is populated from the same verified facility-level energy data, eliminating the reconciliation burden of maintaining separate data sets for each reporting obligation. Report generation is triggered on the required cadence — monthly for internal EnPI monitoring, quarterly for retailer scorecard submissions, annually for CSRD or SEC disclosures — with data validated and audit-ready before export. For EHS Managers managing multi-facility portfolios, the platform aggregates data across sites and generates consolidated reports with facility-level breakdowns, eliminating the days of manual consolidation that typically precede each reporting cycle.
CSRD · SEC · CDP · Retailer scorecard formats · Automated multi-facility consolidation
ISO 50001 and AI — The EHS Manager's Roadmap to Certification and Carbon Reduction
The path from initial energy baseline to certified ISO 50001 EnMS with verified carbon reduction follows a defined sequence of phases that align with the Plan-Do-Check-Act cycle. Each phase in the roadmap below represents a discrete capability build that builds on the data infrastructure established in the preceding phase.
ISO 50001 Implementation Roadmap — AI-Enabled Phases from Baseline to Certification
Phase
iFactory AI Capability
ISO 50001 Requirement Met
Automated data ingestion from utility meters, sub-meters, and production equipment. Historical energy data normalised against production volume. AI models establish baseline EnPIs from 12–24 months of historical data.
4.4 — Energy baseline established and documented. EnPI definitions with normalisation factors applied to variable production conditions.
Baseline EnPIs used to model achievable improvement targets by facility, asset class, and energy type. Scenario modelling for equipment upgrades, process changes, and renewable energy investments.
6.2 — Energy objectives and targets established with defined timelines and measurable improvement metrics.
Phase 3
Monitoring & Detection
Real-time EnPI tracking against targets with statistical process control. AI anomaly detection identifies energy waste events and significant EnPI deviations requiring investigation.
9.1 — Monitoring, measurement, analysis and evaluation of energy performance against EnPIs. Significant deviations investigated.
Automated management review dashboards with EnPI trends, deviation analysis, corrective action status, and target progress. One-click ESG and retailer scorecard report generation.
9.3 — Management review with documented evidence. 7.5 — Documented information maintained for certification audit.
Phase 5
Supplier Reporting
Retailer-specific sustainability scorecard data generated automatically from verified facility energy data. CDP, SBTi, and ESG framework report exports with audit trail.
6.1 — Actions to address risks and opportunities including supply chain requirements. 7.4 — Communication of energy performance to external stakeholders.
Retailer Sustainability Scorecards — What FMCG Suppliers Must Report and How AI Automates the Data
For FMCG manufacturers supplying major retailers, energy and carbon data submission is no longer voluntary. Each retailer has defined a scorecard framework with specific metrics, verification requirements, and scoring methodologies. The table below maps the most significant retailer programmes to the data iFactory's AI platform provides.
Retailer Sustainability Scorecard — Data Requirements and iFactory AI Mapping
Retailer Programme
Energy & Carbon Metrics Required
iFactory AI Data Provision
Walmart Project Gigaton
Scope 1 and 2 GHG emissions (metric tonnes CO2e), energy consumption by type (MWh), renewable energy percentage, emissions intensity (tCO2e/$M revenue), year-over-year reduction percentage
Automated from utility and meter data — Scope 1+2 calculated with EPA eGRID or location-specific factors, consumption by fuel type tracked hourly, renewable percentage calculated from REC or PPA documentation linked to facility records
Tesco Supplier Playbook
Energy intensity (kWh per unit of production), carbon reduction target with baseline year, ISO 50001 certification status, renewable energy commitment, water-energy nexus data
Production-normalised EnPI tracked continuously, baseline established from historical data, certification documentation linked to facility profile, renewable percentage tracked and verified
Carrefour For Food Transition
Carbon footprint per product category, energy mix disclosure, renewable energy sourcing, packaging-related emissions, logistics efficiency
Product-level carbon allocation from facility energy data using production allocation factors, energy mix tracked by source, renewable documentation linked
CDP Supply Chain
Full CDP climate change questionnaire — governance, strategy, risk management, metrics and targets including Scope 1, 2, and 3 emissions, energy consumption, and reduction targets
CDP-format report generated from verified facility data with all required sections populated — governance description, risk assessment, emissions inventory, target tracking, and third-party verification evidence
The EHS Manager's Decision Framework — Build, Buy, or Managed Service for Energy Management AI
The delivery model decision for AI-driven energy management determines whether ISO 50001 implementation and carbon tracking deliver measurable outcome within the current budget cycle or consume team capacity without producing certification-ready results. Three models are available to EHS Managers, and they differ substantially across every dimension that matters for a compliance-driven programme.
Energy Management AI — Delivery Model Comparison for EHS Decision-Making
Dimension
iFactory Managed Service
In-House Build
Software Licence
Deployment to EnPI tracking
4–8 weeks to first live EnPI tracking and baseline visualisation
12–24 months — data pipeline, ML model dev, dashboard build, team hiring
3–6 months — integration and configuration dependent on internal IT capacity
ISO 50001 readiness
Built-in EnPI framework, baseline management, deviation tracking, and management review dashboards aligned with ISO 50001 clause structure
Custom development required — ISO 50001 clause alignment depends on in-house expertise
Varies — some platforms offer EnPI modules, others require manual data extracts for certification
Carbon factor updates
Automatic — EPA eGRID, IEA, DEFRA factors updated quarterly within service
Manual — EHS team must track and apply factor updates across carbon calculations
Manual or limited automatic updates — depends on vendor data subscription
Retailer report generation
Pre-configured templates for Walmart, Tesco, Carrefour, CDP — one-click report generation
Manual compilation from extracted data — hours per report per retailer
Template building and data mapping required — varies by platform capability
Internal headcount
None — EHS team consumes outputs, not manages platform infrastructure
3–8 FTEs — data engineering, ML, platform operations, maintenance
1–2 FTEs — integration, configuration, ongoing platform management
"
Before deploying iFactory's AI energy monitoring platform, our ISO 50001 management review meetings were exercises in narrative reconstruction — we spent hours compiling EnPI data from utility bills and production spreadsheets, and by the time we had the numbers, the quarter was already over. Now the management review dashboard updates in real time. Our EnPI trends against baseline are visible to the leadership team every day, not every quarter. The anomaly detection caught a steam trap failure that was wasting $18,000 per month in natural gas — within 48 hours of the performance deviation appearing. We achieved ISO 50001 certification six months ahead of schedule, and our energy intensity has dropped 22% in 18 months. The platform did not add to our workload. It eliminated the manual data work that was consuming 15 hours per review cycle.
— EHS Manager, Multi-Site FMCG Food Manufacturing Operation — ISO 50001 Certified Facility Portfolio
Conclusion
Energy management in FMCG manufacturing has crossed the threshold from voluntary sustainability initiative to regulatory requirement, retailer gate condition, and cost competitiveness driver. With 18,000+ ISO 50001 certifications globally and accelerating, 40% of FMCG companies now subject to mandatory ESG reporting, and retailer sustainability scorecard weighting more than tripling since 2020, EHS Managers who do not have AI-powered energy monitoring and carbon tracking infrastructure in place are not just falling behind on sustainability — they are exposing their organisations to compliance risk, retailer de-listing, and avoidable energy cost that directly impacts margin.
The technology to automate ISO 50001 energy performance tracking, carbon footprint calculation, retailer scorecard reporting, and energy waste detection is mature and deployable within weeks — not quarters. The delivery model decision — whether to build, buy, or adopt a managed service — determines whether the EHS team spends its capacity on compliance strategy and continuous improvement or on data pipeline management and manual report compilation. The managed service model, with continuous model monitoring, automatic carbon factor updates, and pre-configured reporting templates, is the correct architecture for most FMCG organisations that need ISO 50001 certification and retailer compliance without building a data science department.
iFactory's AI energy management platform delivers automated EnPI tracking, real-time anomaly detection, Scope 1+2+3 carbon footprint calculation, and one-click retailer scorecard and ESG report generation — as a fully managed service, live across your FMCG facility portfolio within weeks. Book a Demo to see how the platform maps to your ISO 50001 implementation timeline and retailer scorecard requirements, or talk to an expert about your current energy monitoring environment and the fastest path to certified, AI-driven energy management.
Your Energy Data Already Contains the Evidence for ISO 50001 Certification. iFactory's AI Extracts It — Without Adding Headcount.
Automated EnPI tracking, real-time energy waste detection, Scope 1+2+3 carbon calculation, and ESG-ready reporting — deployed as a fully managed service for EHS Managers who need ISO 50001 and retailer compliance without the data infrastructure overhead.
Frequently Asked Questions