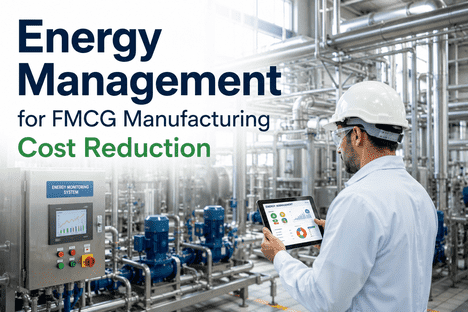
Energy Management for FMCG Manufacturing Cost Reduction
By Seren on June 2, 2026
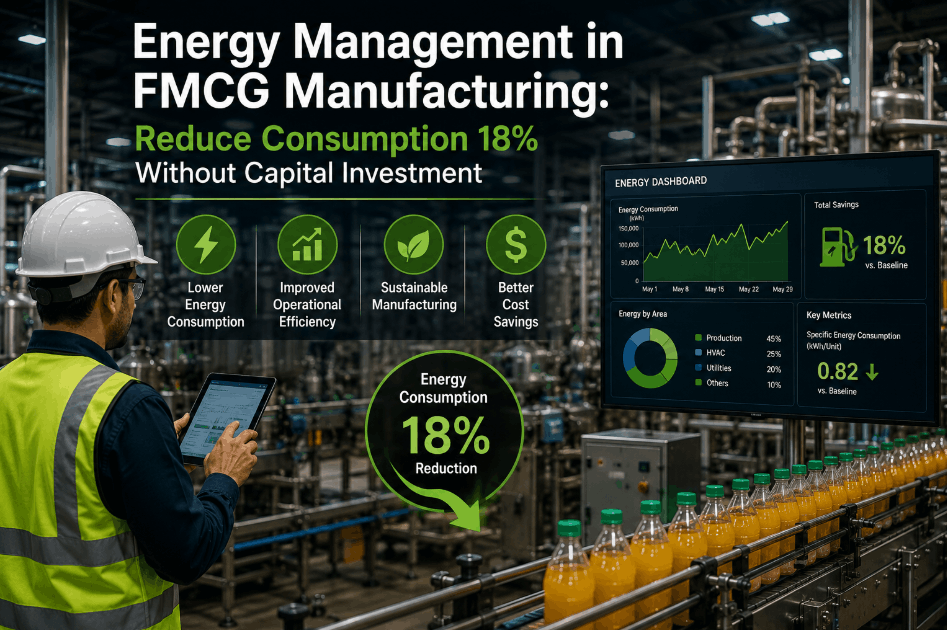
An FMCG plant producing 500 tonnes of snack food per week spends $2.8 million annually on energy compressed air leaking through a network of 47 undiscovered orifices at a cost of $124,000 per year, a refrigeration system running 3°C colder than process requires at an additional $97,000, and steam traps failing open across the plant floor wasting another $68,000 in natural gas. These are not equipment failures in the traditional sense no machine has broken down, no line has stopped, no quality incident has occurred. The energy is simply being consumed without adding value. This is the hidden profit leakage in FMCG manufacturing, and it compounds year after year because the losses are invisible to the traditional plant floor reporting systems that track production output but not energy intensity per unit. Instead of monthly utility bill reconciliation, energy data becomes a continuous, asset-level, real-time signal that identifies exactly where, when, and why energy is being wasted and automatically adjusts the consuming assets to eliminate the waste without affecting production throughput or product quality. This article explains exactly how AI energy management delivers 15–30% energy cost reduction in FMCG plants across compressed air, steam, refrigeration, HVAC, and process heating systems.
Energy Management · FMCG Manufacturing 2026
AI Energy Management for FMCG: Cut Utility Costs 15–30% Without Touching Production
Compressed air leak detection · Steam trap monitoring · Refrigeration optimisation · HVAC scheduling · Process heat recovery · All managed in real time by iFactory with zero cloud dependency.
Energy cost reduction with AI-driven optimisation across FMCG plants
02
8–14%
Compressed air savings from AI leak detection and pressure optimisation alone
03
12–18%
Refrigeration and cooling energy reduction through dynamic setpoint control
04
4–7mo
Average payback period for AI energy management deployment in FMCG
Why Traditional Energy Management Fails in FMCG
Most FMCG plants today manage energy through monthly utility bill reviews and occasional energy audits conducted by external consultants. A typical energy audit identifies $500,000 in potential savings, delivers a 200-page report, and then the recommendations are implemented piecemeal over the following 18 months by which time the plant's production mix, equipment condition, and energy baselines have shifted. The fundamental problem is that energy consumption in an FMCG plant is not static it varies by product type (chocolate chip cookies consume 40% more oven energy than sugar cookies), by season (refrigeration loads increase 32% in summer), by line speed, by shift, and by equipment age. A monthly utility bill cannot capture this granularity. iFactory's AI models compute real-time energy baselines for each production line, each utility asset, and each product SKU detecting deviations that indicate waste and triggering corrective action at the machine level rather than the monthly meter level.
Energy-Consuming Systems — Where AI Drives the Largest Savings in FMCG
⏐
Real-time
Compressed Air
Leak detection·pressure·flow·kW
Utility PdM
☰
Real-time
Steam System
Trap health·pressure·condensate
Thermal PdM
❅
Real-time
Refrigeration
Evap/cond temp·COP·suction·discharge
Cooling PdM
⛭
Real-time
Process Heating
Oven temp·burner·exhaust·insulation
Oven PdM
⎔
Scheduled
HVAC
VAV·AHU·chiller·setpoint·CO₂
HVAC PdM
Five Energy Waste Categories iFactory Identifies and Eliminates
01
Compressed Air Leaks The Single Largest Source of Invisible Waste in FMCG
Compressed air is the most expensive utility in an FMCG plant generating 1 kW of pneumatic power requires 8–10 kW of electrical input at the compressor. A single 3mm orifice leak costs $2,500–$5,000 per year in wasted electricity. The average FMCG plant leaks 25–35% of its compressed air output. iFactory monitors compressor kW draw, system pressure, flow rate, and load/unload cycles. The AI model detects the signature of a leaking network — elevated base load during non-production hours, rapid pressure decay after compressor shutdown, and short cycling during low-demand periods. Each leak is localised by zone pressure monitoring and logged to Shift Logbook with an estimated annual cost and recommended repair priority. Book a Demo to see how iFactory's compressed air analytics identify individual leak locations and quantify savings by zone.
8–14% savingsLeak localisationBase load detection
02
Steam Trap Failures — Undetected Thermal Losses Costing $5,000–$12,000 Per Trap Per Year
A single failed-open steam trap can waste $5,000–$12,000 annually in natural gas. In an FMCG plant with 200–400 steam traps across process heating, CIP systems, and space heating, a 15% failure rate translates to $150,000–$500,000 in annual waste. iFactory monitors steam trap outlet temperature, upstream pressure, and condensate return flow. The AI model detects the temperature profile of a failed-open trap (continuously elevated downstream temperature) versus a failed-closed trap (cold downstream, condensate backing up) and generates a ranked repair list sorted by financial impact. Failed-closed traps that risk water hammer or process temperature loss are flagged with urgency regardless of cost.
Failed-open detectionRanked repair list$5K–$12K per trap
03
Refrigeration Over-Cooling Setpoint Drift That Compounds 24 Hours a Day
Refrigeration systems in FMCG plants are routinely running 2–5°C colder than the process requires — a phenomenon driven by operators setting temperatures conservatively to avoid quality complaints, gradual sensor drift that goes uncorrected, and control valve hysteresis that widens the dead band. Every 1°C of over-cooling increases refrigeration energy consumption by 8–12%. iFactory monitors evaporator temperature, condenser pressure, compressor power, suction superheat, discharge temperature, and space temperature. The AI model identifies the minimum stable operating temperature for each cold store, chiller, and blast freezer — dynamically adjusting setpoints within quality-safe boundaries to eliminate over-cooling while maintaining product integrity.
12–18% savingsDynamic setpointQuality-safe
04
Process Heating and Oven Efficiency Drift — The Silent Margin Killer in Food Manufacturing
Ovens, fryers, dryers, and heat exchangers in FMCG plants lose efficiency gradually over time — burner nozzle fouling, exhaust stack heat recovery degradation, insulation damage, and combustion air ratio drift. A 5% drop in thermal efficiency on a 10 MMBtu/hour oven costs $18,000–$25,000 per year at current natural gas prices. iFactory monitors oven zone temperature profiles, burner firing rate, exhaust oxygen content, flue gas temperature, and product outlet temperature. The AI model detects the efficiency degradation signature — increasing fuel consumption per tonne of product, wider temperature variation across zones, and higher flue gas losses — and recommends corrective actions before the efficiency loss compounds.
Combustion efficiencyFlue gas analysisContinuous monitoring
05
HVAC Scheduling Misalignment — Conditioning Empty Space 24/7
Production area HVAC systems are frequently operated on fixed schedules that bear no relationship to actual occupancy, production activity, or ambient conditions. A packaging hall conditioned to 22°C on a 5°C winter night, or a warehouse cooled to 12°C on a weekend when no product is present, represents pure energy waste. iFactory integrates HVAC zone temperature data, CO₂ sensors, production scheduling data from OEE Analytics, and ambient weather data to optimise HVAC scheduling — pre-conditioning production areas 30 minutes before shift start, relaxing setpoints during breaks and changeovers, and maintaining minimum setpoints only for areas with active product or occupancy.
Across compressed air, steam, refrigeration, process heat, and HVAC
8–14%
Compressed air savings from AI leak detection alone
Leak localisation and pressure optimisation
12–18%
Refrigeration energy reduction through dynamic setpoint control
Quality-safe temperature optimisation
4–7mo
Average payback period for AI energy management deployment
Immediate savings from Day 1 of pilot
How iFactory Turns Utility Data Into Energy Cost Reduction
iFactory is the AI software intelligence layer — not a sensor manufacturer or hardware vendor. The platform integrates with existing utility metering infrastructure, compressor controllers, steam trap monitoring systems, chiller plant controllers, oven and dryer PLCs, HVAC building management systems, and production data from OEE Analytics. The Shift Logbook captures energy lead operator shift reports, utility outage logs, and maintenance interventions alongside the sensor stream — creating a unified data fabric for energy model training across every consuming asset in your FMCG plant. The platform deploys on an on-premise NVIDIA appliance — zero cloud dependency, zero data egress costs, zero IT security review cycles.
Utility System
Data Sources
iFactory Energy Output
Cost Impact
Compressed Air
kW·pressure·flow·load cycle
Leak localisation·pressure optimisation
8–14% of compressed air spend
Steam System
Trap temp·pressure·condensate flow
Failed trap ranked list·repair priority
Eliminates $150K–$500K/year waste
Refrigeration
Evap temp·COP·suction·discharge
Dynamic setpoint·COP optimisation
12–18% of refrigeration spend
Process Heating
Zone temp·firing·O₂·flue gas
Efficiency trend·burner tuning alert
5–12% of process heat spend
Energy Management Use Cases in FMCG Manufacturing
Compressed Air
AI Compressed Air Leak Detection and Pressure Optimisation
Continuous
iFactory monitors compressor kW draw, system pressure, flow rate, and load/unload cycles. The AI model identifies the baseline parasitic load during non-production hours — the aggregate leakage rate. Zone pressure monitoring localises leaks to specific areas of the plant. Dynamic pressure optimisation adjusts compressor discharge pressure setpoint to the minimum level that satisfies the highest-demand application — reducing system pressure by 1 bar typically reduces energy consumption by 6–8%.
Steam Trap Health Monitoring and Thermal Loss Elimination
Continuous
iFactory monitors steam trap outlet temperature, upstream pressure, and condensate return flow. The AI model classifies each trap as functioning, failed-open, or failed-closed based on the temperature profile. Failed-open traps are ranked by estimated annual energy loss, enabling maintenance teams to address the highest-cost failures first. Failed-closed traps that risk water hammer or process disruption are flagged with urgency. If you'd like to see how steam trap health data flows into iFactory's asset dashboard and work order system, book a demo with our energy team.
Dynamic Setpoint Optimisation for Cold Stores and Chillers
Continuous
iFactory monitors evaporator temperature, condenser pressure, compressor power, suction superheat, discharge temperature, and space temperature. The AI model learns the minimum stable operating temperature for each cold store, chiller, and blast freezer — dynamically adjusting setpoints within quality-safe boundaries. For a beverage chilling plant operating 18 hours per day, a 2°C setpoint optimisation reduced refrigeration energy by 16% while maintaining product outlet temperature within specification.
WindowDynamic setpoint adjustment
AssetsCold stores·chillers·blast freezers
Process Heat
Oven and Dryer Thermal Efficiency Monitoring
Continuous
iFactory monitors oven zone temperature profiles, burner firing rate, exhaust oxygen content, flue gas temperature, and product outlet temperature. The AI model detects efficiency degradation — increasing fuel consumption per tonne, wider zone temperature variation, and higher flue gas losses. Alerts are generated for burner tuning, insulation repair, and heat recovery cleaning. For a snack food oven line, detecting a 7% efficiency drift early saved $42,000 in annual natural gas costs.
ParametersTemp·firing·O₂·flue gas·product temp
OutputEfficiency trend·tuning alert·work order
What iFactory Delivers for FMCG Energy Management
15–30%
Total energy cost reduction
AI-driven optimisation across all utility systems
4–7mo
Average payback period
Measurable savings from Day 1 of pilot deployment
80%
Reduction in energy audit cycle time
Continuous digital audit replaces annual consultant visit
96%
Energy action completion rate
Shift Logbook integration drives accountability for repairs
FAQ
iFactory integrates with existing utility metering infrastructure wherever possible — compressor controllers, steam trap monitors, chiller plant controllers, BMS systems, and production PLCs. If submetering is limited, the platform can operate with existing main meters and infer system-level consumption from equipment runtime and load data. Additional sensors are recommended for zone-level compressed air monitoring and steam trap temperature monitoring, but the deployment can begin with existing data sources and expand as savings are demonstrated. The platform deploys on an on-premise NVIDIA appliance — no cloud dependency, no data leaving your facility.
Initial deployment typically takes 6–10 weeks depending on data availability and integration scope. The platform requires 6–12 months of historical utility and production data to establish baselines and train energy models. If that data is available in your existing historians or utility management systems, initial models can be trained in under four weeks. Energy savings are measurable from Day 1 of the pilot — compressed air leak detection and steam trap monitoring generate immediate findings. The full 15–30% savings target is typically achieved within 4–7 months as all five energy domains are brought online and optimised.
iFactory energy management covers the full range of FMCG utility and process energy systems: compressed air systems (reciprocating, rotary screw, centrifugal), steam systems (boilers, distribution, traps, condensate return), refrigeration systems (ammonia, freon, glycol, CO₂), process heating (ovens, fryers, dryers, heat exchangers, pasteurisers), HVAC (air handling units, chillers, cooling towers, VAV boxes), and water/wastewater pumping. The platform integrates with PLCs, BMS controllers, meter data, and production scheduling systems via OPC UA, Modbus, BACnet, MQTT, and REST API.
All energy optimisation actions in iFactory are constrained by quality and safety boundaries that are configurable per asset and per product. For refrigeration setpoint optimisation, the AI model is constrained to operate within the temperature range specified in the HACCP plan — it cannot adjust setpoints beyond food-safe limits. For oven efficiency optimisation, the model maintains product outlet temperature within specification. These boundaries are auditable in the Shift Logbook and can only be modified by authorised personnel with quality assurance approval. The platform logs every setpoint adjustment, the rationale, and the quality outcome for full traceability.
Deploy iFactory for FMCG Energy Management and Cost Reduction
On-premise AI-powered energy management platform connecting compressed air, steam, refrigeration, process heating, and HVAC telemetry into one unified intelligence layer — with ML-based waste detection, Shift Logbook integration, work order automation, and plant-wide energy cost analytics. Zero cloud dependency. 4–7 month average payback.