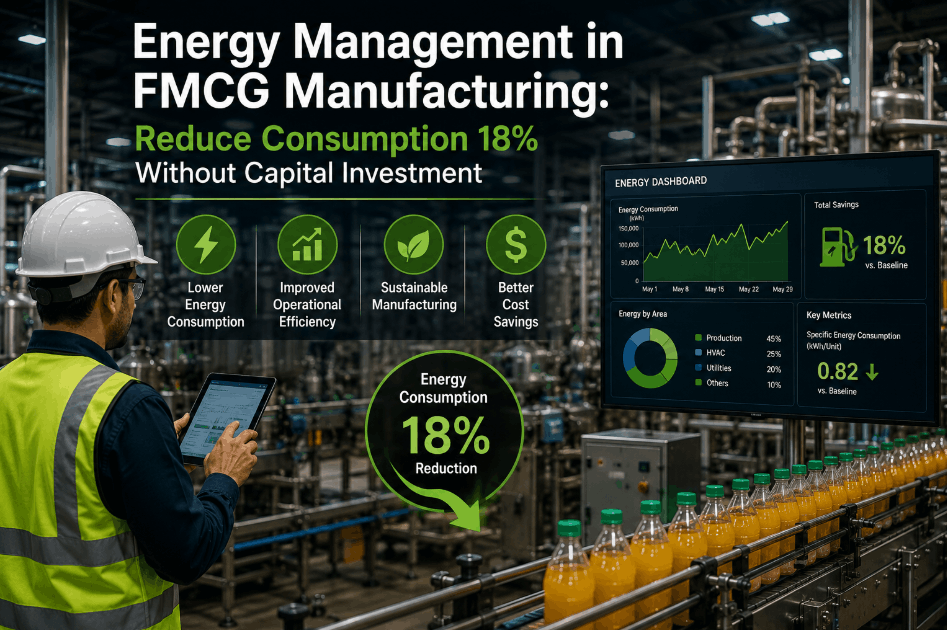
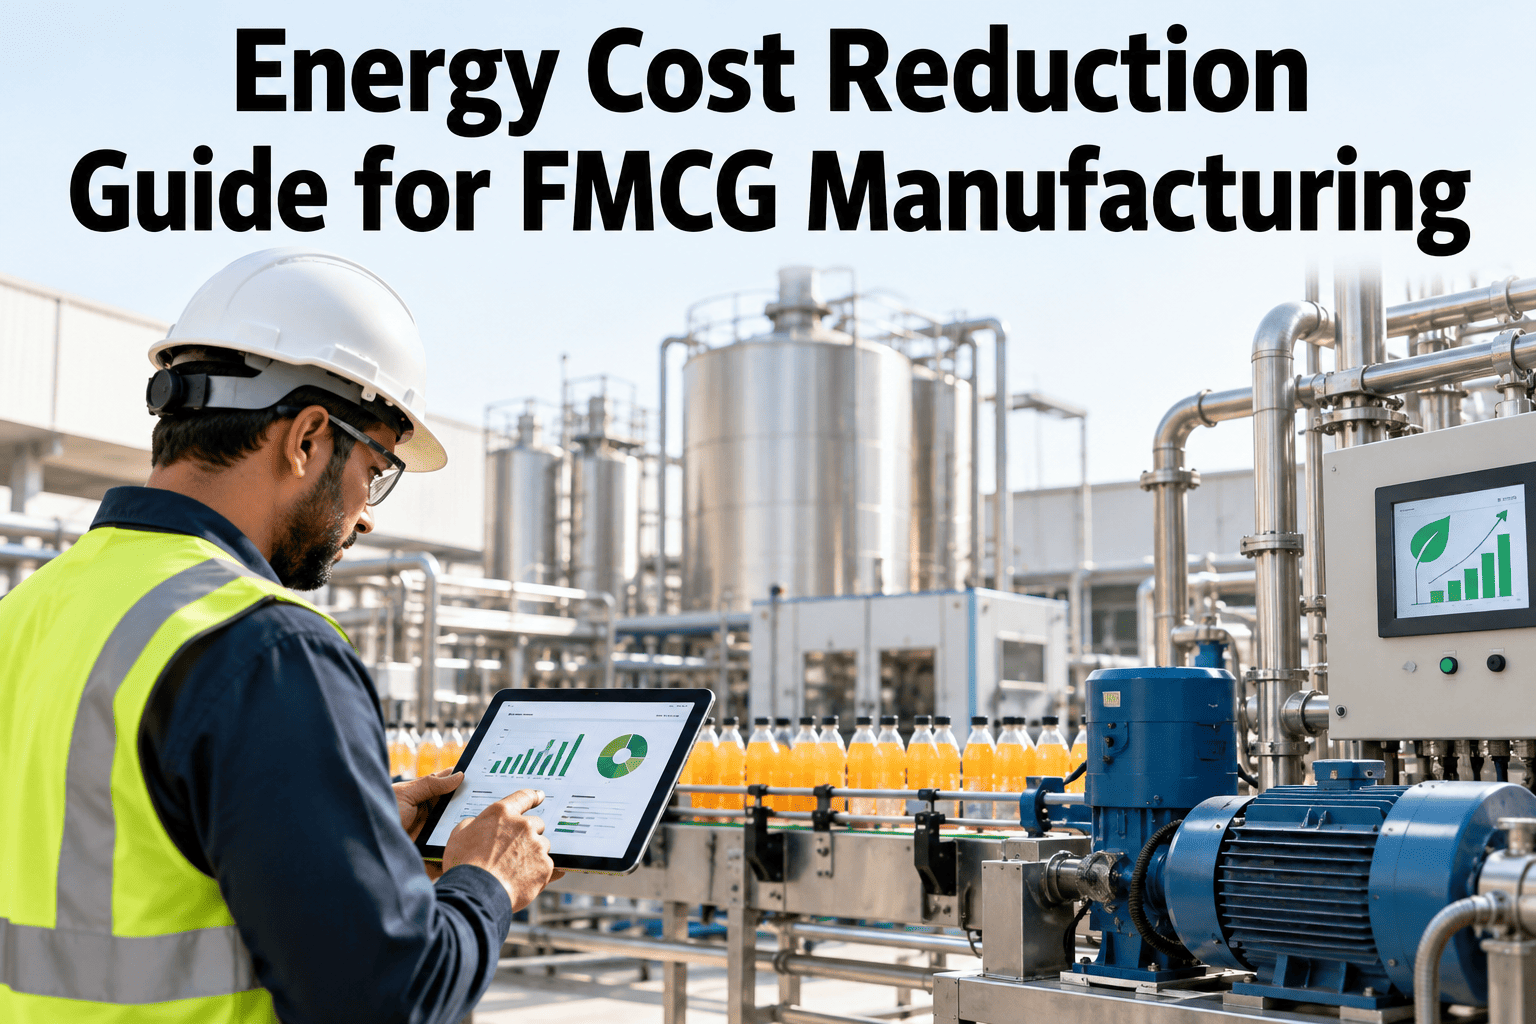
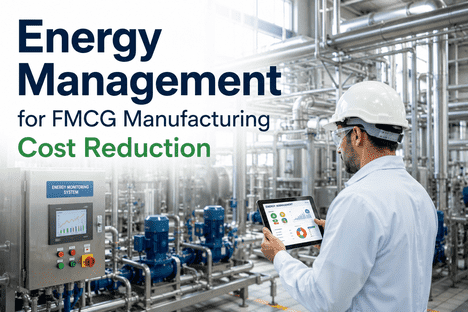
Energy costs represent 3–8% of total FMCG plant revenue — and most of that waste is invisible without real-time monitoring. The good news: a structured energy management program can cut consumption by 18% or more without a single capital project. Through analytics-driven optimization, LED conversions, compressed air audits, HVAC tuning, and motor efficiency upgrades, operations teams are recovering margin that bleeds silently every shift. To see how iFactory's energy monitoring module helps FMCG plants eliminate waste across every system, Book a Demo with our team today.
FMCG ENERGY MANAGEMENT · ANALYTICS-DRIVEN OPTIMIZATION
Cut Your FMCG Plant's Energy Bill by 18% — Without Capital Investment
Deploy intelligent energy monitoring and asset efficiency tracking across your FMCG production lines — with real-time dashboards, consumption alerts, and audit-ready reporting built in.
18%
Average energy reduction achievable in FMCG plants without capital expenditure
3–8%
Share of total FMCG plant revenue consumed by energy and utility costs annually
40–60%
Lighting energy savings achievable through LED conversion in FMCG facilities
12 Mo
Typical ROI period for analytics-driven energy optimization programs
Why FMCG Energy Management Demands a New Approach
Traditional energy management relied on monthly utility bills and annual audits — a reactive model that missed 60–70% of waste generated at the asset level. In FMCG plants, energy spikes during changeovers, peaks during CIP cycles, and bleeds through compressed air leaks and oversized motors. Real-time sub-metering tied to individual assets is the only reliable way to capture these savings. FMCG manufacturers who have moved to digital energy monitoring report that a single Book a Demo session reviewing live utility data is often the first moment they truly understand the scale of recoverable waste on-site.
Analytics-Driven Energy Optimization: The Foundation of Every 18% Reduction
Before any physical intervention, the critical first step is establishing a real-time consumption baseline at the asset level. Smart sub-meters on major circuits — motors, compressors, HVAC, process heating — expose three categories of waste immediately: load profile waste (idle assets drawing power), efficiency waste (assets consuming above design spec), and process waste (unoptimized production sequences). These three categories typically account for 10–14% of recoverable savings before a single piece of hardware is changed.
Load Profile
Monitoring Focus
Track idle-hours energy draw — above 15% of peak load signals standby issues
Map startup spikes — staggered motor starts cut peak demand charges 8–12%
Flag changeover anomalies — excess consumption during transitions reveals control gaps
Load profile analytics reveal 4–7% savings through scheduling and standby management alone
Asset Efficiency
Monitoring Focus
Monitor motor current vs. nameplate — overcurrent flags VSD candidates
Track compressor specific energy (kWh/m³) — rising values indicate wear or pressure drift
Measure refrigeration COP — degradation signals condenser fouling or refrigerant loss
Asset efficiency tracking catches gradual degradation invisible without continuous baselines
Process Intensity
Monitoring Focus
Calculate energy intensity per SKU — guides scheduling to minimize off-peak exposure
Measure CIP energy per cycle — excess steam or hot water use signals setpoint drift
Benchmark intensity vs. industry averages for equivalent product categories
Process intensity benchmarking sets realistic 18% reduction targets by system
Demand Management
Monitoring Focus
Analyze peak demand vs. tariff — load shifting is often the single highest-value intervention
Review power factor — poor PF incurs surcharges and raises distribution losses
Evaluate time-of-use exposure — reschedule energy-intensive CIP to off-peak windows
Demand management reviews identify 2–4% additional savings through tariff optimization
LED Conversion in FMCG Facilities: Fastest Path to Lighting Energy Savings
LED conversion delivers the most predictable returns of any FMCG energy initiative. Plants running 16–24 hours daily see 40–60% lighting energy reductions on a direct replacement basis. In a 50,000 m² facility, annual savings can exceed £200,000 — with 24–36 month payback even without subsidy. Adding occupancy controls and daylight harvesting extends savings further. FMCG energy managers can Book a Demo to access iFactory's lighting energy audit modeling tools for site-specific projections.
Primary
Replace metal halide high-bays with 150–200W LED equivalents at 60% lower wattage
Add-On
Daylight harvesting on perimeter zones adds 15–25% further reduction
Add-On
Occupancy switching in storerooms reduces output to 10% when unoccupied
Sub-meter lighting by zone — track kWh/production-hour weekly to verify sustained savings
Primary
Cold-rated LEDs deliver 50–70% savings over fluorescent in sub-zero conditions
Bonus
Lower heat output reduces refrigeration load — 1 kW lighting heat cut saves ~0.3 kW refrigeration
Add-On
Aisle-by-aisle motion activation ensures lights only run in occupied rack areas
Monitor compressor run-hours post-conversion — refrigeration saving visible within 30 days
Primary
40W LED panels replace 72W fluorescent fittings — 44% circuit load reduction per luminaire
Add-On
PIR sensors in meeting rooms and toilets eliminate run-time during unoccupied periods
Add-On
Dusk-dawn controlled external LEDs prevent 1–2 hours of nightly over-run
Non-production lighting is often 8–12% of site consumption — LED and controls reduce it rapidly
Primary
LED emergency fittings draw 1–3W maintained vs. 8–18W for fluorescent equivalents
Compliance
Addressable self-test systems log BS 5266 results automatically into CMMS
Tip
Combine emergency and general retrofit to share scaffolding — reduces project cost 15–20%
Maintained emergency lighting is a 24/7 load — LED replacement saves every hour of every day
HVAC Optimization: Balancing Compliance, Comfort, and Energy Cost
HVAC accounts for 20–35% of total FMCG facility energy — and most systems are over-engineered for peak loads they rarely reach. Variable speed drives on AHU fans cut fan energy 30–60% by matching airflow to actual demand. Raising cooling setpoints 1°C in non-critical zones reduces chiller energy ~3% per degree. Combined with exhaust heat recovery, HVAC optimization alone can deliver 5–8% of the total 18% reduction target.
Motor Efficiency Upgrades: The Largest Single Energy Consumer in FMCG Plants
Electric motors account for 60–70% of total electrical consumption in FMCG manufacturing. Three avoidable inefficiencies drive most waste: oversized motors at partial load, fixed-speed motors throttling variable-flow systems, and legacy IE1/IE2 motors never upgraded to IE3 or IE4. A motor audit targeting assets above 7.5 kW running below 60% rated load identifies every VSD, right-sizing, and replacement opportunity on-site.
01
Variable Speed Drive Retrofit
VSDs on pumps, fans, and conveyors cut energy 30–50% on variable-load circuits. Motors above 15 kW running 4,000+ hrs/year typically achieve 12–24 month payback.
02
IE3 / IE4 Motor Replacement
Upgrading end-of-life IE1/IE2 motors reduces losses 15–25%. Priority targets are continuously running motors above 75% load where every efficiency point counts.
03
Motor Right-Sizing Program
Motors sized 20–40% above actual load waste energy through elevated iron losses. Correct sizing cuts consumption 5–10% on affected assets with no other changes needed.
04
Soft Starter Optimization
Where full VSD is not justified, soft starters eliminate inrush peaks. Staggered start programs reduce peak demand 8–15%, directly lowering tariff demand charges.
05
Continuous Motor Monitoring
Sub-metering motors above 7.5 kW creates baselines that detect efficiency loss from bearing wear or winding degradation before energy waste becomes significant.
06
Power Factor Correction
FMCG plants often run at 0.75–0.85 PF, incurring utility surcharges. Capacitor bank installation to reach 0.95 PF reduces apparent power consumption 3–5%.
Compressed Air Energy Reduction: The Most Wasteful FMCG Utility
Only 10–15% of electrical energy input to a compressor reaches the point of use as productive work. FMCG plants lose 20–30% of output to leaks, run systems 1–2 bar above actual need, and regularly use compressed air for tasks better served by blowers or vacuum systems. Addressing leaks, pressure, and inappropriate use together typically delivers 25–35% reduction in compressed air system energy — one of the fastest-returning interventions in any FMCG energy program.
| Loss Type |
Root Cause |
Energy Impact |
Remediation |
| Distribution Leaks |
Aged fittings, unsealed couplings, worn valve stems across unaudited pipework |
20–30% of compressor output wasted — costs £15,000–£40,000/year in a typical plant |
Ultrasonic leak survey and systematic repair — target less than 5% distribution loss post-audit |
| Excessive System Pressure |
Set-point raised over time to compensate for leaks — systems run at 8–9 bar when 6.5 bar suffices |
Each 1 bar excess raises compressor energy ~5% and increases leak flow proportionally |
Pressure mapping to establish minimum adequate pressure — reduce in 0.1 bar steps while monitoring end-use |
| Inappropriate Air Use |
Compressed air used for blow-off and conveying where low-pressure blowers would suffice |
Applications using 3+ bar where 0.5–1 bar suffices — 3–8x energy intensity vs. dedicated blowers |
Application audit to replace with blowers or vacuum generators where feasible |
| Compressor Off-Load Running |
Fixed-speed compressors cycling at partial load — off-load units still consume 15–35% of full-load power |
75 kW compressor off-load 30% of shift wastes 25,000–60,000 kWh/year unproductively |
Add a trim VSD compressor to handle load variation — eliminates off-load running at part-load |
Robotic Energy Optimization in FMCG Packaging Lines
Robots in FMCG packaging and palletizing are commissioned for throughput, not energy efficiency. Motion profile optimization, low-power standby configuration, regenerative drive systems, and electrical gripper substitution for pneumatic tooling can cut robot energy consumption 12–18% through software and configuration changes alone — no hardware replacement needed. FMCG operations leaders can Book a Demo to see how iFactory measures energy per robot, per line, and per SKU across multi-robot packaging environments.
FMCG Energy Audit Methodology: Building the Business Case
A structured energy audit provides the baseline, ranked opportunity list, and financial justification needed to secure budget approval. The four-phase process — utility data analysis, site sub-metering walkdown, opportunity modeling, and implementation roadmap — front-loads no-cost and low-cost interventions before any capital spend is required. Plants with live energy monitoring already in place compress the audit window from weeks to days.
ISO 50001: Compliance as a Competitive Advantage in FMCG
ISO 50001 certification is increasingly required by major FMCG retailers as a sustainability supply chain prerequisite. The standard's Plan-Do-Check-Act framework requires a validated energy baseline, measurable improvement targets, and continuous monitoring — exactly what a digital energy monitoring platform delivers automatically. Most FMCG plants achieve certification within 12–18 months; those with real-time sub-metering already live compress that by 3–6 months.
Frequently Asked Questions: FMCG Energy Management
How can FMCG plants reduce energy consumption by 18% without capital investment?
The 18% target is achieved through no-cost behavioral changes — setpoint optimization, standby management, staggered motor starts — combined with low-cost fixes like compressed air leak repairs and HVAC controls tuning. Plants with real-time sub-metering typically identify 8–12% savings within the first 90 days before any physical change is made.
What is the biggest energy consumer in a typical FMCG manufacturing plant?
Electric motors account for 60–70% of total electrical consumption — with compressed air and refrigeration compressors typically the largest individual assets within that load. HVAC systems represent the second-largest category at 20–35% of site consumption.
What is the ROI on LED conversion in an FMCG manufacturing facility?
Full LED conversion in a 24-hour FMCG plant typically achieves 24–36 month payback without subsidy, compressing to 12–18 months with available government schemes. Cold store areas add an indirect refrigeration saving worth 15–20% on top of the direct lighting reduction.
How does compressed air leak detection work in FMCG plants?
Ultrasonic detectors identify the high-frequency signature of pressurized air escaping through fittings and valve stems — a technician can survey a full compressed air network in one shift. Most unaudited plants find 15–25 leak points with cumulative losses of 15–30% of compressor output.
What data does an FMCG energy management platform need to deliver real savings?
At minimum: asset-level sub-meter data, production output to calculate energy intensity per unit, and machine status to separate productive from idle consumption. These three streams enable anomaly alerts, efficiency KPIs, and automated work orders that drive action rather than just reporting.
How long does ISO 50001 certification take in an FMCG facility?
Most FMCG plants achieve certification within 12–18 months of starting implementation. Plants with real-time energy monitoring already live can compress this by 3–6 months, as the validated baseline data is immediately available rather than requiring a full measurement year first.
iFactory CMMS · FMCG Energy Monitoring
Start Reducing FMCG Energy Costs in 30 Days — No Capital Required
iFactory sub-meters individual assets, lines, and utility systems — delivering real-time consumption data, efficiency benchmarks, and automated alerts that make 18% energy reduction achievable from day one.