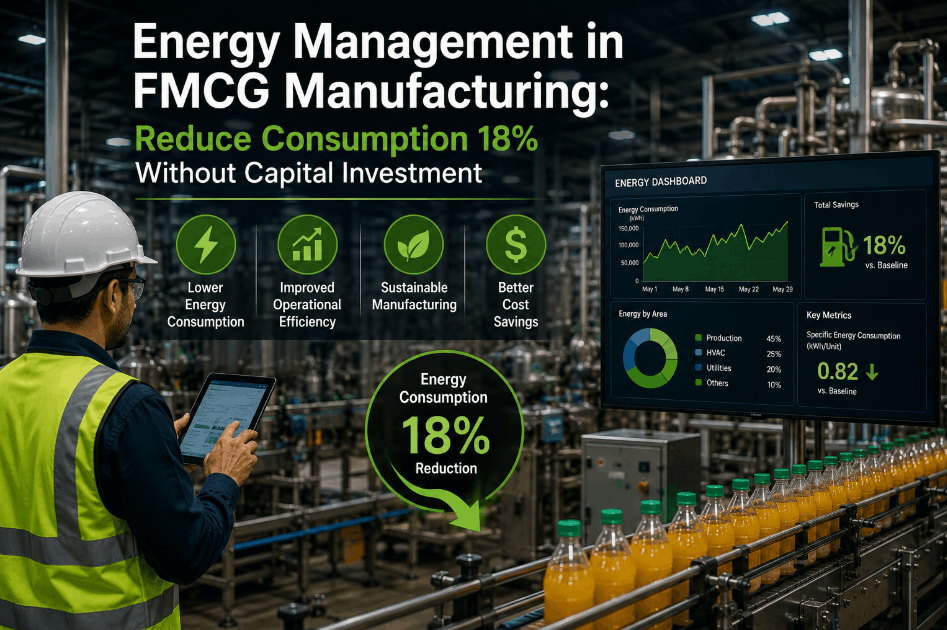
Energy is one of the few costs in an FMCG plant that keeps running when the lines stop. Compressors idle, chillers cycle, lights burn over empty floors and fans spin in half-loaded rooms. Most of that waste is found by measuring where the kilowatt-hours go, then fixing the biggest loads first. Plants that want this view can ask iFactory AI how energy data is tied to cost per unit.
Energy Cost Reduction Guide for FMCG Manufacturing
Rank your loads, fix compressed air, refrigeration, motors and lighting in order of payback, then shift what you can to cheaper hours. iFactory AI links each kWh saved to cost per case.
Start With Where the kWh Go
You cannot cut what you cannot see. Split the annual bill by end use before choosing any project, because the largest block deserves the first look. The plant below is illustrative, at 12 million kWh a year and an assumed 0.10 per kWh.
Sub-meter the big loads
A main meter shows the total only. Sub-meters on compressors, chillers and big drives show which end use is moving.
Look at the night profile
Consumption when lines are idle is pure waste. A high overnight base load points to leaks, idle machines and lights left on.
Normalise by output
Track kWh per case or per tonne, not just kWh. A busy month always uses more energy, which says nothing about efficiency.
Compressed Air: The Most Expensive Utility
Compressed air is convenient and costly. DOE material cited by Reliable Media puts overall efficiency as low as 10 to 15 percent, so most of the electricity becomes heat. A 1 hp air motor at 100 psig needs roughly 7 to 8 hp of electrical input.
| Measure | Basis | Illustrative kWh Saved | Effort |
|---|---|---|---|
| Leak survey and repair | 10% of system energy, within the DOE range of 10 to 15% | 168,000 | Low |
| Cut discharge pressure by 10 psi | About 1% per 2 psi gives roughly 5% | 84,000 | Low |
| Turn off air to idle machines | Auto shut-off valves on non-running lines | Counted in leak work | Low |
| Total compressed air | About 15% of the 1.68 million kWh block | 252,000 | Low to medium |
The same source notes that well-maintained systems hold leakage below 10 percent. Most of the core figures date from DOE work in 1997 to 2004, so treat them as established baselines and confirm with a measurement on your own system, such as a no-load leak test.
Refrigeration: Big Load, Many Small Wins
Cold storage and chilled lines run all year, so even small percentage gains add up. Energy Trust of Oregon material reports refrigeration upgrades cutting energy use by as much as 30 percent or more, with floating head pressure control saving three to ten percent during cooler months.
Compressors and condensers
Floating head pressure lets condensing pressure follow the weather. Variable-speed condenser fans match air flow to the load.
Evaporators, doors and defrost
Efficient evaporator fan motors use about half the power of standard ones. Faster doors, strip curtains and demand defrost cut heat gain.
| Measure | Basis | Illustrative kWh Saved | Effort |
|---|---|---|---|
| Floating head pressure | 5% of the 3.6 million kWh block | 180,000 | Medium |
| Efficient evaporator fan motors | Fans at 8% of the block, power halved | 144,000 | Medium |
| Door discipline and defrost control | About 2% of the block | 72,000 | Low |
| Total refrigeration | About 11% of the block | 396,000 | Medium |
Find Your Biggest kWh Savings First
Book a 30-minute session and iFactory AI will show how energy by end use, kWh per case and savings by project fit in one view on realistic FMCG data.
Motors and Drives: Match Speed to Need
Fans, pumps and conveyors often run at full speed while the process needs less. Variable speed drives slow them down, and because power varies steeply with speed on fans and pumps, a modest slowdown saves a lot.
In the sample plant, drives on variable loads save about 4 percent of the 3.36 million kWh motor block, or 134,400 kWh. Premium motors on replacement add 1.5 percent, or 50,400 kWh. Together that is 184,800 kWh, about 5.5 percent of the block.
Lighting and Ventilation: Quick, Visible Wins
Lighting is a smaller block, but it is easy to fix and the payback is clear. LED fittings with occupancy and daylight controls cut both energy and maintenance visits.
LED retrofit
Replacing older high-bay lamps with LED often halves lighting power. In the sample plant that saves 360,000 kWh, half of the 720,000 kWh block.
Smart controls
Sensors and zoned switching turn lights off in empty stores, corridors and warehouses. They also protect gains over time.
Ventilation schedules
Setback schedules for unused areas save about 5 percent of the 1.2 million kWh block, or 60,000 kWh, in this illustration.
Load Shifting: Same kWh, Lower Cost
Load shifting does not cut kilowatt-hours. It moves flexible loads to cheaper hours, which cuts the bill and eases peak demand. The strip below shows an illustrative three-band tariff.
| Flexible Load | How to Shift | Limit | Main Check |
|---|---|---|---|
| Cold store pre-cooling | Cool deeper off-peak, coast through peak | Product temperature | Food safety limits hold |
| Compressed air storage | Fill receivers before peak | Receiver volume | Pressure stays stable |
| Batch heating and mixing | Start earlier or later in the shift plan | Production schedule | No new bottleneck |
| Water treatment and pumping | Run into storage tanks off-peak | Tank capacity | Supply stays assured |
| Battery charging for trucks | Charge overnight only | Shift pattern | Fleet is ready on time |
Shifting 900,000 kWh a year from the peak band at 0.14 to the off-peak band at 0.08 saves 0.06 per kWh, or 54,000 a year, with no change in total consumption. Check your own tariff, since bands and demand charges differ widely by region.
Add It Up: The Savings Stack
Collecting the measures above gives a single plan. The bars show illustrative annual kWh saved for each block, scaled to the largest.
Measures interact. Fixing air leaks reduces compressor load, which changes the value of a drive upgrade on the same compressor. Count each saving once and re-measure after each project, instead of simply adding the estimates.
Turn kWh Into Margin per Case
Finance cares about margin, not kilowatt-hours. Convert energy into cost per case, by line and product, and the effect on margin becomes visible.
| Measure | Before | After Savings | Change |
|---|---|---|---|
| Annual output | 8 million cases | 8 million cases | None |
| Electricity used | 12.00 million kWh | 10.75 million kWh | Down 10.4% |
| kWh per case | 1.50 | 1.34 | Down 0.16 |
| Energy cost per case | 0.150 | 0.128 | Down 0.022 |
A saving of about 0.022 per case looks tiny, but across 8 million cases it is the same 179,280 shown above. Reported per case, it can be compared directly with price rises, ingredient costs and other margin levers.
By line
Compare lines running the same product. Large gaps often point to leaks, idle running or poor settings.
By product
Energy cost differs by recipe, temperature and run length. Include it in product margin reviews.
By shift
Compare shifts on the same line. Behaviour differences show up quickly in kWh per case.
Proving the Savings Are Real
A project has not saved anything until the meter agrees. Set a baseline, apply the measure and compare using the same rules.
Mistakes That Keep Energy Costs High
Most programmes stall for the same few reasons. Each has a simple remedy.
A 90-Day Energy Plan
iFactory AI is built as a turnkey server that racks in, plugs in and goes live in roughly 6 to 12 weeks, so a first set of savings can be underway within a quarter.
What iFactory AI Adds
iFactory AI is smart manufacturing and industrial software. Its Cost Reduction Platform and Margin Analytics features support this work.
Maintenance and Energy: Two Sides of One Problem
Equipment that is worn, dirty or out of adjustment uses more energy for the same output. Many of the best energy savings come straight from the maintenance plan.
| Maintenance Task | Energy Effect | Check | Typical Owner |
|---|---|---|---|
| Clean condenser coils | Lower condensing pressure and compressor load | Head pressure trend | Refrigeration technician |
| Replace air filters and dryers on schedule | Less pressure loss in compressed air | Differential pressure | Utilities team |
| Fix door seals and strip curtains | Less heat entering cold rooms | Door open time and room temperature | Warehouse supervisor |
| Lubricate and align drives | Lower friction losses | Motor current at fixed load | Mechanical team |
| Repair steam and hot water leaks | Less fuel burned for heat | Boiler fuel per unit of output | Utilities team |
Link the two plans. When a work order closes on a condenser clean, the energy dashboard should show the head pressure fall. If it does not, the job was incomplete or the cause lies elsewhere.
Demand Charges and the Tariff Behind the Bill
Many industrial bills charge for the highest short-term demand as well as for total energy. One brief spike when several large loads start together can set the charge for the whole month.
Pays for kWh used
Falls when you use less energy or move it to cheaper hours. Efficiency projects and load shifting both act here.
Pays for the peak kW
Falls when large loads are staggered. Soft starts, delayed restarts and sequencing keep the peak low.
Stagger start-ups
After a shutdown, restart compressors, chillers and big drives in sequence rather than all at once.
Watch the interval peak
Track demand against the limit in real time, and alert operators before it is crossed.
Review the contract
Check tariff class, power factor penalties and notice periods. A better-fitting tariff can save money without any project.
Shift Routines That Save Energy Every Day
Much of the saving comes from habits, not equipment. Simple routines at shift change cost nothing and add up over a year.
How to Rank Projects by Payback
With a list of measures in hand, rank them by simple payback and by risk. The aim is to fund the next project from the savings of the last.
| Project | Illustrative Cost | Annual Saving | Simple Payback |
|---|---|---|---|
| Compressed air leak repair and pressure trim | 12,000 | 25,200 | About 6 months |
| Door, defrost and set-point fixes | 6,000 | 7,200 | About 10 months |
| Floating head pressure controls | 30,000 | 18,000 | About 20 months |
| LED lighting retrofit | 90,000 | 36,000 | About 30 months |
| Variable speed drives on fans and pumps | 60,000 | 13,440 | About 54 months |
All costs and savings here are illustrative and use the sample plant at 0.10 per kWh. Rank on your own quotes and add maintenance savings and incentives where they apply. A longer payback may still be right when the equipment is due for replacement anyway.
Plain-Language Glossary
Shared words keep energy meetings short.
Frequently Asked Questions
Where should an FMCG plant start with energy savings?
Split the bill by end use and measure the night base load. Then fix the largest low-effort items first, usually compressed air leaks and refrigeration settings.
How much can leak repair save?
DOE material cited here reports 10 to 15 percent of compressed air system energy in many cases. Ask support how to measure your own leak rate and set a target.
Does load shifting reduce kWh?
No. It moves consumption to cheaper hours, which lowers the bill and eases peak demand. Efficiency measures are what reduce kWh.
How do we prove a project saved energy?
Compare actual use with a baseline that adjusts for output and weather. Keep tracking afterwards, since savings can fade.
What data do we need to begin?
Main meter and sub-meter readings, production counts, tariff details and ambient temperature. Interval data at 15 minutes or less is ideal.
Cut Energy Cost Without Cutting Output
iFactory AI ranks your loads, tracks each saving and shows energy cost per case beside your other margin levers. Book a walkthrough on your own plant data.