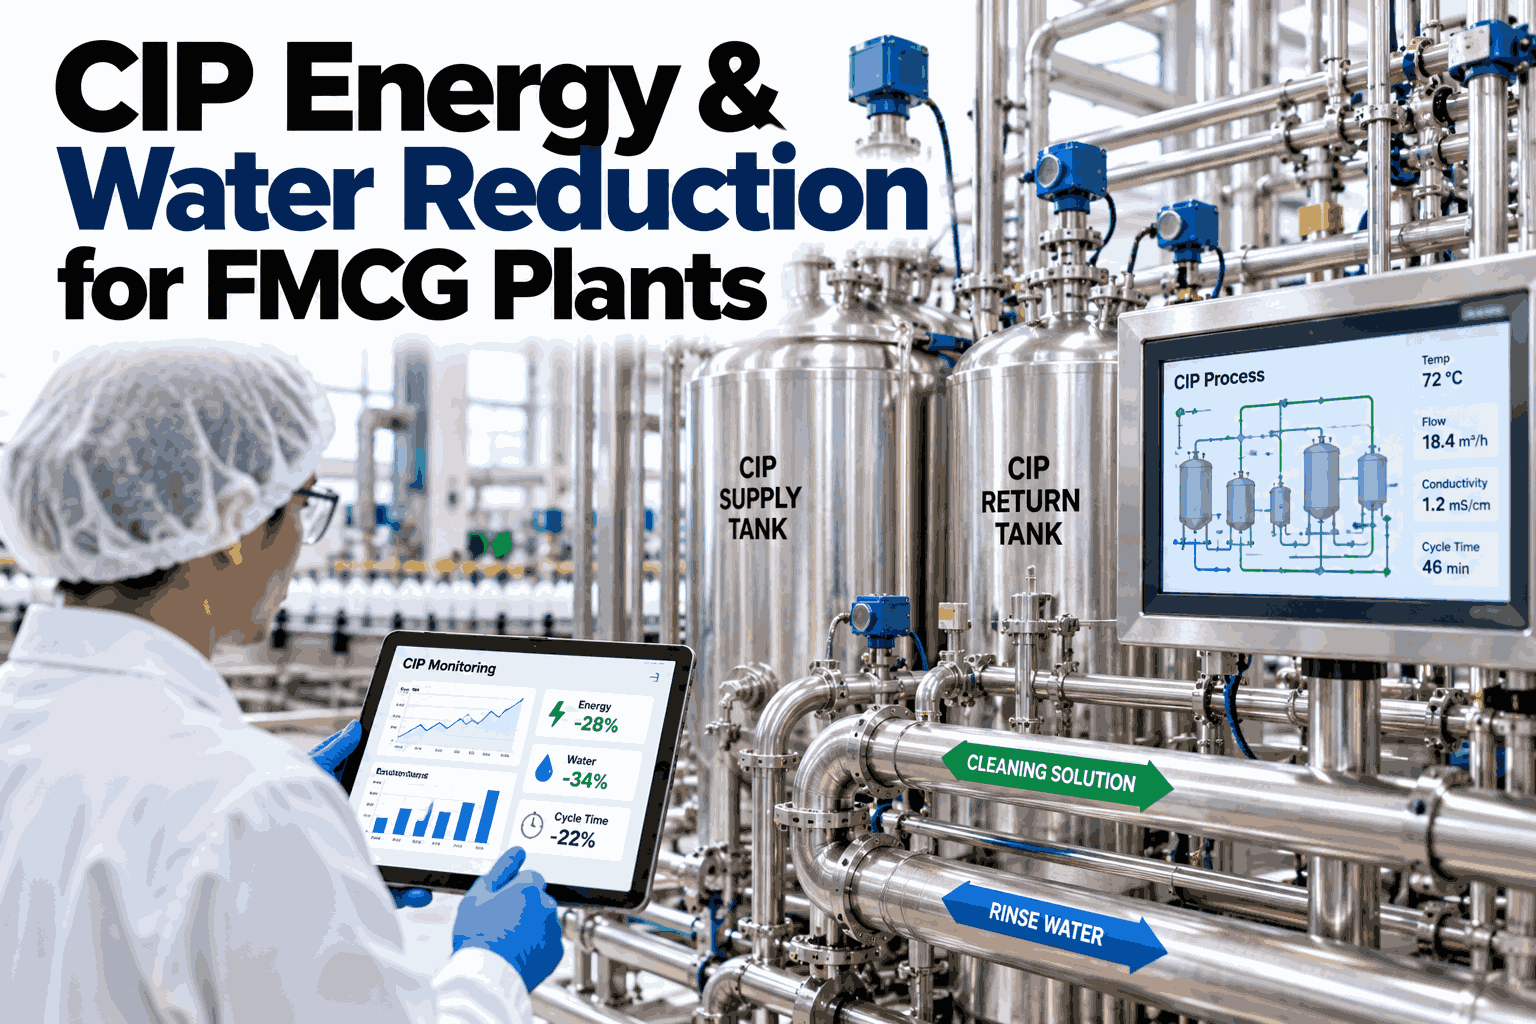
Most CIP optimization conversations treat energy and water as a side-effect of getting chemical, time, and temperature right. That framing misses two of the largest levers entirely: heat recovered from the return line instead of dumped to drain, and rinse water reclaimed instead of run once and lost. A milk plant can spend roughly 13% of its total energy on CIP alone, and almost half of some dairy facilities' energy goes toward cleaning lines and equipment. Plants ready to see their own CIP energy and water use broken down by phase can book a demo of iFactory AI's CIP sub-metering on their own utility data.
CIP Energy and Water Metered by Phase, Not Estimated by Cycle
iFactory AI sub-meters CIP energy and water consumption phase by phase, surfacing heat-recovery and rinse-recovery opportunities that chemical and temperature tuning alone never touch.
CIP Is a Bigger Utility Line Than Most Plants Realize
Cleaning isn't a background cost sitting quietly behind production. On many lines it's one of the largest single draws on both the energy bill and the water bill, and most plants have never measured it directly.
Two Levers Most CIP Programs Never Touch
Chemical dosing, contact time, and temperature control get most of the attention in CIP optimization work. Two other levers routinely go untouched because they require energy and water to be metered, not just the cleaning chemistry.
Heat recovery from return lines
Hot caustic and final-rinse water typically go straight to drain at full temperature instead of preheating the next cycle's supply water.
Rinse-water reclaim
Final rinse water is usually clean enough to reuse as the next cycle's pre-rinse, but without flow-and-quality metering it's indistinguishable from dirty wash water.
Find Your Plant's Heat-Recovery Opportunity
iFactory AI can show how much return-line heat your CIP cycles are currently sending to drain. Book a demo to see it on your own sub-metering data.
Why These Two Levers Get Skipped
Heat recovery and rinse reclaim aren't ignored because they don't work. They're ignored because sizing either one correctly requires data most CIP systems were never built to capture.
A CIP Cycle Has Five Distinct Utility Profiles
A single "kWh per cycle" number hides which phase is actually driving the cost. Each phase of a standard CIP cycle has a different energy and water signature.
| Phase | Typical utility draw | Where the savings usually hide |
|---|---|---|
| Pre-rinse | High water volume, low heating energy | Reclaimed final rinse from the prior cycle can often replace fresh water here |
| Caustic wash | High heating energy, moderate water | Return-line heat recovery and tighter temperature staging |
| Intermediate rinse | Moderate water, low energy | Conductivity-based endpoint cutoff instead of a fixed timer |
| Acid wash | Moderate heating energy, lower water | Shorter contact time where soil load allows it, verified by return-line sensor |
| Final rinse | High water volume, low energy | Reclaim for the next cycle's pre-rinse rather than draining it |
Measured, Not Estimated
A plant-wide utility bill allocated by rule of thumb and a CIP system sub-metered at the skid level produce very different answers to the same question.
What Changes Once Utility Cost Shows Up on the CIP Dashboard
Most CIP dashboards show cycle time, chemical dosing, and pass/fail verification. Few show cost in the same view — and that absence shapes which problems actually get prioritized.
Temperature Staging, Grounded in a Real Relationship
The energy cost of a CIP cycle scales with temperature in a fairly direct way — which means even small, well-verified reductions in a fixed setpoint compound across every cycle run that week.
See Where Your Temperature Setpoints Have Room to Move
iFactory AI can show which CIP phases are running hotter than their verification data actually requires. Book a 30-minute walkthrough on your own cycle data.
Rinse Water: Reused, Not Just Reduced
Cutting rinse volume outright risks sanitation outcomes. Reclaiming already-clean rinse water for the next cycle's pre-rinse cuts consumption without touching the rinse the current cycle actually needs.
What the Business Case Actually Needs to Show
A heat-recovery or rinse-reclaim project competes with other capital requests. The business case holds up better with sourced inputs than with a borrowed industry percentage.
Who Uses This Data Day to Day
Phase-level CIP utility data isn't a one-report tool. Different roles pull different value from the same underlying metering.
Getting Started Without Re-Metering Every Line at Once
Instrumenting every CIP skid plant-wide on day one is rarely the fastest path to a result. A staged rollout gets a usable baseline sooner.
A Composite Illustration: The Caustic Line Nobody Had Measured
This is an illustrative composite, not a specific named plant, built to show what phase-level metering tends to surface.
Where iFactory AI Fits
Finding heat-recovery and rinse-reclaim opportunities needs energy and water metered at the phase level, not estimated from a plant-wide bill. iFactory AI builds that metering directly into the CIP system.
Phase-Level Sub-Metering
kWh and liters logged per CIP phase, per cycle, per line — not a single blended average.
Heat-Recovery Sizing
Return-line temperature data sized directly against a specific recovery project, not a generic estimate.
Rinse-Reclaim Automation
Conductivity-verified rinse water automatically routed for reuse, with any out-of-spec batch sent to drain.
Utility Cost Dashboard
CIP energy and water cost broken out by line and phase, trended against production volume over time.
Turnkey AI, Live in 6-12 Weeks
iFactory AI ships as a complete hardware-and-software bundle — a pre-configured NVIDIA AI server, racked and ready, with software pre-loaded. Rack it, plug in power and Ethernet, and the AI is live. iFactory's team handles cabling, network setup, PLC/SCADA integration, operator training, and 24x7 remote monitoring.
Expert Review
This page's benchmarks and the heat-recovery/rinse-reclaim framework were reviewed for accuracy against published CIP energy and water research before publication.
Frequently Asked Questions
Is rinse-water reclaim safe for food-grade sanitation?
Reclaim is designed around a conductivity-verification step — only rinse water confirmed clean below the cleaning-verification threshold is eligible, and it's routed to the next cycle's pre-rinse rather than the sanitation-critical final rinse. Any reading outside spec sends that batch to drain automatically rather than leaving the decision to manual judgment, which keeps the practice defensible in a sanitation audit.
How is this different from the chemical, time, and temperature optimization most CIP software focuses on?
Chemical, contact-time, and temperature tuning treats energy and water as side effects of getting the cleaning chemistry right. This approach meters energy and water directly, phase by phase, and targets the two levers that chemistry tuning never touches on its own: recovering heat from the return line instead of sending it to drain, and reclaiming already-clean rinse water instead of running it once and losing it. Book a demo to see both approaches side by side on your own data.
Which CIP phase usually offers the biggest energy-saving opportunity?
It varies by plant, which is exactly why phase-level metering matters more than an industry average. The caustic wash phase, which carries the highest heating-energy demand, is frequently the largest single contributor — but the only way to know for a specific plant is to measure it, not assume it based on a published range.
How much energy does a 1°C reduction in CIP temperature actually save?
Published reference figures put it at roughly a 1/60th reduction in the energy needed to heat the cleaning fluid for each 1°C removed from the setpoint, under typical caustic/acid/ambient temperature assumptions. That's a small change per cycle, but it compounds across every CIP run on every line, every day — which is why even a verified, modest setpoint reduction tends to be one of the more durable wins available.
What's the fastest way to start sizing a heat-recovery or reclaim project?
Start with phase-level sub-metering on the one or two lines already suspected of running the hottest or using the most water, build a real baseline across a few weeks of normal cycles, then size the recovery or reclaim project against that measured data rather than a borrowed industry percentage. Book a 30-minute session and iFactory AI's team can help scope that baseline on your own lines.
Meter Your CIP Energy and Water by Phase
iFactory AI sub-meters every CIP phase so heat-recovery and rinse-reclaim projects can be sized against real data, not a borrowed percentage. Book a demo on your own utility bill.