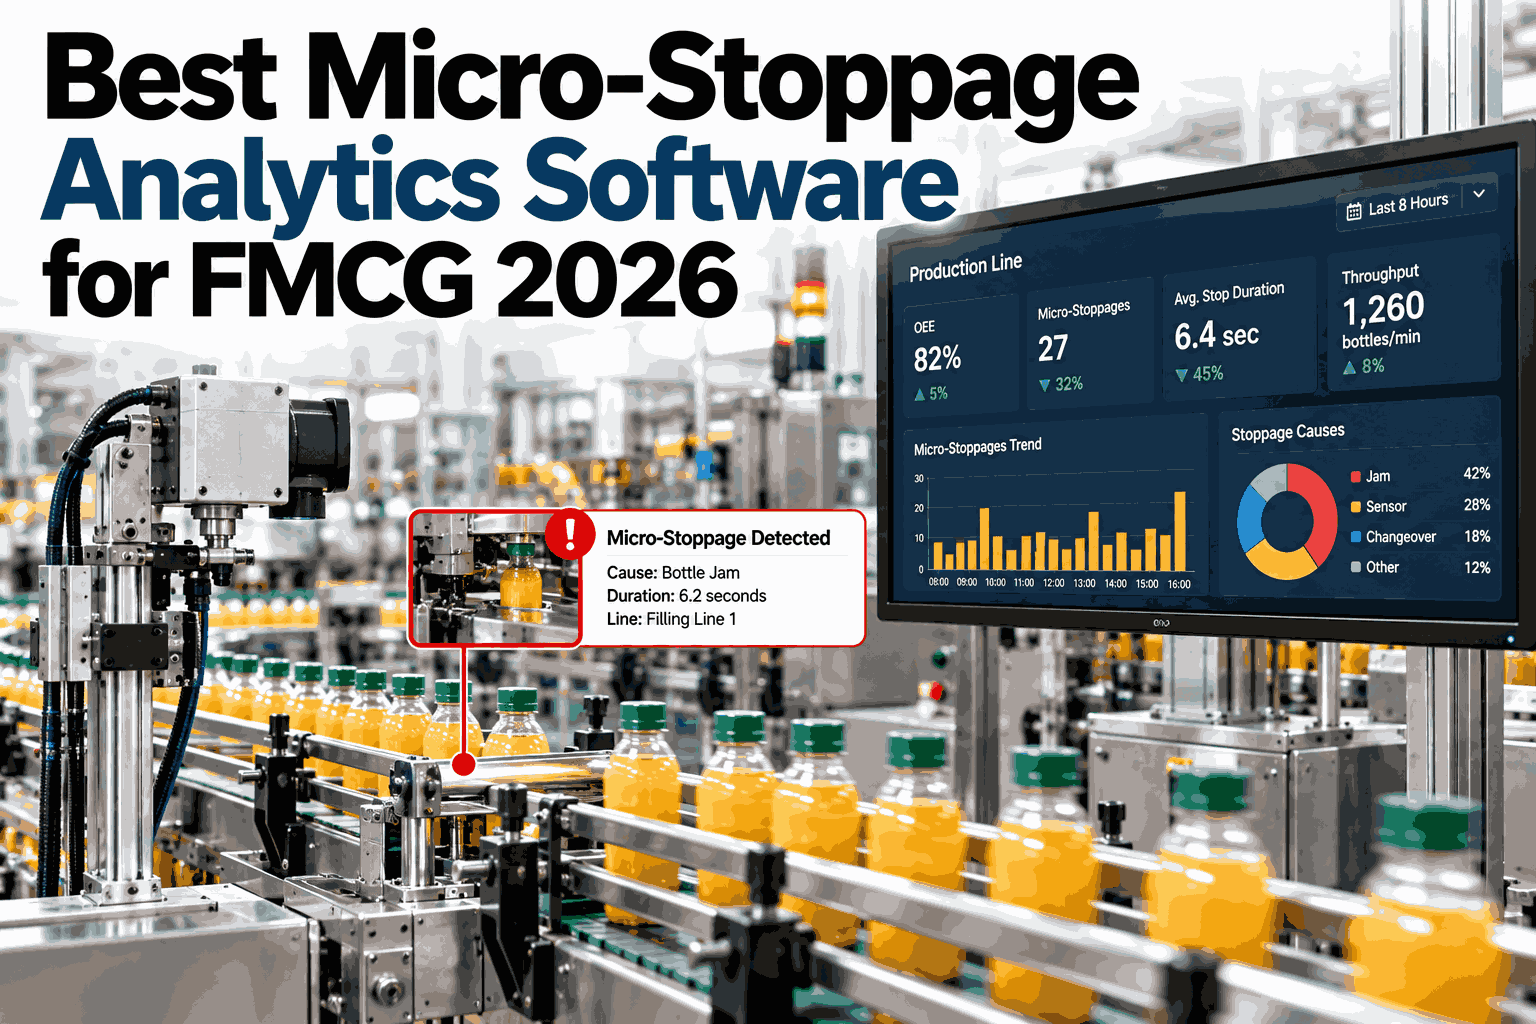
Most FMCG plants track the downtime that shows up on a shift report, the thirty-minute jam or the hour-long changeover overrun. What rarely gets tracked is the forty-second stop that happens eleven times in a shift, the kind that never triggers an incident log but adds up to more lost output than the one big stoppage everyone remembers. Micro-stoppage analytics software exists to catch exactly that gap, capturing every sub-minute stop straight from PLC data and surfacing the pattern behind it before it becomes a full line failure. Before comparing platforms for 2026, it helps to see what a real PLC data feed looks like with the iFactory AI team.
The Best Micro-Stoppage Analytics Software Catches What Shift Reports Miss
iFactory AI pulls sub-60-second stops directly from PLC signals, clusters them by cause, and ranks which micro-stoppage is quietly costing the most output across your FMCG lines.
The Stop Type Most Reports Never Show
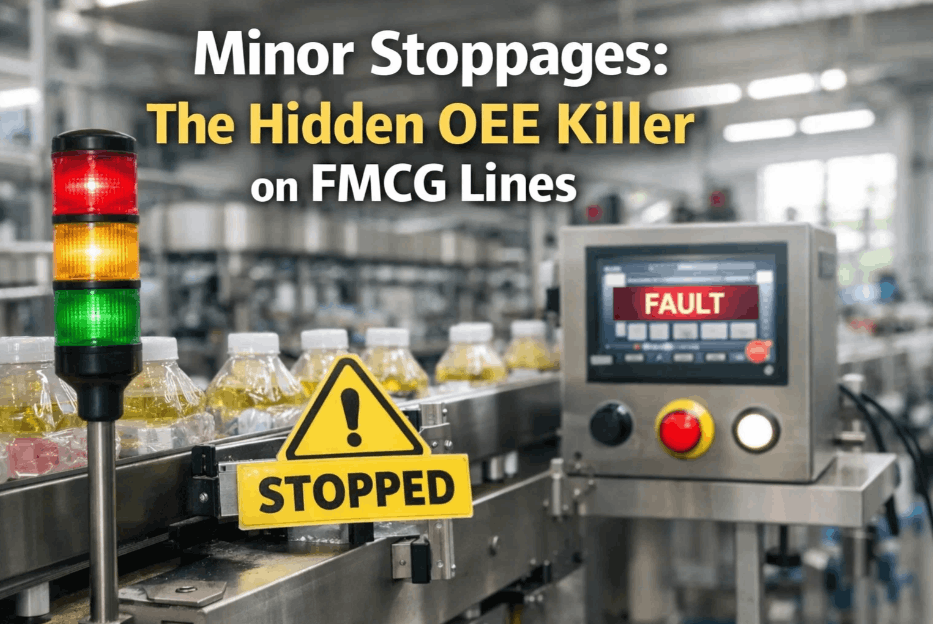
A plant can run a clean monthly OEE review and still be bleeding output, because micro-stoppages hide below the threshold most reporting tools even bother logging.
Each micro-stop looks trivial alone. Clustered together, they frequently outweigh the plant's largest single downtime event of the month.
Where the Minor-Stop Threshold Actually Sits
Not every short stop is a micro-stoppage in the analytical sense. The category that matters is the one too brief to log manually but frequent enough to matter in aggregate.
| Stop Duration | Common Label | Usually Logged Manually | Analytics Priority |
|---|---|---|---|
| Under 60 seconds | Micro-stoppage | Rarely | Highest, hardest to see without software |
| 1 to 5 minutes | Minor stop | Sometimes | High, often undercounted |
| 5 to 30 minutes | Short downtime | Usually | Moderate, already visible in most reports |
| Over 30 minutes | Major downtime | Always | Low priority for pattern tools, already investigated manually |
The software that matters most for 2026 is the one built for the top two rows of this table, not the bottom two that every MES already captures.
What Separates a Strong 2026 Platform From a Basic Downtime Logger
Plenty of tools will show a downtime chart. Fewer will show which forty-second stop is the one worth fixing first.
Basic Downtime Logger
Micro-Stoppage Analytics Platform
The difference shows up fastest on the lines that already look stable, where the losses are too small per event for anyone to notice on their own.
Find Out Which Micro-Stop Is Costing You the Most
Book a 30-minute session and see iFactory AI cluster live PLC stop data from a line like yours into ranked causes.
How Pattern Surfacing Works, Step by Step
Turning thousands of tiny stops into one clear priority list happens in a consistent sequence, not a single dashboard refresh.
Capture Every Signal Event
PLC and sensor data streams in continuously, and any stop above a near-zero threshold is logged with its exact duration and timestamp.
Cluster Similar Stops
Stops sharing a signal source, a time pattern, or a location on the line get grouped together rather than treated as isolated events.
Rank by Total Minutes Lost
Clusters are ranked by cumulative impact, so a frequent ten-second stop can outrank a rare five-minute one on the priority list.
Point to a Likely Root Cause
The signal pattern behind the top cluster, such as a specific sensor or station, gets surfaced so maintenance knows where to look first.
Teams can walk through this sequence against their own PLC tags before committing to a rollout.
Integration Depth Matters More Than the Dashboard
A micro-stoppage tool is only as good as the signal it reads. A platform that polls data every few minutes will never catch a forty-second stop.
A Composite Scenario: One Packaging Line, Four Weeks
A beverage packaging line looked stable on its monthly OEE report. The figures below are an illustrative composite, shown as a relative index with the starting point set at 100.
The top-ranked cluster turned out to be a single misaligned guide rail generating a fifteen-second jam roughly every nine minutes, invisible to any report that only logged stops over a minute.
Buyer's Checklist for 2026
Use this list when comparing platforms rather than relying on a feature slide.
Frequently Asked Questions
What makes a stoppage count as a micro-stoppage?
Definitions vary, but most plants treat anything under roughly sixty seconds as a micro-stoppage, the kind too brief to log manually but frequent enough to matter when totaled across a shift. iFactory AI captures these directly from PLC signals rather than waiting for a manual entry.
Does this replace our existing MES or OEE dashboard?
No. It sits alongside existing systems and feeds ranked micro-stop causes into them, filling the gap most MES tools leave below their logging threshold. Ask how it connects to your current MES setup.
How fast does the signal polling need to be?
Polling needs to resolve events measured in seconds, since anything slower will average short stops away entirely. The exact interval depends on the PLC and line, which is worth reviewing before rollout.
Can it work across multiple plants, not just one line?
Yes. Clusters and rankings can roll up across lines and sites, which is often how a recurring component or supplier issue gets spotted, since no single line shows the full pattern on its own.
How long does a rollout usually take?
A pilot on one line is typically the fastest way to validate the signal connection and see a first ranked cause list before expanding further. Plan a pilot line walkthrough in a 30-minute call.
See Your Own Micro-Stop Pattern Ranked
iFactory AI captures sub-60-second stops from PLC data and ranks the causes costing the most minutes. Book a walkthrough using data from one of your own lines.