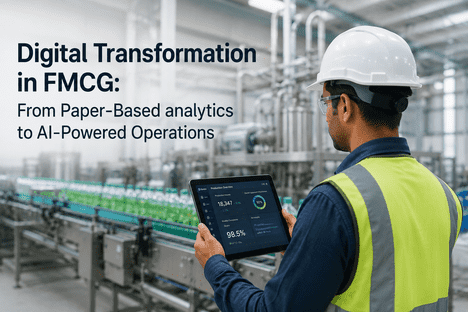
Digital Transformation in FMCG: From Paper-Based analytics to AI-Powered Operations
By Seren on June 15, 2026
The average FMCG plant still runs critical operations on paper. Shift handovers are documented in notebooks that never get analysed. Quality checks are recorded on clipboards and filed in cabinets. Work orders are printed, assigned manually, and closed with handwritten notes that may or may not make it back to the system. Maintenance histories live in the heads of the most experienced technicians, not in a database that can be queried. Production logs are transcribed from whiteboards into spreadsheets at the end of every shift, introducing latency, transcription errors, and a structural gap between what happened on the line and what the plant manager sees on the report. Digital transformation in FMCG is not about installing the latest technology for its own sake — it is about closing the gap between the speed at which the plant operates and the speed at which the management system can read it. This guide maps the journey from paper-based operations to AI-powered manufacturing, showing how FMCG plants move through four maturity stages and what each stage delivers in measurable operational performance.
Paperless Shift Logs · Digital Work Orders · Real-Time Quality · AI-Driven Production Scheduling · Automated Compliance
FMCG Plants That Go from Paper to AI Don't Just Modernise — They Unlock 15-25% Productivity Gains Hidden in Manual Processes.
iFactory's Mobile AI-driven & Paperless Operations platform digitises every layer of FMCG manufacturing — shift logs, work orders, quality checks, production tracking, and compliance documentation — with mobile-first design and AI-powered analytics that turn operational data into real-time decisions.
Productivity improvement reported by FMCG plants that replace paper-based shift logs, quality checks, and work orders with mobile-first digital operations platforms
80%
Reduction in shift handover time when paper notebooks are replaced by structured digital shift logbooks with searchable history and automated handover reports
4 hrs
Per week saved by plant managers when automated analytics reports replace manual data compilation from whiteboards, clipboards, and spreadsheets
50-70%
Reduction in quality documentation errors when paper-based quality checks are replaced by mobile digital forms with mandatory fields, timestamps, and photo capture
The Four Stages of FMCG Digital Transformation — and What Each Stage Delivers
Digital transformation in FMCG manufacturing is not a single project with a fixed endpoint. It is a staged journey that moves the plant through four maturity levels — from paper-dependent operations to AI-powered autonomous decision-making. Each stage builds on the previous one and delivers measurable operational improvements that fund the next stage. The plants that succeed at digital transformation are the ones that treat each stage as a value-delivery milestone rather than an infrastructure project.
Stage 01
Paper to Digital — Mobile-First Data Capture
Replace paper logs, clipboards, and whiteboards with mobile forms and digital records
The foundational stage of digital transformation replaces every paper-based workflow with a mobile-first digital equivalent. Shift logbooks move from notebooks to structured digital logs with configurable fields, mandatory data entry, and automatic timestamping. Quality checks move from clipboards to mobile forms with photo capture, signature fields, and real-time validation. Work orders move from printed paper to mobile assignments with digital close-out. Production counts move from whiteboard tallies to direct digital entry. The key design principle at this stage is that the digital version must be faster and easier than the paper version — otherwise operators will default back to paper. iFactory's mobile platform is designed for one-thumb operation on the plant floor, with voice-to-text, barcode scanning, and offline capability for areas with limited network coverage. The output of Stage 1 is a complete digital record of every operational event — shift activities, quality results, maintenance actions, production counts — available for analysis without manual data entry or transcription.
Mobile-first data capture
Offline-capable operation
Real-time validation
Stage 02
Connected Operations — Real-Time Dashboards and Automated Workflows
Connect digital data sources into live dashboards with automated alerts and cross-functional workflows
Once operational data is captured digitally, the second stage connects previously siloed data sources into a unified operations view. Shift log data, quality results, work order status, and production counts flow into live dashboards that give plant managers real-time visibility into OEE, quality performance, maintenance backlog, and shift productivity — without waiting for end-of-shift reports. Automated workflows trigger cross-functional actions: when a quality check fails, a digital alert notifies the production supervisor and the quality manager simultaneously; when a work order is overdue, the system escalates to the maintenance manager. At this stage, the plant operates with a real-time digital nervous system — every event is captured, every status is visible, and every escalation follows an automated path. The output of Stage 2 is the elimination of information latency: the time between an event occurring on the plant floor and that event being visible to the management team drops from hours or days to seconds.
Real-time unified dashboard
Automated cross-functional alerts
Eliminated information latency
Stage 03
Predictive Analytics — AI-Driven Insight and Forecasting
Apply machine learning to operational data for scrap forecasting, anomaly detection, and predictive maintenance
With a connected digital operations platform generating structured historical data, Stage 3 introduces AI-powered analytics that extract predictive insight from the data the plant already produces. The quality module identifies multi-parameter drift patterns that precede scrap events and generates forecasts hours before the spec limit is breached. The maintenance module analyses work order history and sensor data to predict equipment failures before they occur. The production module forecasts OEE trends based on current operating parameters and recommends adjustments to improve throughput. At this stage, the plant shifts from reactive operations — responding to events after they occur — to predictive operations where the system alerts the team to risks before they materialise. The output of Stage 3 is a measurable reduction in unplanned downtime, scrap, and quality deviations driven by machine learning models that improve continuously as more data accumulates.
ML-powered scrap forecasting
Predictive maintenance alerts
OEE trend forecasting
Stage 04
AI-Powered Autonomous Operations — Closed-Loop Decision Making
Enable AI to recommend and execute operational adjustments in closed-loop mode
The highest maturity stage integrates AI recommendations directly into operational control loops. When the predictive model identifies an emerging quality drift, the system adjusts the relevant process parameter automatically — reducing the conveyor speed, adjusting the dryer temperature, or modifying the filling pressure — within a configured safe operating envelope. When the maintenance model predicts a bearing failure within the next 72 hours, the system generates a work order, reserves the spare part, and schedules the repair during the next planned changeover — all without human intervention. At this stage, the plant operates autonomously for routine decisions, with human operators focused on exceptions, continuous improvement, and strategic interventions. The output of Stage 4 is a self-optimising plant that continuously adjusts its operating parameters to maximise throughput, minimise scrap, and reduce energy consumption — driven by AI models that learn from every production cycle.
Closed-loop process control
Auto-generated work orders
Continuous self-optimisation
Where Paper-Based Operations Hide the Biggest Productivity Losses
The cost of paper-based operations in FMCG manufacturing is not the cost of paper and printers. It is the cost of information that moves slower than the production process it is meant to document. iFactory's analysis of plants transitioning from paper to digital operations consistently identifies six categories of hidden productivity loss that paper-based systems create — each one eliminated when the plant moves to mobile-first digital operations.
1
Shift Handover Information Loss
Paper shift logs are written at the end of the shift when the operator needs to go home. Critical details are abbreviated or omitted. The incoming shift spends the first 15-30 minutes decoding the previous shift's notes. iFactory's digital shift logbook structures the handover with mandatory fields, categorised entries, and automatic escalation of unresolved issues — reducing handover time by 80% and eliminating information loss between shifts.
2
Quality Data Transcription Errors
Quality checks recorded on paper and transcribed to spreadsheets introduce an average of 3-5% transcription error rate — meaning 3-5% of quality records contain incorrect data. When those records drive SPC calculations, batch release decisions, and audit documentation, the error propagates through every downstream process. Digital quality forms eliminate transcription entirely through direct mobile entry with mandatory fields and real-time validation.
3
Work Order and Maintenance Blind Spots
Paper work orders create a structural blind spot in maintenance operations — the time between the work order being assigned and the work order being closed is invisible. Managers do not know whether the technician is travelling, waiting for parts, or performing the repair. iFactory's mobile work orders with status tracking and time stamps eliminate this blind spot, enabling real-time visibility into wrench time, MTTR, and first-time fix rate.
4
Production Count Discrepancies
Production counts recorded on whiteboards and transcribed to spreadsheets create a persistent gap between actual production and reported production. Discrepancies of 2-5% between line counts and inventory system counts are common in paper-dependent plants. Digital production logging with direct data entry and automated reconciliation eliminates these discrepancies and provides accurate OEE calculations.
5
Compliance Documentation Gaps
ISO 9001, FSSC 22000, and regulatory audits require documented evidence of quality checks, maintenance activities, and production processes. Paper-based systems create audit risk through missing records, illegible entries, and incomplete documentation. iFactory's digital platform generates audit-ready records automatically — every action is timestamped, attributed, and stored in a searchable archive that can be exported for any date range at a single click.
6
Management Report Compilation Time
Plant managers in paper-dependent FMCG plants spend 3-5 hours per week compiling data from shift logs, quality records, and maintenance reports into weekly summaries. By the time the report is ready, the data is 3-5 days old. iFactory's automated analytics dashboards eliminate report compilation entirely — every metric is calculated in real time from live data, and scheduled reports are delivered automatically to stakeholders.
Digital Shift Logs · Mobile Quality Checks · Real-Time OEE · Automated Compliance
Six Categories of Hidden Productivity Loss That Paper-Based FMCG Operations Create Every Shift — and One Platform That Eliminates All Six.
iFactory's Mobile AI-driven & Paperless Operations platform digitises every FMCG operational workflow — from shift handover to quality checks, work orders to compliance reports — with mobile-first design and automated analytics that make every operator's data visible to every decision-maker in real time.
What the Digital Operations Dashboard Shows the Plant Manager
The iFactory digital operations dashboard is designed for the plant manager who needs visibility into every operational layer — shift activity, quality performance, maintenance status, and production output — in a single unified view that refreshes in real time as data is entered on the plant floor.
Ops View 01
Live Shift Activity Feed With Cross-Shift History
Every shift event — production start and stop, quality check result, maintenance intervention, safety incident — is logged in real time as operators enter data on mobile devices. The feed is filterable by line, shift team, and event type. Plant managers see what is happening across every production line without leaving the office. Cross-shift history enables comparison of current shift performance against previous shifts for the same line and product SKU.
Plant manager action: Monitor live feed during shift transitions — address cross-shift issues before they escalate.
Ops View 02
OEE, Quality, and Maintenance Scorecard
A consolidated scorecard showing OEE with availability, performance, and quality breakdown; quality metrics including first-pass yield, scrap rate, and Cpk; and maintenance metrics including MTBF, MTTR, PM compliance, and work order backlog. Each metric is calculated automatically from live data — no manual data compilation required. Scorecard filters allow viewing by line, shift, product SKU, and time period.
Plant manager action: Review scorecard at shift start — identify the highest-priority issue for the coming shift.
Ops View 03
Open Alerts and Escalation Feed
A live feed of all open alerts — quality deviations, overdue work orders, PM compliance gaps, safety incidents — with severity classification, responsible person, time since creation, and escalation status. Alerts that exceed their configured response time are automatically escalated to the next management level, ensuring that critical issues are never buried in the shift log.
Plant manager action: Review open alerts at start of day — confirm escalation paths are functioning and critical issues are assigned.
Ops View 04
Compliance Documentation Centre
All quality, maintenance, and production records stored in a searchable digital archive with configurable retention policies. Records are categorised by type, tagged with metadata, and available for export in PDF or Excel format for any date range. Audit preparation time drops from days to minutes — select the date range, click export, and the complete evidence package is ready for the auditor.
Plant manager action: Export audit documentation on demand — no manual compilation or file hunting needed.
Ops View 05
Analytics and Trend Reports
Scheduled and on-demand reports covering OEE trends, quality performance, maintenance KPIs, and production output. Reports are generated automatically from live data and delivered via email or available in the dashboard. Plant managers can create custom report templates for weekly management reviews, monthly board reports, and quarterly business reviews — each report pulls the latest data without any manual intervention.
Plant manager action: Schedule weekly automated reports for management team — eliminate report compilation time permanently.
Ops View 06
AI Predictive Insights Feed
AI-generated insights surfaced from the operational data stream — scrap risk forecasts, maintenance predictions, OEE improvement recommendations, and anomaly alerts. Each insight includes the confidence level, the contributing data points, and a recommended action. Plant managers can accept the recommendation to generate a work order or quality alert, dismiss it with a reason, or escalate it for further investigation.
Plant manager action: Review AI insights daily — accept recommendations to drive continuous improvement without manual analysis.
"
We were running a $150M FMCG facility on paper shift logs, clipboard quality checks, and end-of-shift spreadsheet data entry. I knew we had data quality problems, but I did not realise how deep they ran until we digitised. The first month after deploying iFactory's mobile platform, we discovered that our real OEE was 8 points lower than what the spreadsheets had been reporting — because the paper system was systematically under-reporting downtime. Operators were recording line stops as "minor delays" that did not count against OEE, when they should have been recorded as unplanned downtime. The digital platform made every event visible and categorised correctly. We fixed the data quality issue, started measuring accurately, and within six months the real OEE had exceeded the old reported number because the visibility drove improvement. The shift handover time dropped from 25 minutes to 5 minutes. The quality documentation error rate went to zero. The plant manager stopped spending Friday afternoons compiling the weekly report. The ROI was undeniable in the first quarter.
The Implementation Pathway — From Digitisation Pilot to Full AI-Powered Operations
Successful FMCG digital transformations follow a consistent pattern: start with a high-impact pilot, deliver measurable value in 60-90 days, expand to the full facility, and then layer AI capabilities on top of the digital foundation. The implementation pathway is designed to deliver value at every stage so that each phase funds the next.
PHASE 1 — WEEKS 1-4
Pilot Deployment on One Production Line
Select one production line with a motivated shift team. Deploy mobile shift logs, digital quality checks, and electronic work orders. Provide hands-on training for operators and supervisors. The pilot runs for 4 weeks with daily feedback loops. At the end of the pilot, the plant has a documented comparison of paper vs. digital performance data on the same line — the baseline for the business case for expansion.
Deliverable: Documented pilot results with baseline comparison data for management review.
PHASE 2 — WEEKS 5-10
Full Facility Rollout With Dashboards
Extend the digital platform to all production lines, quality stations, and maintenance teams. Deploy live dashboards for plant managers and supervisors. Configure automated alerts, escalation workflows, and scheduled reports. The entire facility operates on a common digital platform with real-time visibility across all operational layers. All paper-based workflows are decommissioned.
Deliverable: Fully digital facility with live dashboards and zero paper-based operational workflows.
PHASE 3 — MONTH 3+
AI Layer Activation — Predictive Analytics and Automation
With 3+ months of structured digital data from every operational layer, activate the AI analytics modules. Machine learning models train on the digital data to generate scrap forecasts, maintenance predictions, and OEE optimisation recommendations. Configure closed-loop automation for approved use cases. The plant transitions from digital visibility to AI-powered decision support.
Deliverable: AI-powered predictive insights driving operational decisions with measurable impact on OEE and scrap reduction.
Conclusion
The FMCG plants that lead their markets in 2026 and beyond will not be the ones with the newest packaging lines or the largest automation budgets. They will be the ones that closed the gap between the speed of production and the speed of information — the plants where every shift event is captured digitally as it happens, every quality result is visible in real time, every maintenance action is tracked from assignment to close-out, and every management decision is informed by AI-powered insights derived from the plant's own operational data.
The journey from paper-based to AI-powered operations follows a proven pathway: digitise the data capture layer first, connect the data into real-time dashboards and automated workflows second, then layer predictive AI analytics on top of the digital foundation. Each stage delivers measurable value — reduced shift handover time, eliminated transcription errors, real-time OEE visibility, and automated compliance documentation — that funds the next stage of the journey.
iFactory's Mobile AI-driven & Paperless Operations platform is designed for FMCG plants at every stage of the digital transformation journey — from the first paperless shift log to fully AI-powered operations. Book a Demo to see the platform configured for your plant's specific workflows, or talk to an expert about a free digital operations maturity assessment for your FMCG manufacturing operation.
Frequently Asked Questions
Operator adoption is the single most important success factor in digital transformation, and it is driven by three design principles. First, the mobile interface must be faster and easier than paper — iFactory's platform is designed for one-thumb operation with large buttons, voice-to-text input, barcode scanning for asset and material identification, and offline capability so operators are never blocked by network connectivity. Second, operators must see the value within their shift — the digital shift log eliminates the end-of-shift handover scramble, the mobile quality form eliminates re-entering data that was already recorded on paper, and the digital work order eliminates the trip back to the office to submit paperwork. Third, the implementation must start with a pilot on one line with a motivated shift team — operators on that line become internal champions who demonstrate the benefits to their peers. Most plants achieve full operator adoption within 4 to 6 weeks of pilot deployment. Talk to an expert about operator adoption strategies specific to your plant's shift culture.
Yes. iFactory's platform connects to existing ERP systems — including SAP, Oracle, Microsoft Dynamics, and Epicor — through standard API connectors, web services, and file-based integration. Production counts, quality results, and work order status captured on the mobile platform flow automatically to the ERP without manual data entry. Integration with existing MES and SCADA systems follows the same approach through OPC-UA, Modbus, and MQTT protocols. The platform is designed as a complement to existing enterprise systems — it captures the operational data at the plant floor level that ERP and MES systems need but cannot capture directly from paper-based workflows. Most integrations are configured during the Phase 1 pilot and expanded during the Phase 2 rollout. Book a Demo to see integration architecture configured for your specific ERP and control system environment.
Every action performed on the iFactory platform is automatically logged with a timestamp, a user identity, and the complete record of the action — the quality check result, the work order completion note, the shift log entry. Records are stored in a searchable, tamper-evident digital archive with configurable retention policies that align with your regulatory requirements. For audit preparation, the platform generates a complete evidence package for any date range with a single export click — covering quality records, maintenance histories, shift logs, training records, and corrective action documentation. The export includes the metadata that auditors require: who performed each action, when it was performed, what equipment was involved, and what the result was. Audit preparation time drops from days to minutes, and the risk of missing records is eliminated because every action is captured automatically. Talk to an expert about configuring compliance documentation for your specific certification standards.
A Stage 1 pilot on one production line typically takes 4 weeks from kickoff to go-live. The timeline includes: week 1 — platform configuration and mobile device setup; week 2 — operator training and pilot line deployment; weeks 3-4 — live operation with daily feedback and adjustments. The pilot covers digital shift logs, digital quality checks, and electronic work orders on the selected line. The cost is structured as a fixed-fee pilot package that includes platform configuration, mobile device provision, operator training, and implementation support. Most plants recover the pilot investment within the first 90 days through measurable improvements in shift handover efficiency, quality documentation accuracy, and OEE visibility. After pilot validation, expansion to additional lines follows a per-line deployment model with volume-based pricing. Book a Demo to discuss pilot scope and pricing for your specific plant configuration.
Your Plant Already Produces the Data That Drives AI-Powered Operations. The Only Missing Step Is Digitising the Capture Layer. Start With a One-Line Pilot and See the Difference in 30 Days.
iFactory's Mobile AI-driven & Paperless Operations platform for FMCG manufacturing — replaces paper shift logs, clipboard quality checks, and manual spreadsheets with mobile-first digital capture, real-time dashboards, automated compliance documentation, and AI-powered predictive analytics that turn operational data into production decisions.