FMCG companies operating multiple production facilities face a structural disadvantage that single-site competitors do not: every plant develops its own analytics practices, its own maintenance workflows, its own KPI definitions, and its own continuous improvement cadence — and these local optimisations, however effective individually, prevent the enterprise from aggregating performance data, comparing plant-level efficiency, and propagating best practices across the network. The consequence is measurable. Multi-site FMCG operators that have not standardised their analytics programme across plants typically operate with 18-25% higher total maintenance cost per case than their single-site peers — not because their plants are less capable, but because the enterprise cannot see which plant has the best practice, cannot measure which plant is declining, and cannot transfer improvement from one facility to another without months of manual knowledge management. Multi-site analytics management closes this gap by creating a standardised data architecture, KPI framework, reporting cadence, and knowledge transfer mechanism that operates across every plant in the network — enabling the enterprise analytics manager to compare plant performance on a common scale, identify underperforming assets regardless of location, and deploy improvement programmes that have already been validated at the best-performing site. The 2025-2026 benchmark data across multi-site FMCG operators shows that enterprises deploying standardised analytics platforms achieve 22-35% faster problem resolution across sites, 30-45% higher best-practice adoption rates, and 15-20% lower total maintenance cost per case within 18 months of standardisation. This guide provides FMCG enterprise analytics managers and multi-site operations directors with a framework for building, deploying, and sustaining a standardised analytics programme across their entire production network.
The Multi-Site Analytics Problem: Why Every Plant Has Its Own Version of the Truth
The fundamental obstacle to multi-site analytics management in FMCG is not data availability — every plant generates production data, maintenance records, quality inspections, and energy consumption logs. It is data comparability. Plant A defines OEE availability as planned production time minus unplanned downtime divided by planned production time, but counts changeover time as planned downtime. Plant B defines the same metric the same way but counts changeover time as part of availability, only subtracting actual breakdown events. Both numbers are correct according to their local definitions. Neither number can be compared to the other without manual normalisation that the enterprise analytics team must perform for every cross-site report they generate. The same inconsistency applies across maintenance cost coding, defect classification categories, spare parts naming conventions, shift definitions, and SKU grouping hierarchies. The result is that the enterprise analytics team spends 60-70% of their time normalising data before they can analyse it — leaving 30-40% of their time for the actual analysis that drives improvement. A standardised multi-site analytics platform eliminates the normalisation burden by enforcing a common data architecture, KPI calculation methodology, and classification taxonomy across every connected plant — enabling the enterprise team to spend 80-90% of their time on analysis and improvement deployment rather than data preparation.
The Standardised Analytics Architecture for Multi-Site FMCG Operations
The iFactory multi-site analytics platform is built on a three-layer architecture that separates data collection (which must accommodate local plant variation) from KPI calculation (which must be standardised across sites) from enterprise reporting (which must serve the analytics and operations teams with comparative insights). Layer 1, the Data Collection Layer, connects to each plant's existing machine sensors, PLCs, CMMS, MES, and quality systems — accepting that each plant may use different equipment brands, software platforms, and data formats. This layer normalises incoming data streams into a common schema without requiring any plant to change its local systems. Layer 2, the Standardised KPI Layer, calculates every metric — OEE, downtime, waste, energy per case, maintenance cost per case, Cpk — using a single, enterprise-defined calculation methodology that applies identically across every plant. The enterprise analytics manager defines the KPI calculation rules once; the platform applies them consistently to every plant's normalised data. Layer 3, the Enterprise Reporting Layer, aggregates plant-level KPIs into cross-site dashboards, benchmarking reports, trend analyses, and automated alerting when a plant's performance deviates from the enterprise range. The enterprise team accesses a single view of all plants without manual data normalisation steps between data ingestion and report generation.
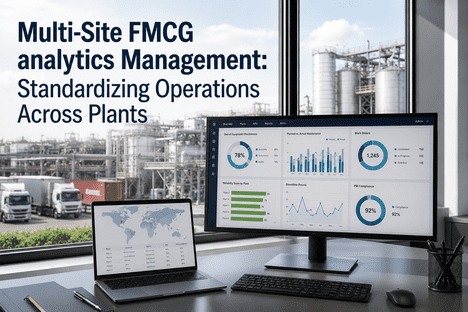
The Enterprise Dashboard: What the Multi-Site Analytics Manager Sees
The enterprise analytics manager's dashboard is designed around a single operational question: which plants, lines, or assets are underperforming relative to the enterprise benchmark, and what is the best practice from the top-performing site that can be deployed to close the gap? The dashboard organises every plant on a common performance scale — ranked by OEE, total maintenance cost per case, waste percentage, energy per case, and schedule attainment — with colour-coded status indicators showing each plant's position relative to the enterprise target range. A plant in the top quartile is green. A plant in the bottom quartile is red. The plant in the bottom quartile for OEE but with a top-quartile waste rate has a specific performance profile that drives a targeted improvement response — not a general "improve OEE" directive that ignores the plant's existing strength. The dashboard also tracks best-practice deployment status: which improvement protocols from the top-performing plant have been deployed to which underperforming sites, the deployment completion percentage, and the performance trend before and after deployment. Talk to an expert about configuring the enterprise multi-site dashboard for your plant network and KPI framework.
Shared KPIs and Enterprise Benchmarking: The Foundation of Multi-Site Analytics
The success of any multi-site analytics programme depends on the quality of the shared KPI framework that defines how every plant's performance is measured and compared. The iFactory platform includes a pre-configured FMCG KPI library that standardises the 40 most common manufacturing metrics across the areas of overall equipment effectiveness, maintenance performance, quality performance, energy and sustainability, and cost and productivity. Each KPI is documented with its calculation formula, data source requirements, normalisation rules, and enterprise benchmark range based on industry data from comparable FMCG operations. The enterprise analytics manager can adopt the library as-is, customise individual KPI definitions to match existing reporting conventions, or define entirely new KPIs that the platform then calculates consistently across every connected plant. The shared KPI framework eliminates the primary obstacle to multi-site analytics — the inability to compare plant performance on a common scale — and enables the enterprise team to focus on analysis, benchmarking, and improvement deployment rather than data reconciliation.
We had seven plants across four countries, each reporting OEE, downtime, and maintenance cost to headquarters every month. Every report used a different calculation methodology. Plant A counted changeover time in availability. Plant B excluded it. Plant C included quality hold time as downtime. Plant D counted it as planned. The enterprise analytics team spent the first week of every month normalising the data before they could analyse it — and they were never confident that the normalised numbers reflected reality. We deployed the iFactory multi-site platform with a single KPI library that every plant adopted. Within 60 days, every plant was reporting OEE the same way. The first enterprise-wide benchmarking report revealed that our best-performing plant in Southeast Asia was running 22% higher OEE than our worst-performing plant in Europe — with the same equipment, same SKUs, and similar shift patterns. The best-practice transfer programme we launched based on that comparison delivered a 12% OEE improvement at the European plant within 8 months. The enterprise analytics team now spends 85% of their time on improvement deployment instead of data normalisation.
Knowledge Sharing and Best-Practice Propagation: The Multi-Site Analytics Force Multiplier
The single highest-value capability of a standardised multi-site analytics platform is not the cross-site visibility — it is the ability to propagate improvement practices from the best-performing plant to every other plant in the network with measurable adoption tracking. In traditional multi-site operations, a plant manager who discovers an improvement that reduces changeover time by 30% documents it in an email or a shared drive folder. Other plant managers may read it, may adopt it, or may ignore it — and headquarters has no visibility into which plants have adopted the practice, which have adapted it, and which have never opened the document. The iFactory best-practice registry changes this by creating a structured repository where every improvement protocol is documented with the plant context, the specific changes implemented, the validated outcome data, and the deployment requirements. The enterprise analytics manager can assign any best practice to any plant with a defined deployment timeline, track adoption progress through the platform's deployment status tracking, and measure the receiving plant's KPI trend before and after deployment. This transforms knowledge sharing from a passive activity — hoping that plant managers will read shared documents — into an active, managed process with adoption targets, deployment tracking, and validated impact measurement. Talk to an expert about configuring the best-practice registry for your multi-site analytics programme.
Conclusion: The Multi-Site Analytics Programme That Transforms Enterprise Performance
The gap between a multi-site FMCG operator that manages each plant independently and one that operates a standardised analytics platform across its entire network is not a small efficiency difference — it is a structural cost and performance advantage that compounds every year. The enterprise that standardises its KPI definitions, data architecture, and reporting cadence across all plants eliminates the data normalisation burden that consumes 60-70% of its analytics team's time, unlocks cross-site benchmarking that reveals performance gaps invisible to site-level reporting, and enables best-practice propagation that transfers improvement from the best-performing site to every other plant in the network.
The evidence from multi-site FMCG operators deploying standardised analytics platforms in 2025-2026 is consistent: 22-35% faster cross-site problem resolution, 30-45% higher best-practice adoption rates, 15-20% lower total maintenance cost per case within 18 months, and 3-5x ROI within 24 months for networks of 5 or more plants. The enterprise analytics team transitions from data normalisation to performance improvement — spending 80-90% of its time on analysis, benchmarking, and deployment rather than data reconciliation.
iFactory AI's multi-site management platform is built for FMCG enterprises that need to standardise analytics across plants and transform their enterprise analytics capability. Book a Demo to see the enterprise multi-site dashboard configured for your plant network — or talk to an expert about a free multi-site analytics maturity assessment for your organisation.