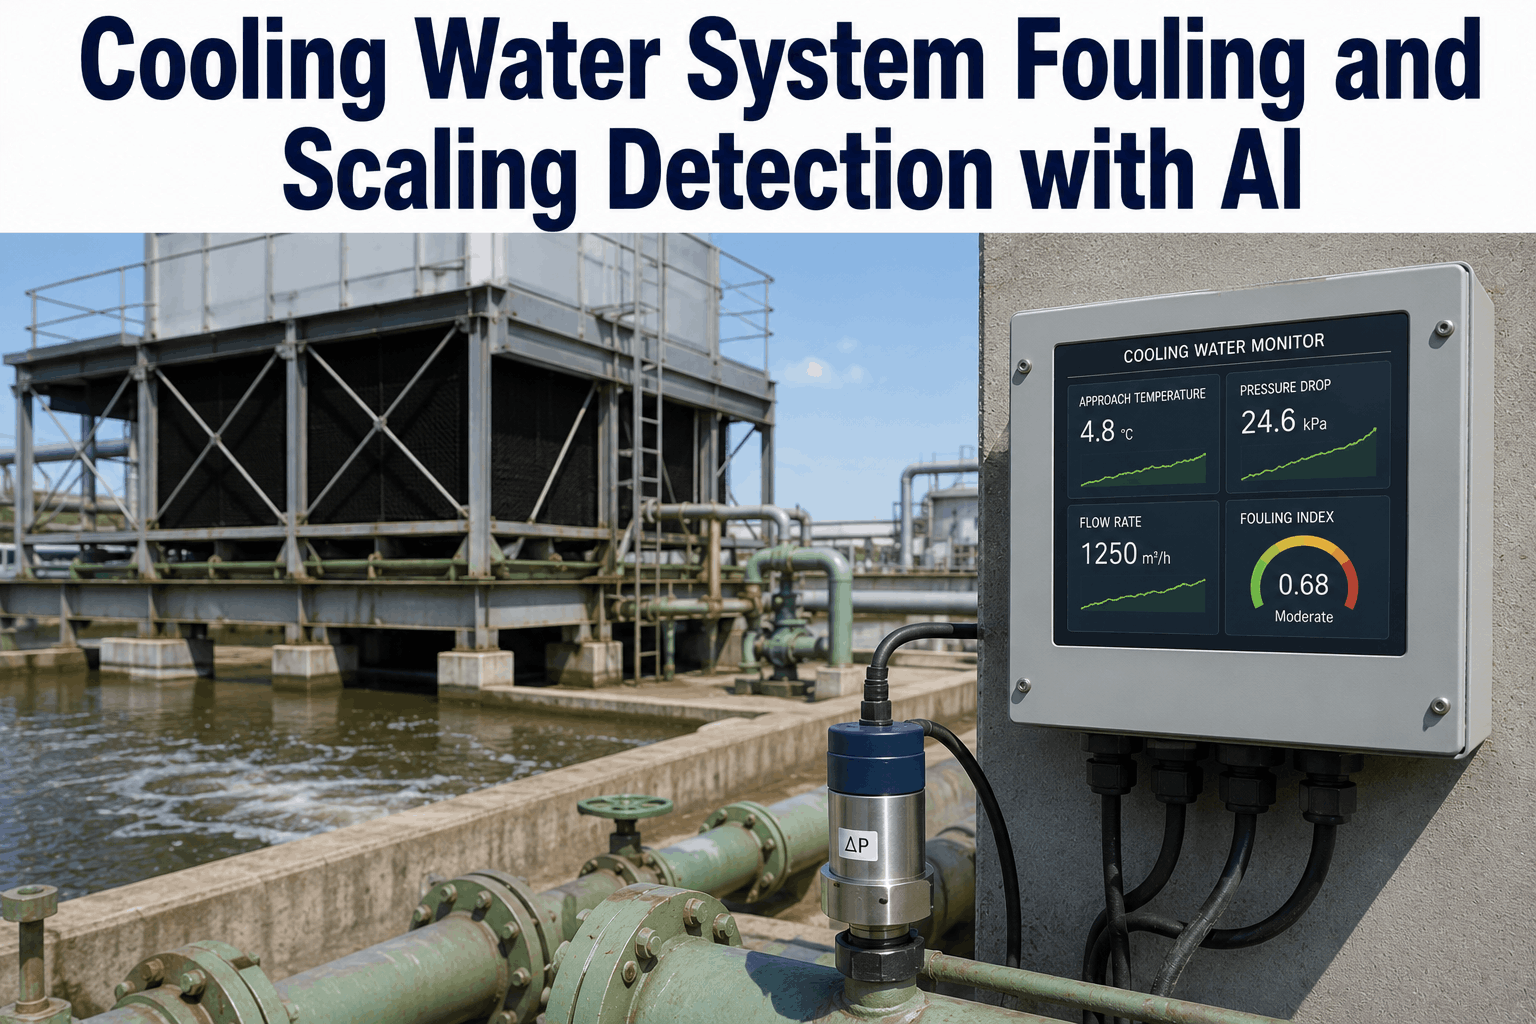
AI correlates approach temperature, pressure drop, and flow rate trends to detect fouling and scaling in condensers, heat exchangers, and cooling towers before thermal efficiency loss reaches levels that reduce production output or force unplanned cleaning outages. Start Trial Free to see how iFactory gives cooling system engineers the process trend analysis needed to detect fouling progression and schedule cleaning interventions before efficiency penalties accumulate.
Detect Condenser and Heat Exchanger Fouling Before It Costs You Production
iFactory monitors approach temperature, pressure drop, and heat transfer coefficient trends simultaneously — detecting fouling and scaling progression weeks before efficiency loss reaches alarm thresholds, enabling planned cleaning instead of emergency outages.
Why Single-Parameter Monitoring Misses Early Fouling in Cooling Systems
Heat exchanger fouling is a multi-variable process — a fouling layer reduces heat transfer coefficient, which increases approach temperature, which (depending on flow configuration) may also increase pressure drop as flow channels narrow. Each of these indicators lags the others depending on fouling type: biological fouling primarily raises approach temperature before significantly affecting pressure drop, while mineral scaling often produces pressure drop changes before thermal performance noticeably degrades. Monitoring any single parameter therefore misses the early signal that appears in a different parameter — and by the time a single threshold is crossed, fouling has already progressed to a stage where cleaning downtime is more extensive than it would have been with earlier detection. AI correlation of all three parameters against operating condition-normalized baselines detects fouling type and progression rate earlier and more accurately than threshold-based approaches. Engineering teams that Book a Demo with iFactory see how multi-parameter fouling correlation changes cleaning scheduling decisions compared to approach temperature monitoring alone.
-
Approach Temperature Trend Analysis
iFactory tracks the temperature difference between inlet cooling water and the cooled process stream — detecting the gradual approach temperature rise that indicates increasing fouling thermal resistance, normalized for cooling water temperature and flow rate variation.
-
Pressure Drop Trend Monitoring
iFactory monitors tube-side and shell-side pressure drop trends across heat exchangers — detecting the progressive pressure increase from fouling layer accumulation in flow channels, normalized for flow rate and fluid viscosity changes.
-
Heat Transfer Coefficient Calculation
iFactory calculates the overall heat transfer coefficient from measured temperatures and flow rates — tracking U-value degradation as the most direct indicator of fouling thermal resistance accumulation, independent of operating condition variation.
-
Fouling Type Classification
Different fouling mechanisms produce characteristic approach temperature–pressure drop ratio patterns. iFactory classifies fouling type — biological, mineral scaling, particulate, or corrosion product — from multi-parameter trend relationships to direct the appropriate cleaning method.
-
Cooling Tower Performance Monitoring
iFactory tracks cooling tower approach temperature and range against design conditions — detecting fill media fouling, drift eliminator plugging, and distribution system scaling that reduce tower heat rejection capacity and raise condenser inlet temperatures.
-
Cleaning Interval Optimization
iFactory projects fouling progression rate to estimate the time to critical efficiency loss — enabling cleaning to be scheduled when fouling cost exceeds cleaning cost rather than on fixed calendar intervals that either clean too early or too late.
Cooling System Fouling Detection: Key Monitoring Parameters
-
Overall Heat Transfer Coefficient Degradation: Primary Fouling Indicator
Thermal PerformanceThe overall heat transfer coefficient U integrates the thermal resistance of the tube wall, fouling layers on both sides, and the convective resistances of both fluid streams — making it the single parameter that most directly reflects fouling severity regardless of which surface is fouling or which fouling mechanism is active. iFactory calculates U from logged temperatures (process inlet and outlet, cooling water inlet and outlet) and flow rates using the LMTD method — tracking U degradation as a percentage of the clean design value over time. A U-value that has degraded to 80% of design indicates that fouling thermal resistance has become significant enough to warrant cleaning consideration; at 70% of design, the efficiency penalty is typically justifying cleaning cost. Teams that Start Trial can configure U-value monitoring for existing heat exchangers using process historian temperature and flow data.
Calculation Method
LMTD method from four-point temperature and flow measurement
Alert Thresholds
80% of design for notification; 70% for cleaning work order
iFactory Record
U-value trend normalized for operating conditions per exchanger
-
Pressure Drop Fouling Index: Flow Restriction Accumulation
Hydraulic IndicatorFouling layer accumulation reduces the effective flow area in tube bundles and shell passages — increasing fluid velocity in the remaining area and raising pressure drop at a rate that depends on fouling layer thickness and surface roughness. iFactory tracks normalized pressure drop (pressure drop at measured flow divided by pressure drop at reference flow) across heat exchanger tube and shell passes — computing a fouling pressure index that separates flow-related variation from true fouling accumulation. Biological fouling tends to produce earlier pressure drop signals than thermal resistance signals; particulate fouling produces rapid pressure drop increases that disproportionately exceed U-value degradation. The U-value-to-pressure-drop ratio trend provides fouling type classification information that directs the cleaning method — hydroblasting for particulate and biological fouling, chemical cleaning for mineral scaling. Teams that Book a Demo can review fouling type classification logic for their specific exchanger types and cooling water chemistry.
Normalization
Pressure drop corrected to reference flow rate and temperature
Type Indicator
U/pressure drop ratio pattern distinguishes fouling mechanism
iFactory Record
Normalized pressure drop trend per tube and shell pass
-
Approach Temperature Monitoring: Condenser and Cooler Performance
Temperature IndicatorApproach temperature — the difference between the process outlet temperature and the cooling water inlet temperature at the same end of the exchanger — is the most operationally visible fouling indicator because it directly reflects the loss of cooling duty. iFactory tracks approach temperature trend normalized for cooling water supply temperature, which varies seasonally, and for heat load, which varies with production rate — isolating the fouling-related component of approach temperature change from operational variation. For condensers, the approach temperature directly affects saturation pressure and therefore compression power consumption — making approach temperature fouling monitoring an energy cost indicator as well as a maintenance planning tool. iFactory calculates the energy penalty in power consumption terms from approach temperature degradation, providing the financial basis for cleaning timing decisions that pure temperature threshold monitoring cannot produce.
Normalization
Approach temperature corrected for cooling water temperature and heat load
Energy Indicator
Compression power penalty calculated from approach temperature loss
iFactory Record
Approach temperature trend and energy cost per condenser
-
Cooling Tower Performance Degradation: Fill Media and Distribution Monitoring
Tower PerformanceCooling tower fouling affects the entire cooling system by raising the condenser inlet temperature — a tower that cannot achieve design approach temperature forces all connected condensers to operate with degraded heat transfer coefficients. iFactory tracks cooling tower approach temperature and cooling range against design conditions corrected for ambient wet bulb temperature — detecting fill media fouling, nozzle blockage, and drift eliminator scaling before they drive condenser inlet temperatures beyond design limits. Tower performance degradation appears first as increased approach temperature at design flow, followed by flow restriction in distribution systems as nozzles and headers scale, and finally as reduced airflow if fan systems are affected. iFactory's multi-parameter tower analysis identifies which component of tower performance is degrading — enabling targeted maintenance (nozzle cleaning, fill media section replacement, fan maintenance) rather than complete tower outage.
Performance Parameters
Tower approach, range, and effectiveness vs wet bulb temperature
Component Diagnosis
Fill media, distribution nozzles, and fan performance separated
iFactory Record
Tower performance trend corrected for ambient conditions per cell
-
Water Chemistry Correlation: Scaling and Biological Risk Index
Chemistry IntegrationFouling risk in cooling systems is correlated with water chemistry — Langelier Saturation Index above 0.5 indicates supersaturation with respect to calcium carbonate and elevated scaling risk; high biological oxygen demand in the return water indicates microbial fouling development. iFactory integrates cooling water chemistry data from online analyzers or periodic laboratory results — computing scaling risk index and biological fouling risk index as predictive inputs that lead the heat transfer and pressure drop indicators by days to weeks. When water chemistry risk index rises above the configured threshold before heat transfer degradation is detectable, iFactory alerts the water treatment team to apply corrective chemical dosing — preventing fouling initiation rather than detecting it after it has begun. Teams that Start Trial can configure water chemistry risk integration alongside heat transfer monitoring for each cooling circuit.
Chemistry Inputs
LSI, conductivity, pH, biological indicator, inhibitor concentration
Risk Outputs
Scaling risk index and biological fouling risk index per circuit
iFactory Record
Chemistry risk index correlated to subsequent fouling rate history
-
Fouling Rate Projection and Cleaning Interval Optimization
Economic OptimizationThe optimal cleaning point for a fouled heat exchanger is where the accumulated energy efficiency loss plus production impact equals the cost and duration of a cleaning outage — a calculation that requires knowing the fouling progression rate, not just the current fouling level. iFactory fits a fouling progression model to the measured U-value degradation trend and projects the time to reach economic cleaning threshold — accounting for the energy cost of continued operation with degraded heat transfer and the production impact of cleaning downtime at different schedule points. This projection enables maintenance planning to schedule cleaning during the next planned maintenance window if it falls before the economic threshold, or to advance cleaning into the next available outage opportunity if the projection indicates the threshold will be crossed before the planned maintenance date. Teams that Book a Demo can review cleaning interval optimization configuration for their specific exchanger economics.
Projection Model
Fouling rate fit to measured U-value degradation trend
Economic Threshold
Energy penalty cost plus downtime cost versus cleaning cost
iFactory Record
Fouling rate, projection, and cleaning timing history per exchanger
Cooling System Fouling Detection Performance Indicators
Fouling Detection Lead Time vs Method
Multi-parameter AI correlation detects fouling onset 52 days before efficiency loss requires emergency cleaning — versus 5 days for visual/thermal inspection detection that occurs after significant fouling has accumulated.
U-Value Degradation Rate by Fouling Type
U-value % of clean design over weeks
Biological fouling degrades U-value fastest in warm conditions; mineral scaling shows a slower but continuous decline; particulate fouling rate varies with water turbidity and flow velocity.
Energy Penalty by Approach Temperature Loss
Compressor power increase per approach delta
Each degree of approach temperature rise from condenser fouling increases compression power consumption by 1.5 to 2%, making a 5°C fouling-driven approach loss worth 9.4% additional power cost.
Cleaning Interval Optimization Savings
Condition-based cleaning scheduling reduces total cleaning plus energy penalty cost by 35% compared to fixed calendar cleaning intervals by eliminating both premature cleaning and excessive fouling accumulation.
Cooling System Fouling Monitoring: Reference Specifications
Scroll for more
| Monitored Parameter | Fouling Type Detected | Alert Threshold | iFactory Data Source | Update Frequency |
|---|---|---|---|---|
| Overall U-value (LMTD) | All fouling types | <80% of clean design value | Four-point temperature + flow historian | Hourly calculated |
| Normalized Pressure Drop | Particulate, biological, scaling | >20% above clean baseline | Differential pressure transmitters | Continuous |
| Approach Temperature Trend | All fouling types (thermal impact) | >2°C above design approach | Process and cooling water temperature | Continuous |
| Tower Approach and Range | Fill media, nozzle, fan fouling | >1.5°C approach vs wet bulb design | Tower inlet/outlet and WB temperature | Continuous |
| Water Chemistry Risk Index | Scaling and biological (predictive) | LSI >0.5 or bio risk >threshold | Online analyzers or lab results | Per sample or online |
How iFactory Supports Cooling Water Fouling Detection Programs
Cooling system fouling is a progressive efficiency problem that becomes a production problem — and the transition from manageable efficiency penalty to production constraint happens faster than fixed-interval cleaning programs can respond. iFactory provides the continuous multi-parameter monitoring that converts cooling system management from a calendar-driven activity to a condition-driven one: calculating overall heat transfer coefficients from process historian data, correlating approach temperature trends with pressure drop changes to classify fouling mechanism, integrating water chemistry risk indices as leading indicators, and projecting cleaning timing based on fouling rate rather than elapsed time since last cleaning. When iFactory projects that a critical condenser will cross its economic cleaning threshold in eighteen days — while the planned maintenance window is twenty-five days away — operations has the data to advance the cleaning into an available production gap rather than waiting for a forced outage. Facilities can Start Trial and begin U-value monitoring on priority heat exchangers using existing process historian temperature and flow data within the first iFactory configuration session.
U-Value Continuous Calculation
iFactory calculates overall heat transfer coefficient hourly from process historian data — tracking fouling thermal resistance accumulation as a normalized degradation percentage independent of operating load and cooling water temperature variation.
Fouling Type Classification
iFactory correlates U-value degradation rate with normalized pressure drop trends — classifying fouling as biological, mineral scaling, or particulate to direct the appropriate cleaning method and chemical treatment response.
Water Chemistry Risk Integration
iFactory integrates Langelier Saturation Index and biological risk indicators as predictive fouling triggers — alerting water treatment teams before heat transfer degradation is detectable when chemistry conditions support fouling initiation.
Economic Cleaning Interval Optimization
iFactory projects fouling progression rate to the economic cleaning threshold — enabling planned cleaning scheduling that minimizes total energy penalty plus cleaning cost rather than defaulting to calendar-based or crisis-driven cleaning intervals.
Deploying Cooling System Fouling Monitoring: Implementation Steps
01
Identify Priority Heat Exchangers and Condensers
Select cooling system equipment where fouling most directly affects production output or energy cost — typically the main condensers, large process coolers, and cooling tower cells serving critical production areas.
02
Confirm Temperature and Flow Data Availability
Verify that process historian data includes four-point temperature measurements (process inlet, process outlet, cooling water inlet, cooling water outlet) and flow rate for each priority exchanger — the minimum data set for U-value calculation in iFactory.
03
Enter Clean Design Specifications into iFactory
Load design U-values, approach temperatures, and pressure drop specifications for each monitored exchanger into iFactory — establishing the clean baseline against which fouling degradation percentages are calculated and alert thresholds are set.
04
Configure Water Chemistry Data Integration
Connect online water chemistry analyzer outputs or configure periodic laboratory result entry in iFactory — enabling Langelier Saturation Index and biological risk index calculation as predictive fouling indicators for each cooling circuit.
05
Define Economic Cleaning Thresholds
Calculate and enter the cleaning economic threshold for each exchanger in iFactory — the U-value degradation percentage at which accumulated energy penalty cost and production impact equals the cleaning cost, enabling optimal cleaning timing projection.
06
Review Fouling Progression and Cleaning Projections Monthly
Schedule monthly reviews of iFactory's cooling system fouling dashboard — comparing fouling rates, cleaning projections, and water chemistry risk indices across the monitored cooling circuit portfolio to plan cleaning interventions. Book a Demo to see the full cooling system fouling monitoring workflow.
Frequently Asked Questions
How does iFactory detect heat exchanger fouling from process data alone?
iFactory calculates the overall heat transfer coefficient from four-point temperature and flow rate measurements using the LMTD method — tracking U-value degradation as a normalized percentage of the clean design value that reflects fouling thermal resistance accumulation independent of operating load and cooling water temperature variation.
What is the difference between scaling and biological fouling, and why does it matter?
Mineral scaling (calcium carbonate, calcium sulfate) forms a hard, thermally resistive layer that responds to acid cleaning; biological fouling forms a soft, thermally insulating biofilm that responds to biocide treatment. iFactory classifies fouling type from the U-value-to-pressure-drop degradation ratio — directing the correct cleaning method, since applying the wrong treatment prolongs fouling rather than resolving it.
Can iFactory integrate with cooling water chemistry management systems?
Yes. iFactory accepts online analyzer outputs (conductivity, pH, ORP, turbidity) and laboratory result imports for cooling water chemistry — computing Langelier Saturation Index and biological risk indicators as predictive fouling drivers that lead heat transfer degradation signals by days to weeks.
How does fouling in the cooling tower affect downstream heat exchangers?
Cooling tower fouling raises the condenser inlet water temperature, reducing the available temperature driving force for all connected heat exchangers. iFactory tracks tower approach temperature normalized for wet bulb temperature — detecting tower performance degradation early enough to prevent it from forcing condenser cleaning that would have been unnecessary if the tower had been maintained.
What data history is required to configure fouling progression projection?
iFactory requires a minimum of four to six weeks of post-cleaning U-value history to fit an initial fouling progression model for each exchanger. Longer history from multiple cleaning cycles improves projection accuracy by capturing seasonal variation in fouling rate driven by cooling water temperature and chemistry changes.
Schedule Heat Exchanger Cleaning When Fouling Warrants It — Not When the Calendar Says
iFactory gives cooling system engineers the multi-parameter fouling detection, U-value trend monitoring, and economic cleaning interval optimization needed to reduce energy penalties, minimize cleaning downtime, and eliminate emergency condenser outages driven by undetected fouling accumulation.