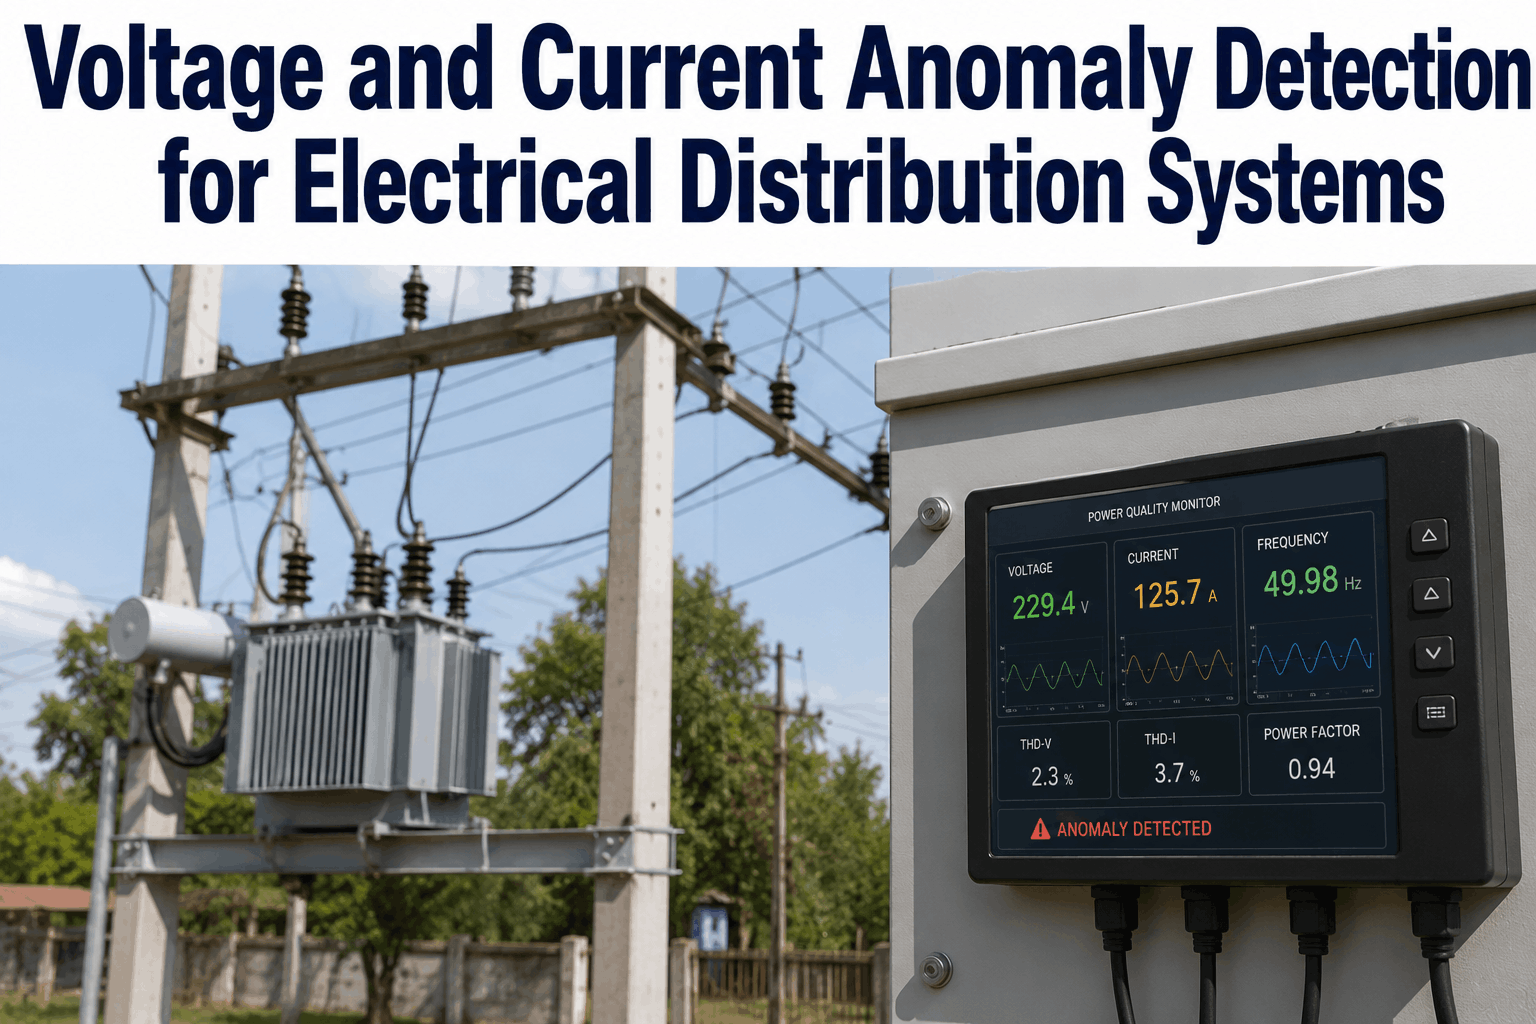
Electrical distribution systems fail slowly and then all at once. A transformer in early insulation degradation draws normal current and delivers normal voltage until the insulation fails catastrophically. A cable developing a partial discharge condition shows no measurable fault at the panel until the discharge bridges the insulation completely. A capacitor bank losing capacitance quietly shifts power factor and loads downstream cables beyond design ratings for months before anything trips. AI power quality monitoring detects these conditions by tracking the statistical patterns in voltage waveforms, current signatures, harmonic content, and load profiles that precede failure — identifying the anomaly weeks before it becomes an outage. Talk to an Expert to see how iFactory deploys AI voltage and current anomaly detection across your electrical distribution infrastructure.
Of unplanned industrial production downtime is caused by electrical distribution failures — making power quality degradation the second largest source of unplanned outage after mechanical equipment failure
Average lead time between AI-detected electrical anomaly and functional failure for the most common distribution system fault types — transformer degradation, cable partial discharge, and capacitor bank loss
Cost ratio between unplanned electrical failure response — including production loss, emergency contractor rates, and expedited equipment — versus planned maintenance intervention on a detected degradation
Of transformer failures preceded by detectable dissolved gas or electrical signature anomalies at least 4 weeks before failure — the window AI monitoring is designed to capture and act on
Detect Transformer Degradation, Cable Faults, and Capacitor Failures Before They Become Outages
iFactory's AI power quality monitoring platform tracks voltage waveforms, current signatures, harmonic content, and load patterns continuously — detecting the electrical anomaly signatures that precede distribution system failures weeks before circuit protection operates.
Why Standard Electrical Protection Cannot Prevent the Failures That Matter Most
Circuit breakers, fuses, and overcurrent relays are designed to interrupt fault currents — they operate in milliseconds when a short circuit develops, protecting downstream equipment from destructive current levels. They are not designed to detect the progressive degradation that precedes faults over weeks or months. A transformer developing thermal degradation of its winding insulation never draws overcurrent until the moment of failure. A cable with developing partial discharge never trips its overcurrent protection until insulation breakdown occurs. The protection system that prevents equipment destruction from the fault cannot provide any warning before the fault — that is not what it was designed to do. AI power quality monitoring fills this gap by detecting the subtle signatures of developing degradation in normal operating waveforms, harmonic distributions, and load patterns that protection systems ignore by design. Teams that Book a Demo with iFactory see how continuous waveform analysis converts normal operating electrical data into a condition monitoring signal that provides weeks of intervention lead time on the failures that protection systems cannot predict.
Transformer Insulation Degradation Detection
AI tracks winding temperature differentials, magnetising current harmonics, and load profile deviations to detect transformer insulation degradation 4 to 10 weeks before thermal failure.
Cable Partial Discharge Identification
High-frequency current signature analysis detects partial discharge activity in medium-voltage cable insulation — the precursor to insulation breakdown that causes cable faults.
Capacitor Bank Condition Monitoring
Capacitance drift, increased harmonic resonance, and neutral current unbalance detect capacitor bank element failures before power factor correction becomes ineffective or resonance conditions develop.
Harmonic Distortion Trending
Total harmonic distortion trending by circuit identifies increasing non-linear load contributions and developing resonance conditions that degrade power quality and accelerate equipment insulation aging.
Load Profile Anomaly Detection
Normal load pattern baselines per circuit identify anomalous load behaviour — unexpected load increases, unusual current signatures, and load imbalance — that indicate equipment degradation or installation changes.
Switchgear Contact Resistance Monitoring
Current and thermal signature analysis detects increasing contact resistance in switchgear, bus connections, and cable terminations before the resistance generates sufficient heat to cause insulation damage.
Six AI Capabilities That Detect Electrical Distribution Faults Before Protection Operates
01
Transformer Degradation Signature Analysis
Primary Detection Capability
Transformer insulation degradation produces detectable changes in the magnetising current waveform, the third harmonic component of no-load current, and the ratio between winding temperature and load current before any thermal protection threshold is approached. AI analysis of these signatures — particularly the rate of change in third harmonic excitation current and the deviation from expected temperature-load relationships — identifies transformers entering accelerated aging before the degradation becomes irreversible. A transformer showing a 15 percent increase in third harmonic excitation current over eight consecutive weekly measurements is in identifiably abnormal condition regardless of whether its winding temperature has reached any alarm level.
Thermal alarm lead time: 0–24 hours
AI signature detection lead time: 4–10 weeks
02
Cable Partial Discharge and Insulation Trending
Insulation Health
Partial discharge in cable insulation generates characteristic high-frequency pulses superimposed on the power frequency current waveform — typically in the 100 kHz to 10 MHz range — whose pulse repetition rate and magnitude correlate with the degree of insulation degradation. AI high-frequency current signature analysis detects these pulses from measurements at the cable termination, separates cable partial discharge from noise sources using pulse shape and repetition pattern classification, and trends the discharge activity over time to project when insulation degradation will reach the critical stage. A cable showing steadily increasing partial discharge pulse repetition rate over a 6-week period is approaching insulation breakdown regardless of whether its insulation resistance megohm reading still passes a periodic test.
Megohm test detection: weeks before failure only
AI PD trending lead time: 6–12 weeks
03
Capacitor Bank Element Failure and Resonance Detection
Power Factor Integrity
A capacitor bank losing individual elements shows a gradual reduction in measured capacitance, an increase in neutral current unbalance for ungrounded banks, and a shift in the system resonant frequency that can bring it closer to a dominant harmonic source. AI monitoring of capacitance drift rate, neutral current trend, and harmonic impedance profile detects element failures in their early stages — when the bank is operating at reduced effectiveness but before the resonance shift reaches a harmonic that exists in the system. Undetected capacitor bank degradation that shifts system resonance into coincidence with the fifth or seventh harmonic of a large drive load can produce harmonic amplification that damages equipment across the affected bus far beyond the capacitor bank itself.
Visible bank failure (neutral trip): day of event
AI element loss detection: 4–8 weeks prior
04
Harmonic Distortion Source Identification and Trending
Power Quality Analysis
Total harmonic distortion that increases progressively on a distribution circuit indicates either a growing non-linear load contribution or a developing resonance condition — two situations requiring different engineering responses. AI harmonic fingerprinting identifies the source of harmonic distortion by the characteristic frequency content and waveform shape of the harmonic contribution, distinguishing between variable frequency drives, arc furnaces, and rectifier loads. Progressive increases in specific harmonic orders on a circuit where loads have not changed indicate resonance amplification rather than source growth — directing investigation toward the system impedance rather than the harmonic sources themselves.
Source misidentification rate (manual): 52%
AI harmonic fingerprint accuracy: 88%
05
Switchgear and Connection Contact Resistance Detection
Connection Integrity
Increasing contact resistance at switchgear contacts, bus connections, cable lugs, and transformer terminations generates localised heating proportional to the square of load current — a condition that accelerates insulation aging in surrounding materials and eventually produces a thermal runaway failure. AI detection of increasing contact resistance uses the ratio between measured voltage drop and current at connection points to identify resistance increases too small to trigger any thermal alarm but large enough to produce cumulative insulation damage over months. The thermal camera finds the hot spot after the damage is accumulating. AI current-voltage ratio monitoring finds the resistance increase before significant heat has been generated.
Thermal imaging detection stage: visible hotspot
AI resistance trending stage: 6–10 weeks earlier
06
Load Profile Baseline and Anomalous Pattern Detection
Operational Intelligence
Every circuit in a distribution system has a characteristic load profile — the pattern of current demand by time of day, day of week, and season that reflects the operational behaviour of connected equipment. AI load profile baseline learning detects anomalous deviations from this pattern that indicate equipment degradation, unintended load additions, or installation changes that affect distribution system loading. A motor developing increased friction draws progressively higher current that appears as a load profile shift weeks before the bearing fails. A cable with developing ground fault leakage appears as an unexpected current offset that load profile analysis detects before the insulation degrades to the point of circuit interruption.
Load anomaly detection (manual): periodic review only
AI load baseline detection: continuous, real-time
Electrical Distribution Fault Types and AI Detection Reference
Scroll for more
| Fault Type | AI Detection Signal | Detection Method | Lead Time | Maintenance Action |
|---|---|---|---|---|
| Transformer Insulation Degradation | 3rd harmonic excitation drift | Magnetising current analysis | 4–10 weeks | Dissolved gas analysis, planned outage |
| Cable Partial Discharge | HF pulse rate and magnitude | High-frequency current signature | 6–12 weeks | Cable section replacement |
| Capacitor Bank Element Loss | Capacitance drift, neutral current | Element balance monitoring | 4–8 weeks | Element replacement |
| Contact Resistance Increase | V/I ratio at connection points | Resistance trending | 6–10 weeks | Connection cleaning or replacement |
| Harmonic Resonance Development | THD increase at stable load | Harmonic impedance trending | 3–8 weeks | Harmonic filter or detuning |
How iFactory Connects Electrical Anomaly Detection to Maintenance Action
Electrical anomaly detection creates value only when the detected condition converts into a maintenance action before the degradation reaches failure. iFactory connects AI power quality monitoring outputs to the maintenance workflow — generating planned work orders for detected anomalies, routing transformer degradation alerts to electrical maintenance, cable partial discharge alerts to the high-voltage team, and capacitor bank anomalies to the power factor correction programme. The complete monitoring record — detection event, parameter trends, estimated remaining useful life, and corrective action — provides the documented evidence base for maintenance decisions and post-event investigations. Teams can Talk to an Expert about connecting iFactory's electrical anomaly detection to your maintenance and reliability engineering workflows.
Continuous Waveform Analysis
iFactory analyses voltage and current waveforms continuously, detecting anomaly signatures that periodic inspections and snapshot measurements routinely miss.
Per-Circuit Baseline Learning
Normal load profiles and power quality signatures are learned per circuit, enabling anomaly detection against circuit-specific baselines rather than generic standards.
Fault Type Classification Engine
Harmonic fingerprinting and signature pattern matching classify detected anomalies to specific fault types, directing the correct corrective intervention from the first detection.
Maintenance Work Order Integration
Detected anomalies generate planned work orders routed to the appropriate electrical maintenance team, converting AI detection into scheduled maintenance action automatically.
Deploying AI Electrical Anomaly Detection: Six Steps
01
Identify Critical Distribution System Assets
Prioritise transformers, medium-voltage cables, capacitor banks, and switchgear whose failure would cause significant production outage or safety consequence for initial monitoring deployment.
02
Configure Power Quality Sensor Integration
Connect existing revenue meters, power quality analysers, and protective relay data ports to iFactory using standard Modbus, DNP3, or IEC 61850 protocols without modifying protective schemes.
03
Establish Per-Circuit Load Profile Baselines
Allow iFactory to collect 30 days of normal operating data per monitored circuit before activating anomaly detection alerts, ensuring seasonal and operational variation is captured in the baseline.
04
Configure Fault Type Alert Routing
Route transformer anomaly alerts to the transformer maintenance programme, cable partial discharge alerts to the cable inspection team, and power quality alerts to the electrical engineering function.
05
Link Electrical Alerts to CMMS Work Orders
Configure iFactory to generate planned work orders when electrical anomaly alerts exceed the intervention threshold, ensuring detection converts to scheduled maintenance action within the estimated lead time.
06
Build Post-Maintenance Verification Records
Run post-maintenance power quality measurements after each corrective action and compare against pre-anomaly baselines to confirm the detected condition was addressed and document the achieved improvement.
Frequently Asked Questions
What electrical signals does AI monitor to detect distribution system degradation?
The primary monitored signals are voltage and current waveforms, harmonic frequency content, load profile patterns over time, and high-frequency current signatures for partial discharge detection — all derived from existing metering and protection infrastructure without additional sensors in most cases.
Can AI electrical monitoring work with existing substation metering without modification to protective relays?
Yes. iFactory connects to existing revenue meters, power quality analysers, and protective relay secondary circuits using read-only data connections over standard industrial protocols, with no modification to the protective scheme or primary instrumentation required.
How does AI detect transformer degradation before a dissolved gas analysis sample would show abnormal results?
AI magnetising current analysis detects changes in the third harmonic excitation current component and temperature-load relationship that precede the dissolved gas generation phase of insulation degradation, providing an earlier warning than periodic DGA sampling at typical quarterly intervals.
What is the difference between AI power quality monitoring and a standard power quality analyser?
A power quality analyser records waveform data and reports against fixed power quality standards. AI monitoring learns per-circuit normal baselines, detects deviations from those baselines over time, classifies the degradation condition, and generates maintenance recommendations — converting measurement data into actionable maintenance intelligence.
How does iFactory connect electrical anomaly detection to maintenance planning?
Detected anomalies generate planned work orders in the CMMS with fault type classification, estimated remaining useful life, and recommended corrective action — routing each alert to the appropriate maintenance team within the projected intervention window automatically.
Your Protection System Operates in Milliseconds After the Fault. AI Monitoring Detects the Degradation Weeks Before It.
iFactory's AI power quality platform continuously analyses the electrical signatures in your existing distribution system data — detecting transformer degradation, cable partial discharge, and capacitor bank failures in the weeks-long window when planned maintenance is still possible.