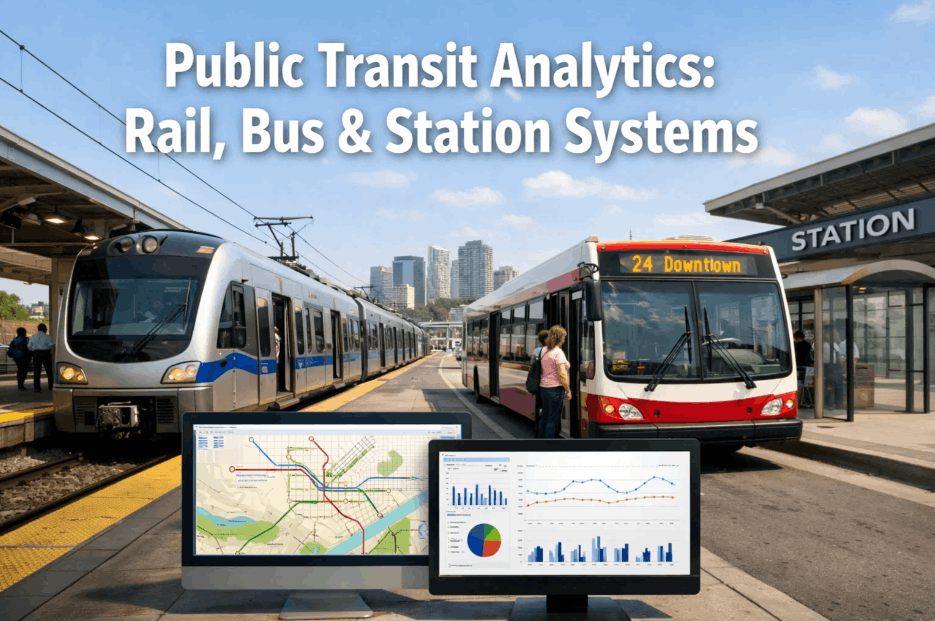
Public transit analytics is rapidly transforming how municipal agencies operate bus fleets, maintain rail cars, manage station infrastructure, and protect passenger safety systems. Across the United States alone, transit agencies manage over 900,000 bus trips and nearly 40 million rail passenger journeys every single day — yet most still rely on time-based maintenance schedules developed decades before IoT sensors and machine learning became affordable at scale. Today, that gap between data availability and operational intelligence represents the single largest source of preventable downtime, regulatory risk, and passenger dissatisfaction in public transportation. AI-driven transit analytics programs close that gap by converting continuous sensor streams into maintenance decisions weeks before breakdowns occur, keeping service schedules intact and compliance documentation complete. Book a demo to see how iFactory's public transit analytics platform works across bus, rail, and station assets.
Protect Every Passenger. Prevent Every Avoidable Breakdown.
iFactory's transit analytics platform monitors bus fleets, rail cars, and station infrastructure in real time — delivering 2–8 weeks of early warning on equipment failures and automated FTA compliance documentation.
Why Public Transit Systems Demand a Dedicated Analytics Program
Traditional fleet management in public transportation was built around mileage intervals and calendar-based inspection cycles — a model that made sense when sensor data was expensive and edge computing didn't exist. In today's environment, those assumptions are obsolete. A modern municipal bus fleet generates terabytes of engine telemetry, brake performance data, and HVAC diagnostic signals every month. A metropolitan rail network produces even more: vibration signatures from wheelsets and bogies, overhead line current profiles, track geometry measurements, and door cycle logs accumulate continuously across hundreds of vehicles and thousands of infrastructure components.
Without a dedicated transit analytics program, this data disappears into disconnected onboard systems or, worse, is never captured at all. The result is reactive maintenance that costs 3 to 5 times more per intervention than condition-based repair, and service disruptions that directly erode ridership and public trust. A structured public transit analytics strategy converts existing vehicle data streams into actionable maintenance intelligence — eliminating the guesswork from fleet decisions and replacing it with statistically grounded failure predictions that maintenance teams can actually schedule around.
Bus Fleet Analytics: From Reactive Repairs to Condition-Based Service
Bus fleet analytics is the operational foundation of any municipal transit analytics program. Whether your fleet runs diesel, compressed natural gas, or battery electric vehicles, the failure modes that cause service gaps — engine misfires, brake degradation, transmission slip, HVAC failures, tire pressure deviation — all produce detectable signal changes weeks before a bus goes out of service. Effective bus analytics platforms capture these signals from existing onboard diagnostic systems, telematics modules, and supplemental IoT sensors, then apply machine learning models to distinguish normal operational variation from genuine deterioration trajectories.
The operational shift this creates is significant. Transit agencies that implement condition-based maintenance powered by bus fleet analytics move from dispatching technicians in response to driver complaints or roadside breakdowns to scheduling interventions during planned overnight windows before any service impact occurs. Research from APTA demonstrates that agencies combining AI diagnostics with predictive scheduling consistently achieve reductions in emergency road calls, extended component lifespans, and measurable improvements in mean distance between failures across their fleets. You can book a demo to see how iFactory applies bus analytics across diesel and electric fleet configurations.
Engine & Powertrain Monitoring
Continuous analysis of engine temperature, RPM variance, oil pressure deviation, and fuel consumption anomalies detects developing engine faults 3–6 weeks before mechanical failure. Electric bus battery state-of-health scoring and thermal management monitoring extend pack lifespan and prevent stranded-vehicle incidents.
Brake System Health Scoring
Wireless IoT devices monitor brake pad wear, caliper pressure balance, and actuator response time continuously. AI models detect brake fade signatures and hydraulic pressure anomalies weeks before safety-critical degradation — eliminating the reactive replacement cycles that generate unnecessary parts inventory and emergency labor costs.
HVAC & Passenger Comfort Systems
Compressor current signatures, refrigerant pressure profiles, and airflow deviation analysis predict HVAC failures that generate disproportionate passenger complaints in summer peak periods. Condition-based HVAC maintenance reduces warranty claims and eliminates the bus-out-of-service scenarios caused by unexpected climate system failures mid-route.
Transmission & Suspension Analytics
Vibration spectrum analysis on drivetrain components and suspension geometry sensors identify wear patterns in automatic transmissions, driveshafts, and shock absorbers that visual inspection consistently misses until failure is imminent. Early detection reduces repair cost by an average of 4x compared to post-failure replacement.
Rail Analytics: Protecting Rolling Stock, Track, and Signaling Systems
Rail car service analytics operates across a more complex asset inventory than bus fleet management, spanning rolling stock components, fixed infrastructure, signaling systems, overhead lines, and station equipment — all of which must perform reliably within narrow safety tolerances. Internationally, the evidence for AI-driven rail analytics is compelling: Transport for London's deployment of AI algorithms cut unplanned rail interruptions by 60%, optimizing daily service for five million passengers. The Vienna metro implemented over 13,200 IoT devices to reduce train breakdowns by 38% over three years. Berlin's BVG analyzed vehicle telemetry to achieve a 22% decrease in wheelset defects, extending component lifespan by an average of nine months.
These outcomes share a common foundation: continuous sensor data feeding machine learning models that distinguish normal operating signatures from early-stage failure indicators across wheelsets, bogies, pantographs, door systems, and traction motors. For commuter rail and light rail operators managing aging rolling stock under constrained capital budgets, rail analytics platforms deliver the highest ROI when prioritized around the failure modes that trigger service cancellations and FRA/FTA regulatory notifications. Book a demo to explore how iFactory deploys rail car service analytics across metro, light rail, and commuter rail configurations.
Deploy AI Rail Diagnostics in Under 12 Weeks.
iFactory's specialized rail analytics models identify wheelset defects, traction motor faults, and pantograph wear patterns with 4–8 weeks of lead time — eliminating service disruptions and safety incidents.
| Asset Category | Key Monitored Parameters | Failure Modes Detected | Typical Detection Lead Time |
|---|---|---|---|
| Wheelsets & Bogies | Vibration spectrum, lateral force, wheel profile wear | Flat spots, flange wear, bearing degradation | 4–8 weeks |
| Traction Motors & Inverters | Current signature, winding temperature, torque ripple | Insulation breakdown, bearing failure, rotor imbalance | 3–6 weeks |
| Pantograph & Overhead Line | Contact force, wear rate, uplift deviation | Carbon strip wear, stagger deviation, wire abrasion | 2–5 weeks |
| Door & Ramp Systems | Actuator cycle time, motor current, seal pressure | Actuator wear, seal failure, misalignment drift | 2–4 weeks |
| Track Geometry & Rail Condition | Gauge deviation, cant, alignment, internal stress | Rail fatigue cracks, ballast voiding, geometry degradation | 6–12 weeks |
| Signaling & Switch Systems | Point motor current, detection circuit response, relay timing | Point machine wear, detection failure, cable degradation | 3–5 weeks |
| HVAC & Auxiliary Power | Compressor current, battery voltage, inverter temperature | Compressor seizure, battery degradation, inverter fault | 2–6 weeks |
Transit Station Analytics: Infrastructure That Passengers Depend On
Transit station analytics is the fastest-growing segment of the public transportation analytics space — and the one most directly visible to passengers. Escalators, elevators, platform door systems, ventilation units, fare gate mechanisms, lighting controls, and fire suppression equipment all require continuous condition monitoring to prevent the asset failures that trigger accessibility violations, safety incidents, and passenger service complaints that receive disproportionate public attention.
Station infrastructure analytics platforms deploy IoT sensors on mechanical and electrical assets throughout transit facilities, streaming vibration, current, temperature, and cycle count data to edge processors that apply condition-based scoring models. An escalator whose motor current is trending upward over a six-week period, combined with increasing vibration at the step chain attachment points, produces a predictable failure signature that analytics models detect with weeks of lead time — enabling maintenance scheduling during overnight service windows rather than emergency mid-day shutdowns that strand passengers and generate ADA compliance liability. The public transit analytics case for station assets is compelling precisely because station failures generate the most immediate public and regulatory consequences of any transit infrastructure category.
Step Chain, Motor & Drive System Monitoring
Vibration analysis on escalator step chains detects elongation and wear patterns 4–6 weeks before mechanical failure. Motor current trending identifies drive system degradation, enabling ADA-compliant maintenance scheduling during overnight windows rather than emergency outages that generate accessibility violations and passenger safety incidents during peak service hours.
Actuator Cycle Analysis & Seal Integrity
Platform screen door actuators accumulate hundreds of thousands of operating cycles annually. Cycle time deviation analysis and motor current signature monitoring detect mechanical wear and alignment drift before door misoperations cause service delays or passenger entrapment incidents — the highest-consequence failure mode in station equipment analytics.
Tunnel Ventilation & Station HVAC Performance
Station ventilation failures in underground transit environments create immediate passenger safety and comfort consequences. Fan motor current analysis, blade vibration monitoring, and airflow rate trending detect impeller imbalance and bearing degradation 3–5 weeks before failure — preventing the emergency response scenarios that compromise both passenger experience and station operational safety.
Passenger Safety Systems: The Non-Negotiable Core of Transit Analytics
Every component of a public transit analytics program ultimately serves one primary objective: protecting passenger safety. The IoT sensors, machine learning models, and automated work order systems are implementation details; the outcome that justifies every investment decision is a transit network where safety-critical systems — brakes, signaling, track condition, fire suppression, structural integrity — operate within validated parameters at all times. When predictive analytics flags a brake actuator anomaly on a bus running school service routes, or identifies a turnout motor current signature that precedes a point failure, the safety case for transit analytics becomes self-evident.
The FTA Safety Management System (SMS) framework increasingly expects transit agencies to demonstrate proactive hazard identification and risk mitigation — requirements that condition-based maintenance programs directly satisfy through documented sensor monitoring, anomaly detection logs, and corrective action records. IoT-enabled predictive maintenance platforms generate the continuous asset health documentation that SMS audits require, creating an unbroken chain of evidence that safety-critical systems were monitored, anomalies were detected, and interventions were completed — automatically, without manual logbook entries. Book a demo to see how iFactory's compliance documentation integrates with FTA Safety Management System requirements.
Electric Bus Analytics: The Emerging Priority for Municipal Transit Fleets
The global shift toward electric bus fleets is accelerating the demand for advanced bus fleet analytics capabilities that go beyond the diesel-era sensor packages most transit maintenance systems were designed around. Electric buses introduce an entirely new set of high-consequence failure modes — battery thermal runaway risk, traction inverter fault propagation, charging infrastructure failures, and regenerative braking system degradation — that require continuous monitoring across dozens of interdependent electrical subsystems.
According to market analysis, the bus and public transport fleet management sector is projected to grow from USD 8.65 billion in 2025 to USD 15.71 billion by 2030 at a 12.7% CAGR, with electric vehicle diagnostics and battery health monitoring identified as the primary growth driver. Transit agencies that deploy analytics platforms capable of monitoring battery state-of-health, cell voltage balance, thermal gradient distribution, and charge cycle degradation rates gain a decisive operational advantage: they can predict battery capacity decline trajectories that enable strategic replacement planning rather than emergency bus removal from service when range falls below route requirements. Real-time analytics also enable charging optimization that extends pack life by ensuring batteries avoid chronic overcharge and deep discharge cycles that accelerate degradation.
Implementing a Municipal Transit Analytics Program: A Phased Roadmap
Successful transit analytics program implementation follows a phased approach that aligns sensor deployment with asset criticality, regulatory risk, and operational consequence. Transit agencies that attempt full-facility deployment simultaneously typically encounter integration complexity that delays ROI realization by six to twelve months. A prioritized rollout delivers measurable outcomes at each phase while building the data infrastructure required for full-fleet and full-station coverage.
Safety-Critical Rolling Stock & High-Consequence Bus Routes
Deploy sensors on brake systems, traction motors, and suspension components across highest-utilization vehicles and routes. Configure critical alert tiers with automated work order generation integrated into existing CMMS platforms. This phase delivers immediate passenger safety value and eliminates the highest-consequence breakdown scenarios from the unplanned failure pool within the first operational quarter.
Rail Infrastructure & Station Priority Assets
Extend monitoring to track geometry, signaling systems, and high-cycle station assets including escalators, elevators, and platform door systems. Activate machine learning remaining-useful-life predictions for rolling stock components with sufficient baseline data. Enable condition-warning work order routing that schedules station maintenance during overnight service windows — eliminating ADA compliance exposure from daytime equipment outages.
Utilities, Environmental Systems & Full-Fleet Coverage
Complete fleet coverage with sensors on HVAC, ventilation, power supply systems, and fare infrastructure. Activate energy efficiency benchmarking and utility cost optimization analytics. Enable cross-asset failure correlation models that identify systemic issues — an aging power substation affecting train performance across a corridor — before individual component failures cascade into service-wide disruptions.
Digital Twin & Capital Lifecycle Planning
Integrate full-network sensor data with capital planning, asset lifecycle management, and fleet replacement scheduling. Digital twin models for every monitored asset incorporate failure history, component age, and ML-predicted remaining useful life to generate multi-year capital expenditure forecasts that replace end-of-budget-year surprise replacement requests with data-justified procurement schedules. FTA grant applications gain defensible, sensor-backed asset condition evidence that strengthens funding justifications. Book a demo to see the Phase 4 lifecycle planning dashboard applied to transit fleet and infrastructure portfolios.
Measuring ROI: What Transit Analytics Programs Actually Deliver
The financial case for public transportation analytics extends well beyond avoided repair costs. The total value proposition spans avoided emergency repair premiums, reduced parts inventory carrying costs, extended asset lifespan, energy efficiency gains, ADA compliance risk reduction, and the ridership retention value of reliable service. Transit agencies that quantify only direct maintenance savings consistently underestimate the program ROI by 40 to 60 percent.
For most municipal transit operators, the ROI calculation is decisively positive before accounting for the compliance documentation value that an analytics platform generates automatically. The FTA Safety Management System audit preparation that previously consumed weeks of manual record retrieval becomes a reporting export. The APTA performance benchmarking data that required manual compilation is produced as a continuous operational dashboard. And the grant application evidence that federal transit capital programs increasingly require — documented asset condition data demonstrating deterioration and maintenance need — is captured automatically as a byproduct of the predictive maintenance workflow.
Frequently Asked Questions: Public Transit Analytics
What data sources does a bus fleet analytics platform use?
Effective bus analytics platforms integrate data from OBD-II and J1939 diagnostic buses, existing telematics modules, supplemental vibration and temperature sensors, and driver behavior event logs. Electric bus platforms additionally monitor CAN bus battery management system data, charging session records, and thermal management system performance. No new onboard hardware is required for buses with modern telematics installations — analytics platforms connect to existing data streams via secure API or cellular gateway.
How does rail analytics differ from standard predictive maintenance platforms?
Rail analytics platforms must handle a fundamentally different asset topology than industrial or bus fleet maintenance systems. Rolling stock components — wheelsets, pantographs, traction motors, door systems — require models trained on rail-specific failure datasets that account for route geometry, speed profile variation, and track condition influence on component wear rates. Infrastructure analytics additionally require integration with track geometry measurement data, signaling system diagnostic outputs, and civil inspection records to build the asset health models that drive meaningful maintenance decisions.
Can transit station analytics integrate with existing facility management systems?
Yes. Modern transit station analytics platforms connect via REST API to CMMS, building management systems (BMS), and enterprise asset management (EAM) platforms. Sensor data and anomaly alerts flow into existing work order workflows, meaning maintenance teams operate within familiar systems rather than adopting entirely new toolsets. Auto-generated work orders include fault classification, priority rating, required parts, and response procedure — reducing technician diagnostic time from hours to minutes.
What is the typical implementation timeline for a transit analytics program?
Phase 1 deployments covering critical rolling stock and high-consequence bus routes typically reach operational status within 8–12 weeks of sensor installation. ML model training on site-specific baseline data completes within 4–6 weeks of data collection, and cross-fleet failure pattern intelligence from the shared model network is available from day one. Most transit agencies achieve measurable ROI — documented through avoided breakdown costs and reduced emergency maintenance labor — within the first six months of platform operation.
How does transit analytics support FTA Safety Management System compliance?
Transit analytics platforms generate the continuous asset monitoring records, anomaly detection logs, and corrective action documentation that FTA SMS frameworks require as evidence of proactive hazard identification. Timestamped sensor data, automated alert records, and completed work order histories produce tamper-resistant compliance documentation that satisfies SMS audit requirements — without the manual logbook entries and inspection sign-offs that reactive maintenance programs depend on. This documentation also directly supports FTA capital grant applications that increasingly require demonstrated asset condition evidence.
Ready to Build a Smarter, Safer Transit Network?
iFactory's public transit analytics platform gives your maintenance teams 2–8 weeks of advance warning across bus fleets, rail cars, and station infrastructure — protecting passenger safety, satisfying FTA compliance requirements, and delivering measurable cost savings from the first detected failure event.