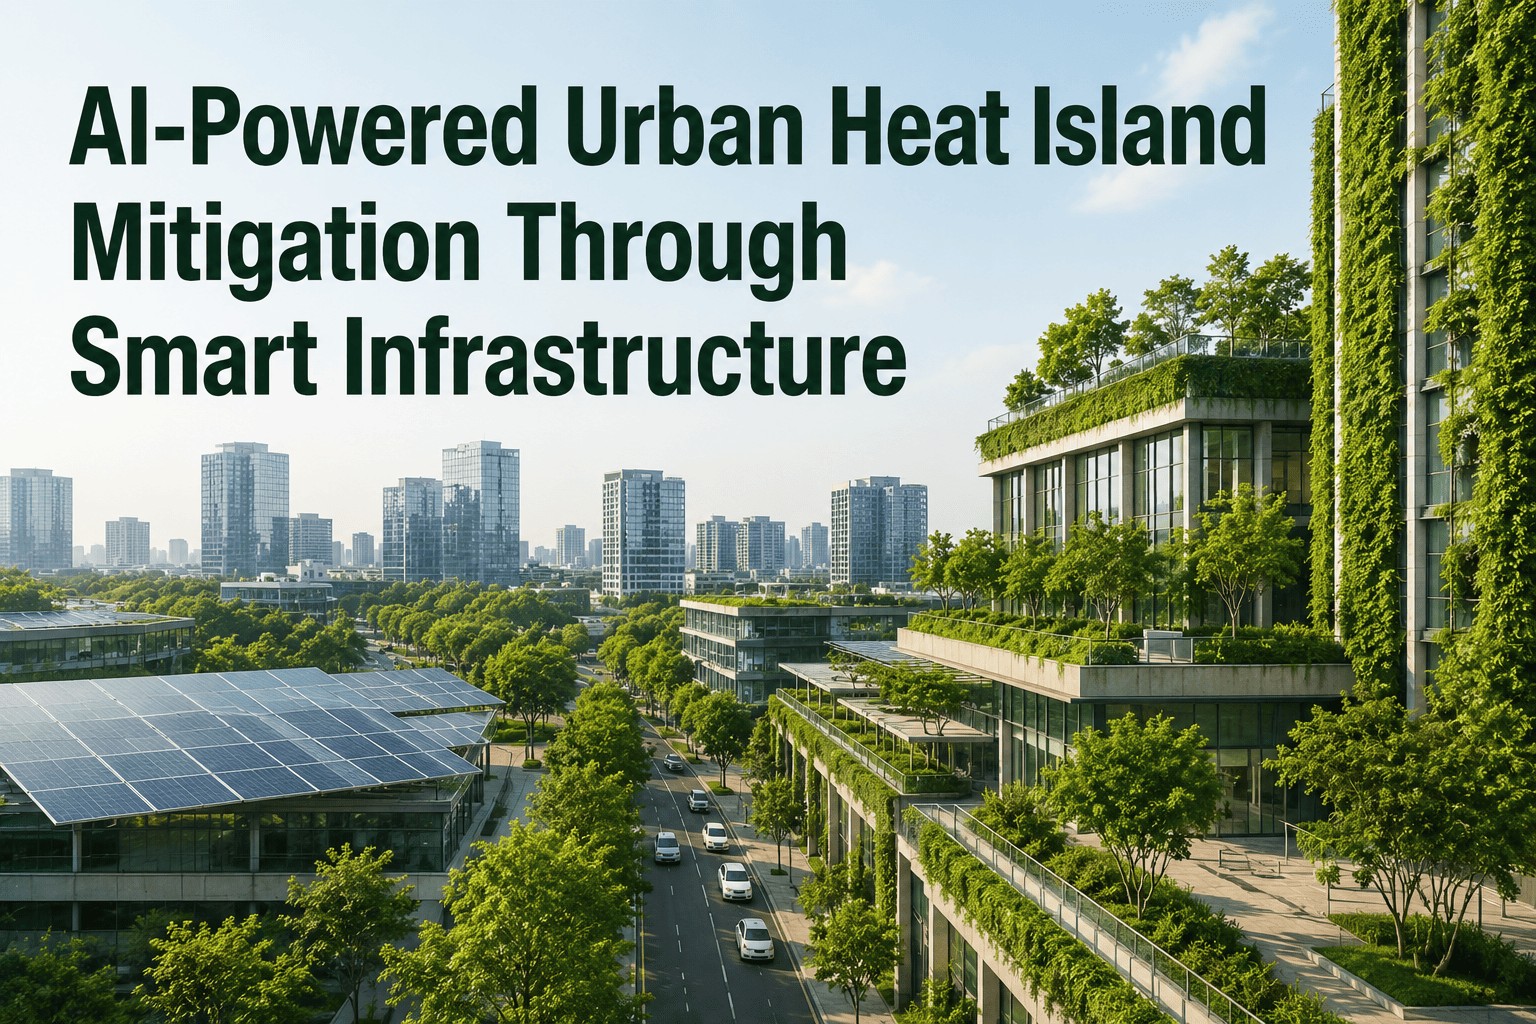
Walk through the centre of any major city on a summer afternoon and you will feel it — a wall of heat that simply does not exist five kilometres outside the city limits. This is the urban heat island (UHI) effect, and it is getting worse. Cities are warming at twice the global average rate. Urban centres already run 3–5°C hotter than their surrounding rural areas, and that gap widens every year as concrete footprints expand and green cover shrinks. The economic toll has reached an estimated $10 billion annually in heat-related losses globally. But a new generation of AI-guided infrastructure is changing how cities fight back — moving from guesswork greening to precision-targeted cooling interventions that actually work. This is the story of how AI urban heat island mitigation through smart infrastructure is becoming one of the most powerful tools in a city planner's arsenal.
What Actually Causes the Urban Heat Island Effect
The UHI effect is not mysterious — it follows directly from how cities are built. Asphalt roads and concrete buildings absorb solar radiation all day and release it slowly through the night, preventing the cooling that rural landscapes experience after sunset. Dense building clusters trap radiated heat between surfaces. Air conditioning units exhaust heat directly into streets. Impermeable surfaces eliminate the natural evaporative cooling that soil and vegetation provide. The result is a city that simply cannot shed heat the way an open landscape does.
Why Traditional Mitigation Falls Short — And Where AI Changes Everything
Cities have been planting trees and painting roofs white for decades. These strategies work — but only when deployed in the right places, at the right density, in the right combination. That is exactly where traditional planning fails. Without precise heat-mapping data, cities spray green interventions across areas that may already be cool while leaving the most heat-vulnerable blocks untouched. AI changes this entirely by turning raw sensor and satellite data into granular intervention maps that tell planners exactly where every dollar of cooling investment delivers maximum return.
The AI Technology Stack Behind Modern Heat Mitigation
Effective AI-guided UHI mitigation is not a single product — it is a layered system combining real-time sensing, satellite data fusion, machine learning prediction, and infrastructure management software. Each layer feeds the next, creating a continuous loop from data to action to outcome.
Cities That Are Getting This Right
The most compelling evidence for AI-guided UHI mitigation comes not from models or projections — but from cities that have already deployed data-driven cooling strategies and measured the outcomes.
The Role of Predictive Maintenance in Keeping Cooling Assets Performing
One of the least discussed — but most important — dimensions of AI-guided heat mitigation is what happens after green infrastructure is installed. Green roofs fail when irrigation systems malfunction. Urban trees die when soil moisture monitoring is absent. Cool pavements degrade when maintenance cycles are based on calendar schedules rather than actual surface condition data. AI predictive maintenance closes this gap, ensuring that every cooling asset continues to deliver its designed temperature benefit through its full operational life.
Frequently Asked Questions
How much can AI-guided green infrastructure actually reduce urban temperatures?
Research published across multiple studies shows that urban green infrastructure cools European cities by 1.07°C on average and up to 2.9°C in well-vegetated deployments. Achieving a 1°C drop in urban temperature requires a minimum 16% tree canopy cover according to published research. Cities like Medellín have documented 2°C reductions through targeted green corridor deployment. AI improves these outcomes by precisely identifying where vegetation achieves maximum cooling benefit — which varies significantly by urban morphology, climate type, and local heat-absorption patterns. Dry-hot cities need 30–40% vegetation coverage for peak cooling; humid-hot cities may need 60–80%. Without AI precision, cities risk over-investing in areas that are already adequately cool while underserving the most heat-vulnerable blocks.
What types of sensors are used to monitor urban heat islands in real time?
Modern UHI monitoring combines multiple sensor types: street-level thermal sensors and weather micro-stations capture ground-level air and surface temperatures across city blocks; satellite imagery (particularly land surface temperature data from Landsat and Sentinel missions) provides city-wide thermal mapping with high spatial resolution; air quality sensors monitor the secondary effects of heat including ozone and particulate formation; and soil moisture sensors in green infrastructure assets track irrigation system performance and vegetation health. These are transmitted over LoRaWAN, NB-IoT, or 5G networks to AI platforms that fuse the data streams into a unified heat risk dashboard — typically updated every 15–30 minutes.
How does AI help cities prioritize where to invest in cooling infrastructure?
AI heat models process multiple data layers simultaneously — land surface temperature, building density, vegetation coverage, impervious surface percentage, and demographic vulnerability data — to generate a prioritized map of intervention zones. Machine learning models, including the U-Net CNN architecture used in recent research, can identify the precise blocks where a given investment in trees, reflective surfaces, or green roofs produces the maximum cooling outcome. AI optimization algorithms can further simulate the combined effect of multiple interventions before any physical work begins, allowing city planners to test cooling scenarios digitally before committing capital budgets. This replaces the guesswork of traditional greening programs with data-driven allocation that can be defended to budget committees.
Can existing city infrastructure systems integrate with AI heat monitoring platforms?
Yes — modern AI infrastructure platforms like iFactory connect with existing municipal systems including CMMS, GIS, SCADA, and fleet management software via standard APIs and OPC-UA protocols. Integration does not require replacing existing systems; the AI layer sits on top of your current infrastructure. Sensor data flows into the platform read-only, so there is no risk to operational control systems. For cities with existing environmental sensor networks, iFactory can ingest that data directly and layer AI analytics on top within 30–60 days of integration setup. For cities starting fresh, iFactory supports sensor deployment from day one.
How does AI predictive maintenance help keep cooling assets performing year-round?
Green infrastructure cooling assets — irrigation systems, green roofs, cool pavement coatings — all degrade over time and require maintenance to sustain their designed thermal performance. AI predictive maintenance monitors the health signals of each asset continuously: soil moisture sensors detect irrigation system failures 10–14 days before vegetation stress becomes visible; surface temperature sensors track pavement albedo degradation and alert when recoating is needed; drainage sensors in green roofs flag waterlogging before it degrades insulation performance. When a threshold is exceeded, the platform automatically generates a work order in your CMMS — with asset location, fault type, recommended repair, and scheduling window. This prevents the silent degradation of cooling assets that is common in cities operating on calendar-based maintenance schedules.





