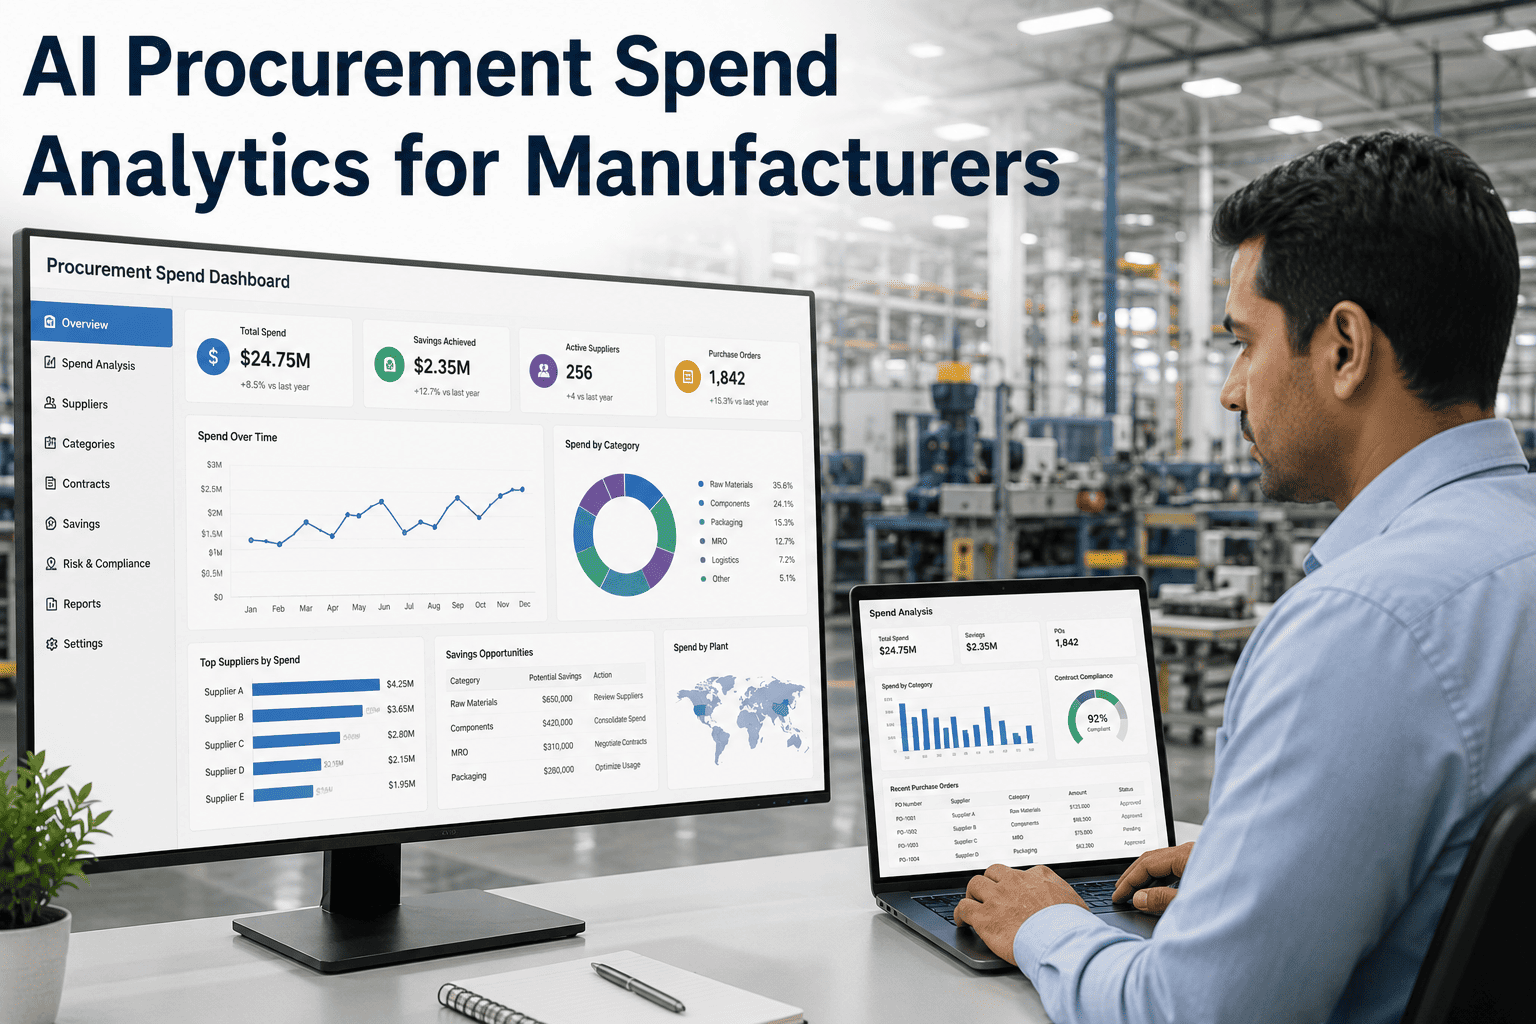
Ask most procurement directors what percentage of company spend is actually under managed contracts, and you will get an estimate, not a number. That gap between estimate and reality is where money disappears — maverick buying, duplicate vendors, missed volume discounts, and categories nobody has reviewed in three years. Manufacturers typically leave five to ten percent of total spend on the table simply because spend data is scattered across a dozen ERP instances, procurement systems, and spreadsheets that never talk to each other. Book a Demo with iFactory AI to see what your spend actually looks like once it is unified.
You Cannot Negotiate What You Cannot See.
iFactory AI consolidates spend data across every system you run and surfaces the category opportunities your team has been missing.
Why Spend Data Fragmentation Costs More Than It Looks Like
Most manufacturing organizations did not choose to fragment their spend data on purpose. It happened gradually, through acquisitions that never fully integrated their ERP systems, through plant-level purchasing autonomy that made sense operationally, and through procurement tools adopted category by category without a shared data model behind them. The result is a spend picture that lives in twelve different systems, none of which agree with each other on vendor names, category codes, or even currency conversion assumptions.
The cost of this fragmentation is not just an inconvenience for the annual spend review. It means the same vendor is negotiated with separately by three different plants, each getting a worse price than combined volume would justify. It means tail spend, the long list of low-dollar, high-frequency purchases, goes almost entirely unmanaged because no one has the consolidated view needed to even identify it as a category worth addressing. And it means sourcing teams are making category strategy decisions based on partial data, which is often worse than making them with no data at all, because partial data creates false confidence.
Procurement leaders often discover the true scope of this problem only when a board-level cost reduction mandate forces a full spend review, and even then the review typically takes months of manual reconciliation across finance, IT, and each plant's local purchasing team before a usable picture emerges. By the time that picture is ready, it is already several months stale, and the underlying fragmentation that created the problem in the first place has not actually been fixed, meaning the same exhausting reconciliation exercise will be required again at the next review cycle.
Three Dimensions Every Procurement Team Needs Unified
Spend analytics maturity is often described through a "spend cube" concept: the ability to slice total spend by vendor, by category, and by business unit simultaneously, and get a consistent answer no matter which angle you look from. Most manufacturers can answer one of these dimensions cleanly. Very few can answer all three at once.
Vendor View
Total spend per vendor across every plant, business unit, and purchasing system, revealing which suppliers you have real negotiating leverage with once volume is combined.
Category View
Spend grouped by what is actually being purchased, normalized against inconsistent category codes across systems, so MRO, raw materials, and indirect spend are each visible as a coherent category.
Business Unit View
Spend attributed correctly to the plant or division that incurred it, enabling fair benchmarking between sites and identifying which units are paying more for the same category.
The reason most organizations struggle to see all three dimensions at once comes down to how their systems were originally designed. ERP systems are typically built around the business unit and vendor dimensions for accounting purposes, while category management as a discipline is a relatively newer overlay that most legacy systems were never architected to support natively. Building a spend cube view therefore usually requires a layer that sits above individual source systems, pulling and reconciling data rather than depending on any single system to natively support the analysis procurement teams actually need.
The Four Most Common Sources of Missed Spend Opportunity
Maverick and Off-Contract Buying
Purchases made outside negotiated contracts, often because the buyer at a given plant did not know a corporate agreement existed for that category, or found it faster to order directly from a familiar local vendor.
Unmanaged Tail Spend
The long list of low-dollar purchases that individually look immaterial but collectively represent a significant share of total spend, and are almost never reviewed for consolidation opportunity.
Duplicate Vendors for the Same Category
Multiple plants independently sourcing the same or functionally equivalent items from different vendors, each negotiating a separate, smaller-volume price instead of one consolidated agreement.
Missed Volume Discount Tiers
Purchase volume that would qualify for a better contract tier if it were tracked and reported in aggregate, but instead sits fragmented across systems and never triggers the renegotiation it should.
How AI Turns Fragmented Spend Data Into Category Strategy
iFactory AI's spend analytics layer connects directly to the ERP, procurement, and accounts payable systems already in use across your plants, ingesting transaction-level data without requiring a manual export and reconciliation process. Vendor names are normalized automatically, so the same supplier operating under slightly different names in different systems is correctly consolidated into a single view. Category codes are mapped against a standard taxonomy, so spend that was previously invisible under inconsistent internal coding becomes comparable across the entire organization. From there, the system surfaces specific, ranked opportunities: which categories have the highest consolidation potential, which vendors are being paid inconsistent prices for the same item across plants, and which volume thresholds are close enough to a better contract tier to be worth renegotiating now.
This is not a static report generated once a year for a board presentation. The spend model updates continuously as new transactions flow in, meaning category managers can check whether a sourcing decision made last quarter is actually delivering the savings it promised, rather than waiting for the next annual spend review to find out.
The system also accounts for a reality that most spend analytics tools ignore: data quality across source systems is never uniform, and treating every input as equally reliable produces a distorted view. Transactions are weighted and flagged based on the completeness and consistency of the source system they came from, so a category manager reviewing a consolidation opportunity can see not just the recommendation but the confidence level behind it, distinguishing a well-supported finding from one that still needs manual verification before it becomes the basis for a renegotiation conversation with a supplier.
What Procurement Teams Recover After Spend Consolidation
Typical savings identified from consolidated category spend
Reduction in time spent manually reconciling spend reports
More tail spend categories brought under active management
Turning a Spend Cube Into a Category Strategy Roadmap
Visibility alone does not save money. What turns a unified spend view into actual savings is the discipline of converting each identified opportunity into a category strategy with an owner, a target, and a timeline. iFactory AI's platform ranks opportunities not just by dollar size but by how achievable they are given existing contract terms, vendor relationships, and internal switching costs, so category managers can prioritize the opportunities most likely to convert into real savings within a single fiscal year rather than chasing the largest number on the dashboard regardless of feasibility.
This ranked, feasibility-weighted approach also makes it easier to build internal buy-in. When a category manager can show finance and operations leadership a specific, data-backed opportunity, complete with the exact vendors, plants, and volume figures involved, the conversation shifts from a general request for more procurement headcount to a concrete business case with a defined return. That shift in the conversation is often what finally gets long-neglected tail spend categories the attention they have needed for years.
AI Procurement Spend Analytics — Common Questions
How long does it take to get a unified spend view across all our systems?
Initial data ingestion and vendor normalization across a typical multi-plant ERP environment usually completes within four to six weeks, depending on how many distinct source systems are involved. A preliminary spend cube view is often available earlier than that, with accuracy improving as more historical transaction data is reconciled. Our team can scope a timeline based on your specific system landscape.
Does this replace our existing procurement or ERP system?
No. The spend analytics layer sits on top of existing ERP, procurement, and accounts payable systems rather than replacing them, pulling transaction data through standard connectors. Your team continues using the systems already in place for actual purchasing and payment workflows.
How accurate is automated vendor normalization?
Automated normalization handles the large majority of vendor name variants, abbreviations, and formatting inconsistencies out of the box, using both exact and fuzzy matching against known vendor records. Ambiguous cases are flagged for a category manager to confirm rather than merged automatically, keeping the model accurate over time as it learns from those confirmations.
Can this identify savings in indirect and tail spend, not just direct materials?
Yes, and this is often where the largest untapped opportunity sits, since indirect and tail spend categories are the ones least likely to have received formal category management attention. The consolidated view makes it possible to see patterns across thousands of small transactions that would be invisible in any single plant's data.
What does implementation require from our procurement team?
Implementation primarily requires system access for data integration rather than manual data preparation, since the platform is built to work with transaction data as it naturally exists. Category managers are involved in reviewing flagged ambiguities and validating early opportunity findings. Book a Demo to walk through what onboarding looks like for your team.
Find Out What Your Fragmented Spend Data Has Been Hiding
Bring a sample export from one of your systems and see a live preview of what a unified spend cube reveals about your category opportunities.