Energy is quietly becoming the second-largest controllable line item on a plant's income statement, right behind labor, yet most energy managers are still working from a monthly utility bill and a spreadsheet built two years ago. Compressors run at fixed pressure regardless of actual demand, HVAC systems condition empty zones on the night shift, and motors drift out of their efficient operating band for months before anyone notices the drift in the invoice. By the time a variance shows up in the accounting close, the plant has already paid for it. iFactory's AI-powered energy management system closes that gap by turning every meter, sensor, and utility feed into a continuously monitored signal, and you can book a demo to see it running against your own facility's load profile.
Your Plant Is Paying for Energy It Never Actually Uses — AI Finds That Gap and Closes It Automatically
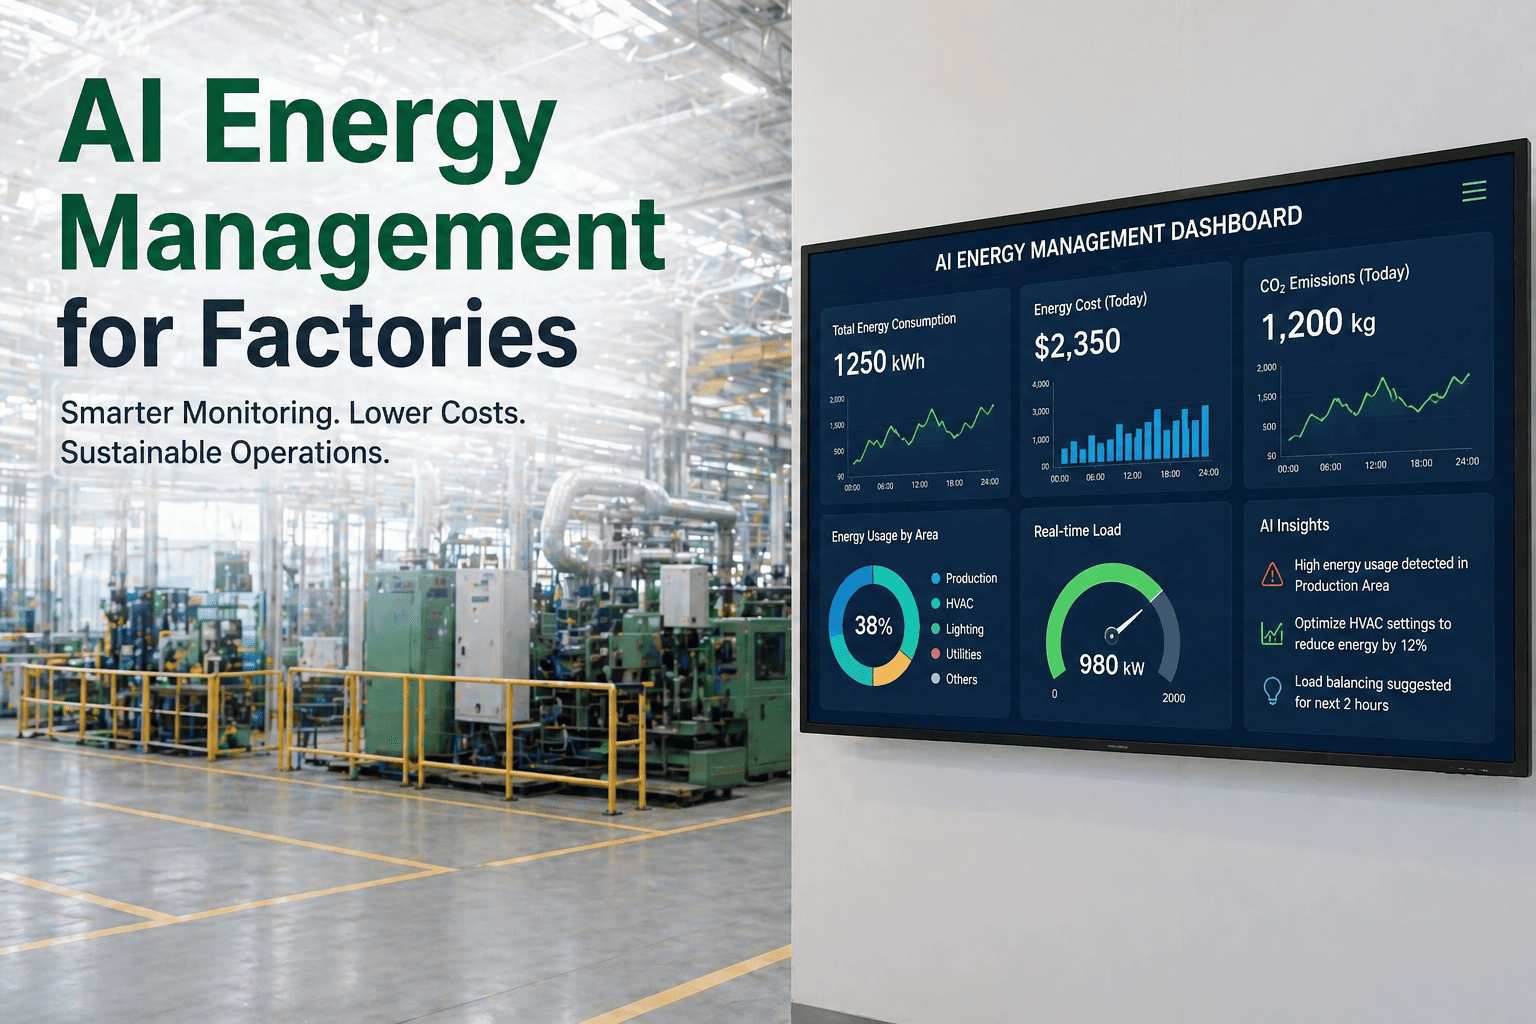
iFactory's AI energy management platform continuously tracks consumption across compressed air, HVAC, motors, lighting, and process heat, flags waste as it happens, and converts every anomaly into a ranked, dollar-quantified action for your team.
Energy Has Quietly Become One of the Largest Uncontrolled Costs on Your P&L
Rising utility rates, tightening emissions regulations, and growing ESG reporting requirements have turned energy from a fixed overhead line into a strategic risk that finance teams now watch closely. The four figures below describe the size of the gap between what most plants pay for energy and what they actually need to pay, based on industry benchmarks across discrete and process manufacturing facilities.
Five Places Energy Waste Hides in Plain Sight Until an AI Model Points Directly at It
Energy waste rarely announces itself. It accumulates quietly across systems that everyone assumes are working correctly because nothing has visibly failed. Expand each item below to see how iFactory's AI isolates that specific waste pattern from the surrounding noise of normal plant operation.
A single quarter-inch compressed air leak at 100 psi can waste enough energy over a year to run a small production line. Most plants operate compressor systems sized for a peak demand they rarely hit, running excess capacity at partial load around the clock. iFactory's AI continuously compares pressure, flow, and amperage draw against expected production demand to flag leak signatures and staging inefficiency within days.
Building management systems typically run on fixed time schedules that were configured years ago and never revisited as shift patterns changed. The AI cross-references occupancy sensors, production schedules, and zone-level temperature data to identify HVAC runtime that has no corresponding production or occupancy justification.
Motors and VFDs lose efficiency gradually as bearings wear, belts slip, and load conditions drift from their original design point, but the degradation is invisible on a standard amp reading. iFactory's AI tracks motor current signatures and power factor over time to detect this drift long before it shows up as a maintenance failure or a spike in the utility bill.
Many utility tariffs charge based on the single highest 15-minute demand spike in a billing period, meaning one poorly timed simultaneous startup of compressors, chillers, and production lines can set the demand charge for the entire month. The AI models startup sequencing across equipment to smooth these coincident peaks automatically.
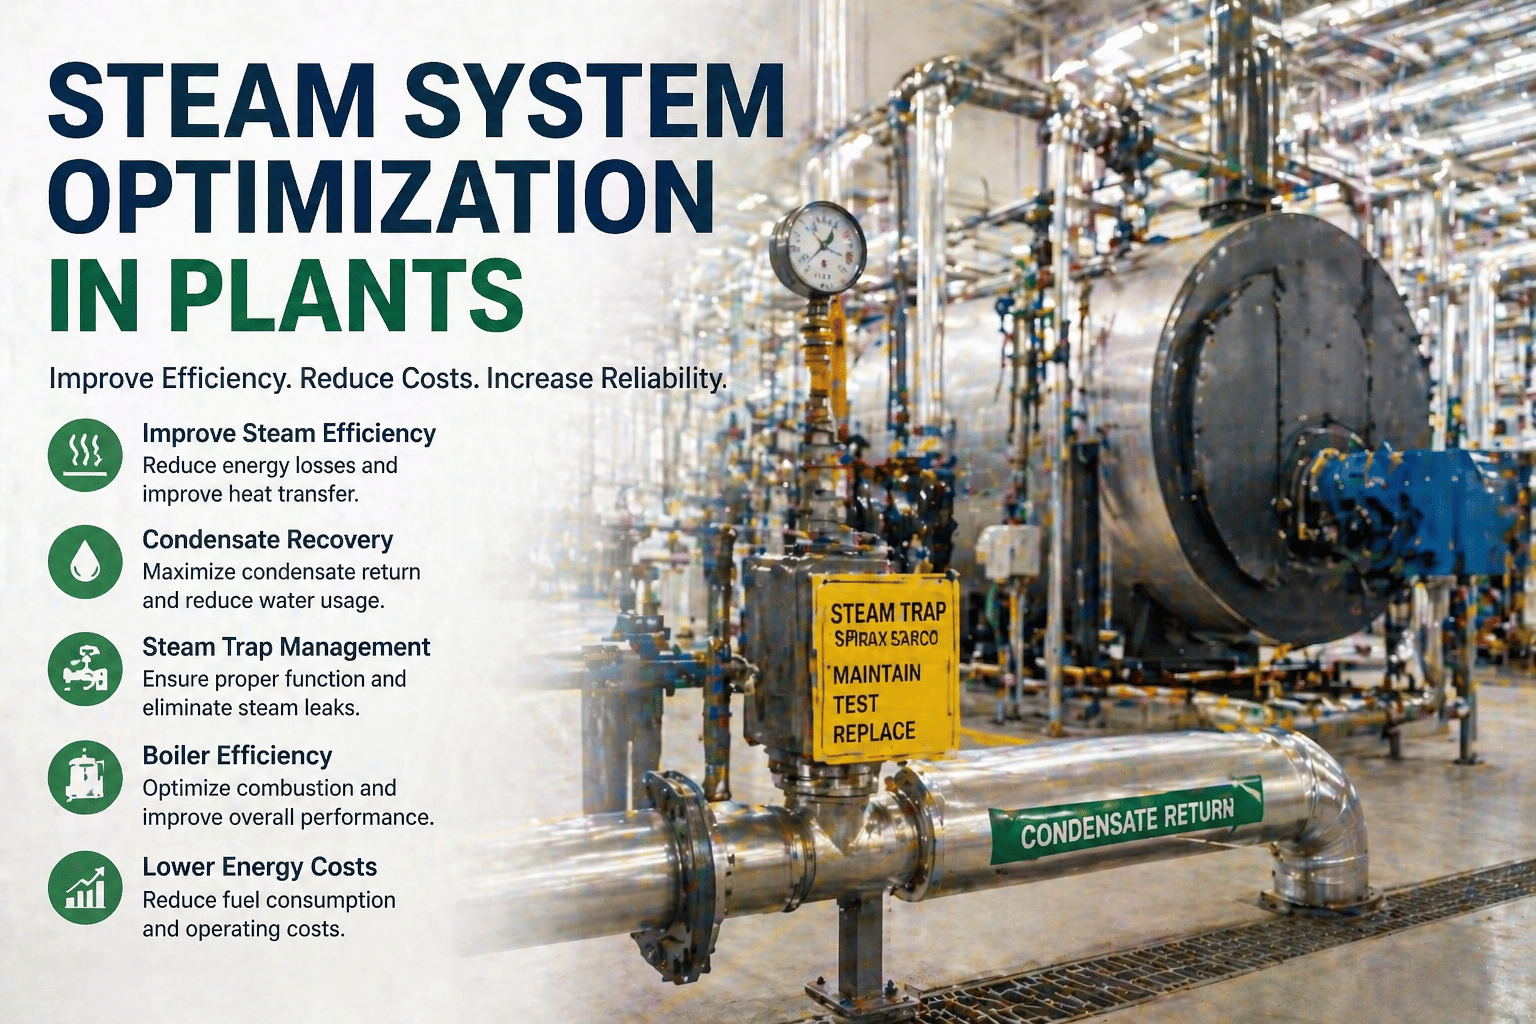
Failed steam traps and degraded insulation on process heating systems lose energy continuously and rarely trigger any alarm because the process still runs, just less efficiently. iFactory's AI monitors temperature differentials and fuel-to-output ratios to surface these losses before they compound into a major seasonal cost increase.
From Raw Meter Data to a Ranked Action List — The AI Energy Management Pipeline
iFactory's energy management platform processes data through four connected stages that run continuously, so the system reflects what is happening on the floor right now rather than what happened during last month's billing cycle.
Unified Metering and Data Ingestion
Sub-metering data, utility interval data, SCADA tags, and BMS points are ingested into a single time-series model at intervals as tight as one minute, with automatic unit normalization and gap-filling for intermittent connectivity.
Expected Consumption Modeling
The AI builds a dynamic baseline for every meter and asset that predicts expected consumption given current production volume, ambient conditions, and shift schedule, so a legitimate increase in output is never mistaken for waste.
Anomaly Detection and Root Cause Diagnosis
Actual consumption is compared continuously against the expected baseline, and any sustained deviation is classified against a library of known waste patterns — leak, drift, scheduling error, or equipment degradation — with a quantified dollar and kWh impact.
Prioritized Action and Compliance Reporting
Every flagged anomaly is ranked by annualized savings potential and implementation effort, feeding a single action list for the energy team alongside automated reporting formatted for ISO 50001 and ESG disclosure requirements.
Which Energy Systems Deliver the Fastest Payback When AI Takes Over Optimization
Not every energy system offers the same optimization potential, and prioritizing the highest-yield systems first is how energy managers build a credible savings case for leadership. The figures below reflect typical AI-driven savings achieved on each system category during the first year of deployment.
Every Percentage Point of Energy Waste Is a Percentage Point of Margin You Are Leaving on the Table
iFactory's AI energy management platform turns your existing meters and sensors into a continuously monitored savings engine, ranked by dollar impact, with no changes required to your production process. Book a demo and see the AI analyzing live consumption data from your own facility.
Manual Energy Management vs AI-Powered Energy Management — A Direct Comparison
Energy managers evaluating a move from spreadsheet-based tracking to an AI-driven platform need to see the operational difference in concrete terms, not just a percentage promise. The table below compares the two approaches across the capabilities that most directly affect cost control and compliance reporting.
| Capability | Manual / Spreadsheet Tracking | iFactory AI Energy Management |
|---|---|---|
| Data Collection Frequency | Monthly utility bill or periodic meter walk | Continuous, down to one-minute intervals |
| Anomaly Detection Time | 7 to 14 days, often at month-end close | Hours to a few days from onset |
| Peak Demand Visibility | Visible only after the bill arrives | Real-time forecast with pre-emptive load shifting |
| Cost Allocation by Line or Shift | Estimated using rough square-footage splits | Actual sub-metered allocation by asset and shift |
| ISO 50001 / ESG Reporting | Manually compiled, weeks of preparation | Automated, continuously updated reporting |
| Typical Annual Savings Identified | 2 to 4 percent through periodic audits | 10 to 15 percent in year one |
Quantified Results From AI Energy Management Deployments Across Manufacturing Facilities
The figures below reflect measured outcomes from AI-driven energy management deployments across discrete and process manufacturing sites, each tracked over a minimum six-month period following implementation and validated against utility billing data.
Your Path From First Meter Connection to ISO 50001-Aligned Reporting
Energy managers do not need a multi-year initiative to start capturing savings. iFactory's deployment model is structured in five stages so that the first identified savings opportunity typically appears within the first month of onboarding.
Baseline and Metering Audit
Existing meters, sensors, and utility interval data are catalogued and connected, establishing a validated consumption baseline for every major asset and system.
Real-Time Data Integration
SCADA, BMS, and sub-metering feeds are streamed into iFactory's platform on a continuous basis, replacing the monthly bill as the primary source of truth.
AI Model Calibration
The AI trains expected-consumption models against your specific production schedule, ambient conditions, and equipment mix to minimize false anomaly alerts.
Pilot Optimization on Priority Systems
The highest-yield systems identified in the audit — typically compressed air and motors — are optimized first to build a fast, credible savings case.
Facility-Wide Rollout and Continuous Reporting
Optimization extends across the full facility with automated dashboards and compliance-ready reporting for ISO 50001 and ESG disclosure requirements.
Common Questions From Energy Managers About AI-Powered Energy Management
The Data to Cut Your Energy Bill Already Exists on Your Plant Floor — It Just Needs to Be Heard
Every compressor, chiller, motor, and lighting circuit in your facility is already generating the signal needed to identify waste, but that signal is scattered across systems that were never designed to talk to each other and is reviewed, at best, once a month. The 20 to 40 percent waste figure common across manufacturing is not a hypothetical number; it is the accumulated result of thousands of small inefficiencies that no spreadsheet review can catch in time to matter.
iFactory's AI energy management platform continuously reads that signal, separates legitimate production-driven consumption from genuine waste, and delivers a ranked, dollar-quantified action list your team can act on the same day an anomaly appears. The result is a faster path to the 10 to 15 percent year-one savings that leading manufacturers are already capturing, along with the audit-ready reporting your ISO 50001 and ESG programs require. Book a demo to see iFactory's AI analyzing live energy data from your own facility.
Stop Waiting for the Utility Bill to Tell You What Went Wrong Last Month
iFactory's AI energy management platform monitors every meter in your facility continuously, flags waste within days instead of weeks, and hands your team a ranked action list quantified in real dollars. Book a demo and see the AI classifying energy waste across your own plant in real time.