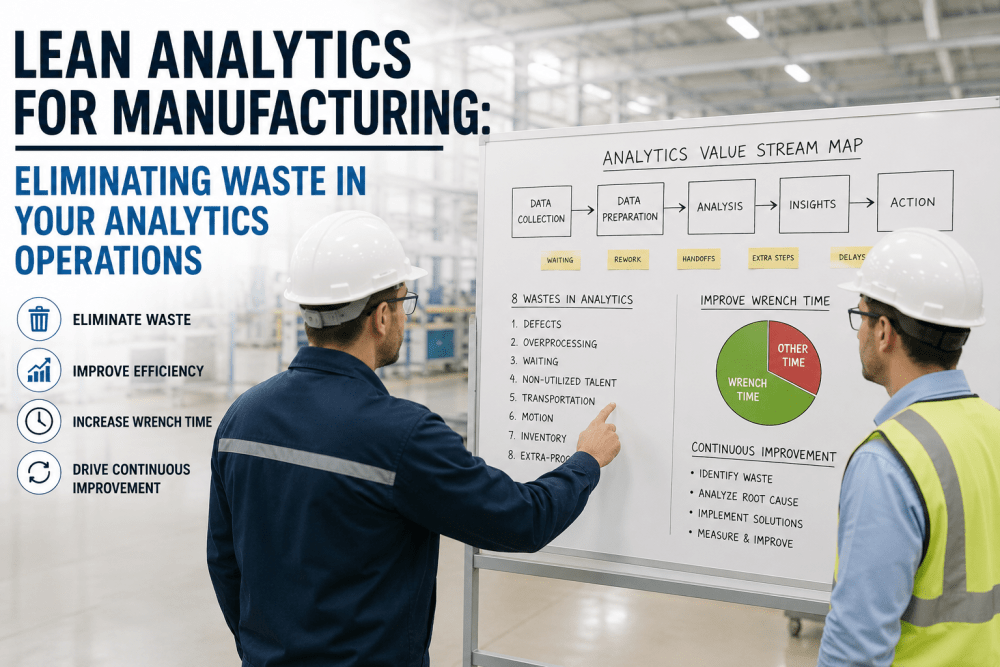
Lean manufacturing principles have transformed production floors for decades — but applying lean thinking to your analytics and maintenance operations is where modern manufacturers are now unlocking the next wave of efficiency gains. Studies show that maintenance technicians spend only 25-35% of their shift on actual wrench time, with the remainder consumed by waiting, searching, paperwork and travel. Lean analytics methodology — combined with intelligent CMMS platforms — eliminates these eight forms of waste and pushes wrench time above 65%. Book a Demo to see how iFactory AI applies lean principles across every layer of your analytics workflow.
Cut Operational Waste From Your Analytics Workflow Today
iFactory AI helps manufacturers identify the 8 wastes in maintenance and analytics — then eliminate them with intelligent automation, mobile workflows, and connected data.
What Is Lean Analytics in Manufacturing — and Why It Matters Now
Lean analytics applies the principles of the Toyota Production System — eliminate waste, maximize value, drive continuous improvement — to the data and operational workflows that govern modern manufacturing plants. While traditional lean focused on the production line itself, lean analytics targets the invisible inefficiencies buried inside maintenance schedules, inspection routines, work order processing, parts inventory management, and shift handover protocols. The result is a manufacturing operation where every analytics activity creates measurable value — and every form of waste is systematically identified and eliminated.
For U.S. manufacturers facing rising labor costs, supply chain volatility, and pressure to hit operational excellence benchmarks, lean analytics is no longer optional. It is the framework that connects shop-floor reality with executive-level KPIs like OEE, MTBF, and total cost of ownership. iFactory AI was built from the ground up to operationalize lean analytics principles — turning every work order, every inspection, and every shift logbook entry into a continuous stream of waste-reduction intelligence.
The 8 Wastes of Analytics Operations: Where Your Plant Is Losing Hours Every Day
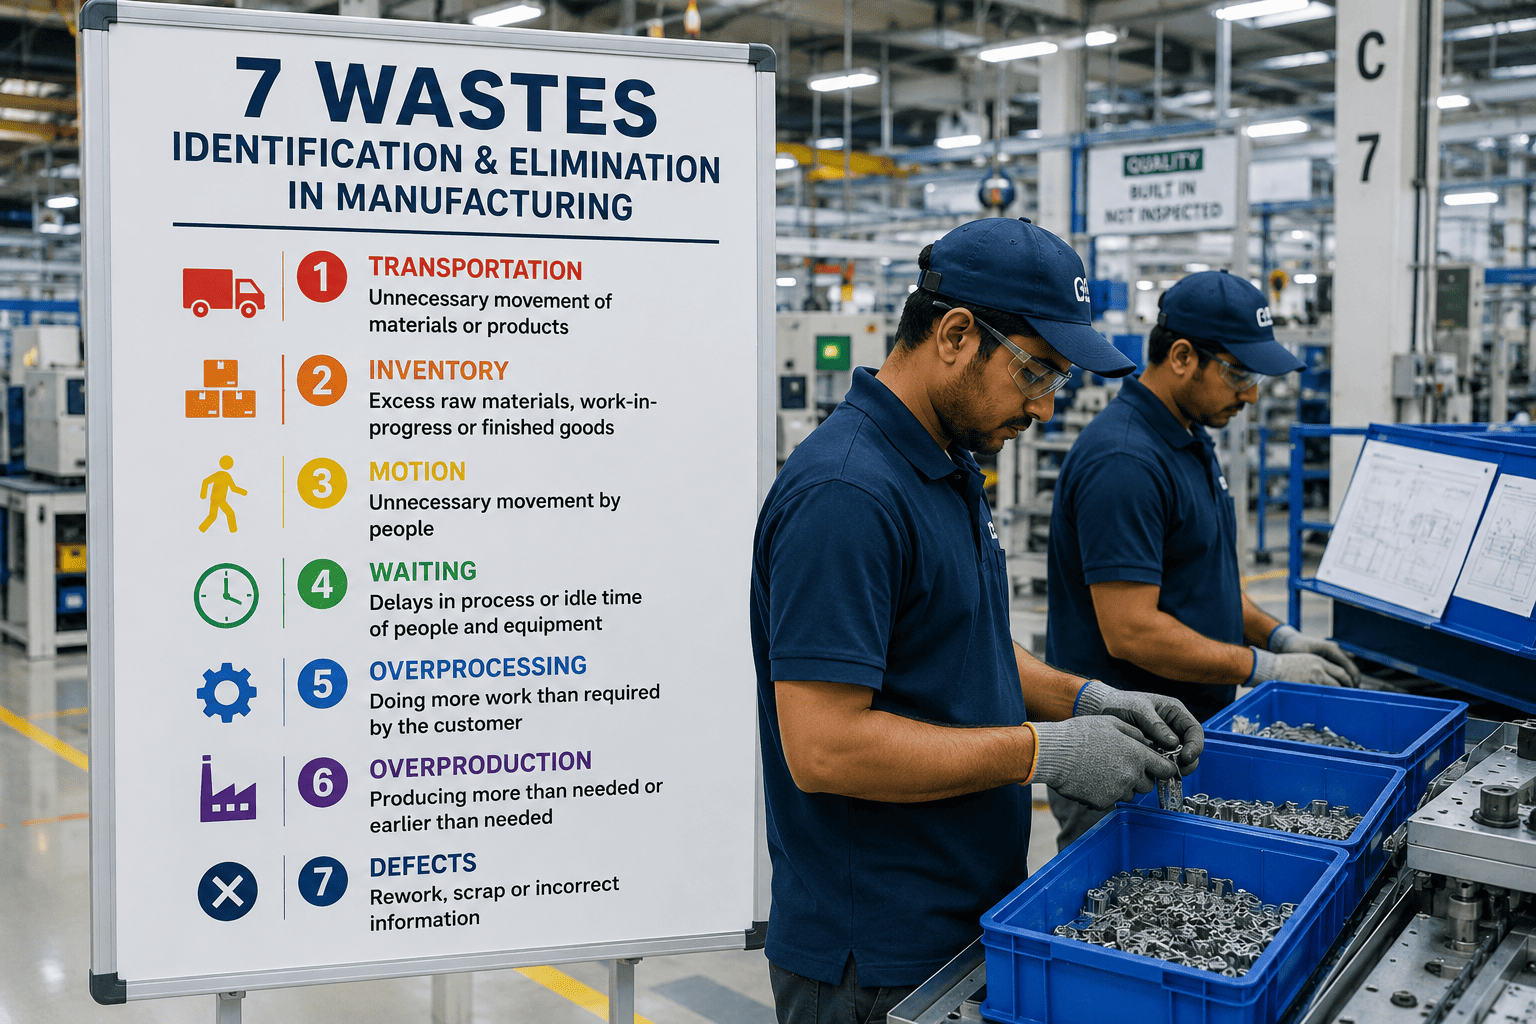
The classic Toyota model identifies seven wastes — transport, inventory, motion, waiting, overproduction, over-processing, and defects — with an eighth (underutilized talent) added in modern interpretations. When mapped to analytics and maintenance operations, each of these wastes manifests in ways that are remarkably consistent across U.S. manufacturing plants. Recognizing them is the first step toward eliminating them with a structured CMMS platform like iFactory AI.
Waiting
Technicians waiting for work order approvals, spare parts deliveries, equipment access, or supervisor decisions. Eliminated through automated work order routing, real-time parts inventory visibility, and mobile approval workflows.
Motion
Excess walking between control rooms, parts cribs, and asset locations to retrieve information, tools, and documentation. Mobile-first CMMS access on tablets and smartphones eliminates the need to return to fixed terminals.
Transport
Unnecessary movement of parts, tools, and printed documents across the facility. Smart Document Management and parts and inventory modules eliminate runs to filing cabinets and central tool rooms.
Inventory
Excess spare parts tied up in storerooms — or critical parts missing when needed. Stock Inventory Control with min/max thresholds, automated reorder triggers, and vendor management drives this waste to near zero.
Over-Processing
Redundant inspections, duplicate paperwork, signing the same form three times. Smart inspection management with conditional logic and electronic signatures eliminates over-processing throughout the audit chain.
Overproduction
Performing time-based PMs that aren't actually needed — replacing parts before end-of-life or running calibrations more frequently than required. Predictive Maintenance triggers work only when condition data warrants it.
Defects
Rework due to incomplete repairs, missing documentation, or incorrect spare parts installed. Quality Control Management with standardized procedures and asset-specific job plans eliminates rework cycles.
Unused Talent
Skilled technicians performing data entry, paperwork, and tasks that don't require their expertise. Automated Analytics Reporting and shift logbook automation reclaim hours of skilled technician time every week.
Value Stream Mapping for Analytics Workflows: A Step-by-Step Process
Value Stream Mapping (VSM) is the most powerful diagnostic tool in the lean toolkit — and when applied to analytics workflows, it surfaces inefficiencies that operations leaders never knew existed. A typical work order journey from request to closeout passes through 12-18 process steps, but only 3-5 of those steps actually create value. The remaining 70-80% is pure waste. iFactory AI's Manufacturing Execution System digitizes the entire value stream so VSM becomes a continuous, data-driven exercise rather than a once-a-year workshop. Book a Demo to see your work order value stream mapped in real time.
Map the Current State
Document every step in a work order's lifecycle — request submission, approval routing, parts allocation, scheduling, execution, signoff, and closeout. iFactory AI auto-captures timestamps for each step, giving you a precise current-state map without manual data collection.
Identify Value-Add vs Non-Value-Add Steps
Classify each step as value-adding (actual repair work), necessary non-value-adding (regulatory paperwork), or pure waste (waiting for approval). Most plants discover 60-70% of work order lead time is pure waste once mapped honestly.
Calculate Process Cycle Efficiency
PCE = Value-Add Time ÷ Total Lead Time. Manufacturing plants without lean analytics typically score 8-15%. Plants running iFactory AI with optimized workflows routinely achieve 40-55% PCE on routine maintenance work orders.
Design the Future State
Eliminate waiting steps with auto-approvals for low-risk work, parallel-process inspections and parts kitting, and remove duplicate signoffs. iFactory AI workflow designer lets you model the future state and deploy it across all sites instantly.
Sustain with Continuous Measurement
Lean is not a one-time event. iFactory AI's OEE Analytics and analytics reporting tools continuously monitor process cycle efficiency, surfacing new bottlenecks as they emerge so kaizen events stay focused on the highest-impact wastes. Book a Demo to see continuous VSM in practice.
Applying 5S, Kaizen, and Standard Work to Analytics Operations
The classic lean toolkit — 5S, kaizen, standard work, poka-yoke, andon — was designed for the production line. But each of these tools translates directly to analytics operations with significant impact. The difference: when applied through a connected CMMS platform like iFactory AI, these tools become digital, scalable, and continuously enforced rather than dependent on shop-floor discipline alone.
| Lean Tool | Production Floor Application | Analytics Operations Application | iFactory AI Module |
|---|---|---|---|
| 5S | Tool shadow boards, color-coded zones | Standardized work order templates, organized digital asset libraries, sorted spare parts catalogs | Smart Document Management |
| Kaizen | Daily improvement events on the line | Weekly review of work order cycle times and PM completion rates with structured improvement actions | Automated Analytics Reporting |
| Standard Work | Documented work instructions per station | Asset-specific job plans, calibration procedures, and safety checklists attached to every work order | Work Order Management |
| Poka-Yoke | Physical error-proofing fixtures | Mandatory fields, conditional logic, and barcode verification preventing wrong parts or skipped steps | Inspection Management |
| Andon | Visual signals when line stops | Real-time alerts to supervisors when work orders exceed standard time or critical PMs are overdue | Production Monitoring |
| Jidoka | Autonomation, machines stop on defect | Predictive sensors auto-create work orders when condition thresholds breached — no human escalation needed | Predictive Maintenance |
| Heijunka | Production leveling and scheduling | PM workload balancing across shifts and technicians to avoid peaks and idle periods | Preventive Maintenance |
How Lean Analytics Improves Wrench Time From 30% to 65%+
Wrench time — the percentage of a technician's shift spent actively performing maintenance work — is the single most important productivity metric in any analytics operation. Studies from SMRP (Society for Maintenance and Reliability Professionals) consistently show that U.S. manufacturing plants without lean discipline operate at 25-35% wrench time. Best-in-class plants applying lean analytics through integrated CMMS platforms routinely exceed 65% wrench time. The improvement comes from systematically eliminating the time technicians spend on non-value-adding activities.
Eliminate Travel Time
Mobile work order delivery means technicians receive their next assignment, parts list, and job plan on a tablet at the asset location — eliminating return trips to control rooms and supervisor stations. iFactory AI's mobile CMMS recovers 45-90 minutes of wrench time per technician per shift.
Eliminate Parts-Search Time
Parts and inventory integration shows real-time stock levels, bin locations, and reorder status — eliminating wasted trips to the parts crib for items that are out of stock. Pre-kitted parts delivery aligned with scheduled work orders is the standard for lean-mature plants.
Eliminate Paperwork Time
Voice-to-text work order completion, automated time logging, and electronic signoffs eliminate the 30-60 minutes per shift technicians spend on manual data entry. Shift Logbook auto-populates from completed work orders — no duplicate documentation required.
Expert Review: Why Reliability Engineers Are Choosing Connected Lean Platforms
Senior reliability engineers and continuous improvement leaders at U.S. manufacturing plants are increasingly aligned on one observation: lean analytics gains plateau quickly without a connected digital platform. Whiteboard kaizen events and paper-based 5S audits generate initial wins, but sustained waste elimination requires the kind of continuous, granular data that only an integrated CMMS like iFactory AI can deliver. Below is a summary of the perspectives most frequently shared by reliability and lean leadership in modern manufacturing operations. Book a Demo to discuss your plant's specific waste profile with our team.
Your 90-Day Lean Analytics Implementation Timeline
Lean analytics is not a multi-year transformation — when supported by a modern platform, meaningful waste reduction is visible within the first 90 days. The roadmap below reflects the deployment cadence iFactory AI follows with U.S. manufacturing clients across discrete, process, and FMCG operations.
Baseline Measurement & Asset Onboarding
Onboard your asset hierarchy into iFactory AI, configure work order types, and capture baseline metrics — current wrench time, PM compliance, MTBF, and work order cycle time. This baseline becomes the foundation for measuring lean improvements.
Value Stream Mapping & Waste Identification
Conduct VSM workshops on the top 3 highest-volume work order categories. Use iFactory AI's process timestamps to quantify each waste source — waiting, motion, paperwork — and define elimination priorities.
Workflow Redesign & Standard Work Deployment
Deploy standardized job plans, mobile-first workflows, and automated approval routing. Activate predictive triggers on critical assets to eliminate over-maintenance. Push wrench time toward the 50% threshold.
Continuous Kaizen & Performance Lock-In
Establish weekly kaizen reviews powered by automated analytics reporting. Refine SOPs based on real performance data. Most clients hit 60-65% wrench time and reduce work order lead time by 40% within this window.
Lean Analytics: The Operational Excellence Multiplier for Modern Manufacturers
Lean analytics is the bridge between traditional lean manufacturing — built for the production line — and the data-rich, sensor-connected, mobile-enabled reality of modern manufacturing operations. The 8 wastes still exist; they have simply migrated from the assembly line into maintenance workflows, inspection routines, and analytics processes that operate invisibly in the background of every plant. Manufacturers that systematically identify and eliminate these wastes — using value stream mapping, 5S, kaizen, and standard work principles deployed through a connected CMMS platform — consistently outperform their peers on wrench time, OEE, MTBF, and total maintenance cost.
iFactory AI was engineered to operationalize lean analytics across every layer of your manufacturing operation. From predictive maintenance and work order automation to OEE analytics and shift logbook digitization, every module is designed to eliminate one or more of the 8 wastes — turning continuous improvement from a quarterly initiative into the default operating mode of your plant. Whether you operate a single discrete manufacturing facility or a multi-site FMCG network, lean analytics with iFactory AI delivers measurable waste reduction within 90 days and sustained operational excellence over the long term.
Start Your Lean Analytics Transformation in 90 Days
iFactory AI delivers a lean-by-design CMMS platform purpose-built for U.S. manufacturers. See your work order value stream mapped, your wrench time benchmarked, and your waste elimination roadmap built — in a single live demo session.
Frequently Asked Questions: Lean Analytics for Manufacturing
What is the difference between lean manufacturing and lean analytics?
Lean manufacturing applies waste-elimination principles to the production line itself — focusing on flow, takt time, and direct value creation. Lean analytics applies the same principles to the data-driven and maintenance workflows that support production: work order processing, inspection routines, parts inventory, shift handovers, and analytics reporting. Both share the same DNA but target different value streams within your plant.
How quickly can manufacturers see results from lean analytics implementation?
Most U.S. manufacturers see measurable waste reduction within the first 30-45 days of deploying a connected CMMS platform like iFactory AI. Wrench time improvements of 15-25 percentage points are typical within 90 days, and work order lead time reductions of 40% are common in the same window when value stream mapping is conducted properly during onboarding.
Do we need to complete a full lean transformation before adopting lean analytics?
No. Lean analytics can be deployed independently of broader lean initiatives — and in fact, many manufacturers find that lean analytics generates the early wins and data visibility that fuel wider lean transformation efforts. The 8 wastes in analytics operations exist whether or not your production floor has been formally optimized, so there is no prerequisite to begin elimination work.
How does iFactory AI specifically support kaizen and continuous improvement?
iFactory AI's automated analytics reporting surfaces deviations in work order cycle time, PM compliance, MTBF, and OEE in real time — providing the granular data that effective kaizen events require. The platform also enables structured improvement workflows: identify the waste, propose a counter-measure, implement, measure, and standardize — all tracked within the same system that captures the baseline data.
What is a realistic wrench time benchmark for U.S. manufacturing plants in 2026?
The SMRP wrench time benchmark for world-class operations is approximately 65%, while the industry median sits between 30% and 40%. Plants running a modern, mobile-first CMMS with predictive maintenance triggers, parts kitting, and standardized digital job plans routinely achieve 60-70% wrench time. Anything below 45% indicates significant lean opportunity worth investigating.