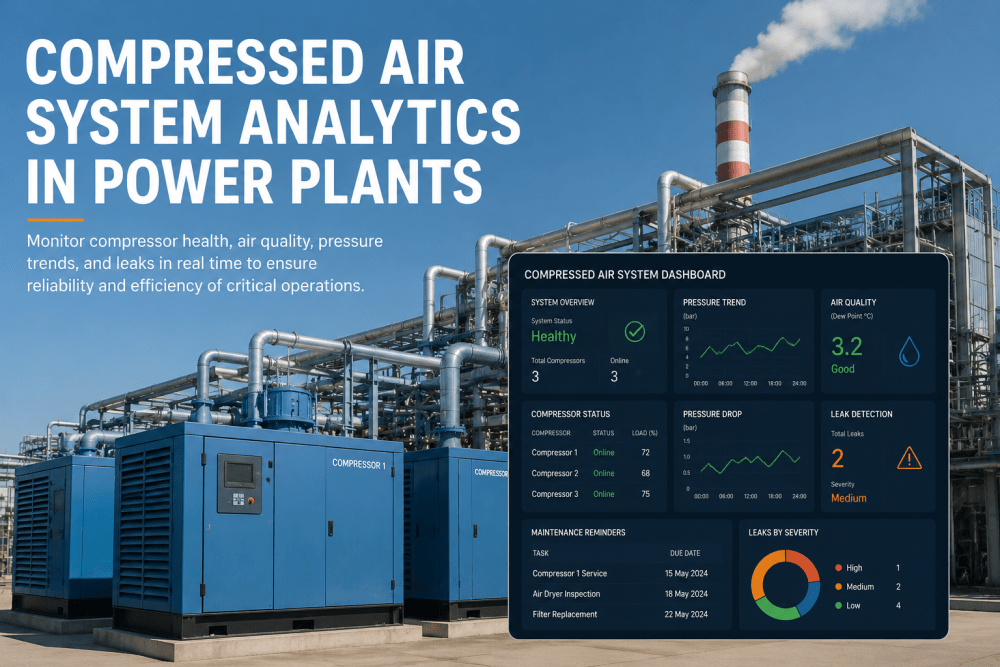
Compressed air is the most invisible utility at a power plant — and one of the most consequential when it fails. Instrument air systems, service air headers, and control air supplies touch nearly every critical function at a generation facility: pneumatic actuator operation, control valve positioning, turbine purge and sealing systems, and emergency protection circuit operation all depend on a continuous, clean, dry supply of compressed air at stable pressure. At most U.S. power plant monitoring infrastructure for compressed air is thinner than for almost any other utility system — a few pressure gauges, a runtime hour accumulator, and a scheduled oil change interval managed in the CMMS. That monitoring gap is invisible during normal operations and immediately obvious during a compressed air failure at the worst possible moment: startup, peak load demand, or a grid emergency event requiring rapid dispatch response.
AI-driven compressed air system analytics closes that gap by doing what the DCS alarm system cannot: correlating pressure drop trends across distribution headers, tracking compressor performance degradation against operating hours and load profile, flagging moisture ingress signatures in dryer performance data, and identifying leak accumulation patterns from compressor runtime data before header pressure destabilizes. For U.S. power generation facilities where a loss of instrument air constitutes a plant trip scenario, this is not a convenience capability — it is a reliability and availability protection investment with a measurable return calculated against the forced outage costs that compressed air failures generate every operating year.
Compressed Air Analytics Guide 2026
Compressed Air System Analytics for Power Plants
AI-driven compressor service tracking, air dryer performance monitoring, pressure drop trending, and leak detection — purpose-built for instrument air reliability at U.S. generation facilities
$420K
Avg. Cost of Plant Trip from Instrument Air Loss
68%
Of Compressed Air Failures Have Detectable Precursors
Why Compressed Air System Failures Are So Costly — and So Preventable
The compressed air system occupies an unusual position in the power plant reliability hierarchy. It is not the primary energy conversion pathway — it does not spin the turbine or generate the megawatts — so it rarely receives the monitoring investment directed at gas turbines, HRSGs, and generators. But it is a dependency for every system that does. Control valves that position incorrectly because instrument air pressure dropped 5 psi below the minimum control threshold will cause process upsets that trip a unit just as effectively as a turbine mechanical failure. The difference is that a turbine failure is typically preceded by detectable vibration, temperature, and performance anomalies. A compressed air header failure often looks normal until the moment it does not.
$420K
Average forced outage cost from instrument air system failure at a 300 MW combined cycle facility
23%
Of compressed air failures attributed to air dryer performance degradation causing moisture contamination
$85K
Average annual energy cost of a 20–30% system leak rate at a typical power plant compressed air system
41%
Of compressor maintenance interventions are performed either too early or too late under calendar-based schedules
The four failure pathways that generate the most compressed air system forced outage events at U.S. power plants are compressor mechanical degradation, air dryer performance deterioration, distribution system leak accumulation, and receiver vessel pressure margin erosion — all of which develop gradually over weeks to months and produce measurable sensor signatures long before failure. AI-driven analytics detects all four pathways continuously and generates condition-based maintenance recommendations before header pressure falls below the minimum operating threshold for instrument air-dependent protection systems.
Compressor Mechanical Degradation
Bearing wear, valve degradation, and inter-stage cooling efficiency loss all reduce compressor output capacity and increase specific power consumption — detectable through discharge temperature trending, power factor analysis, and inter-stage pressure ratio monitoring before capacity falls below demand.
HIGH CONSEQUENCE
Air Dryer Performance Deterioration
Refrigerated and desiccant dryer degradation allows moisture into the distribution system, causing pneumatic actuator corrosion, control valve seat damage, and freeze events in cold-weather pipe runs. Dew point excursions are detectable hours before downstream moisture events occur.
HIGH CONSEQUENCE
Distribution System Leak Accumulation
Air leaks at fittings, valve packing, and connection points accumulate gradually — each individually minor but collectively capable of exceeding compressor supply capacity. Compressor runtime trending and header pressure baseline drift provide early quantification of total leak volume before supply margin is exhausted.
MEDIUM CONSEQUENCE
Receiver Vessel Pressure Margin Erosion
Gradual reductions in receiver vessel storage capacity — from increased demand, reduced compressor output, or expanding leak rates — erode the pressure margin available to handle demand spikes during startup and load transients. Receiver drain valve leakage and corrosion-reduced effective volume are detectable through pressure recovery rate trending.
MEDIUM CONSEQUENCE
Want to see how AI-driven compressed air analytics maps to your specific compressor configuration and instrument air system? Book a 30-minute technical assessment with iFactory's power plant analytics team.
What AI-Driven Compressed Air Analytics Monitors: System by System
Purpose-built compressed air system analytics covers every subsystem that contributes to instrument air reliability — not just the compressor package. The highest-value monitoring platforms come with pre-built performance models for each subsystem, correlating multiple signal streams into system-level health scores that update continuously as operating conditions change.
Compressor Health Monitoring
Compressor Package Performance and Service Interval Tracking
Compressor mechanical condition is tracked through a combination of discharge temperature trending, inter-stage pressure ratio analysis, motor power consumption versus output capacity, vibration spectral analysis on rotating components, and oil analysis trend correlation. AI models establish baseline performance curves for each compressor in the facility's compressed air system and continuously measure deviation from those baselines — quantifying efficiency loss, remaining bearing life, and valve condition before output capacity falls below the system demand curve.
Key Monitoring Signals
Discharge temperature trendingInter-stage pressure ratiosMotor kW vs. output capacityVibration spectral analysisOil consumption rateService hour accumulation
Analytics Output
Condition-based service interval recommendations; efficiency degradation quantification in $/day; bearing remaining life projection; valve wear progression trending; CMMS work order auto-generation at configurable condition thresholds
Dryer Performance Monitoring
Air Dryer Dew Point, Efficiency, and Desiccant Life Tracking
Refrigerated and desiccant dryer performance is tracked through continuous dew point monitoring at dryer outlet, pressure drop across dryer internals, regeneration cycle timing and efficiency for desiccant units, and refrigerant circuit performance for refrigerated units. Dew point excursions — where outlet moisture content exceeds the instrument air specification — are flagged immediately with the specific performance signature indicating whether the cause is desiccant saturation, refrigerant circuit degradation, or bypass valve leakage. Desiccant bed life is projected from cumulative moisture load and regeneration cycle history, enabling planned desiccant replacement rather than reactive replacement after a contamination event.
Key Monitoring Signals
Dew point at dryer outletPressure drop across dryerRegeneration cycle timingRefrigerant circuit pressureDesiccant moisture loadBypass valve position
Analytics Output
Real-time dew point compliance status; desiccant life remaining projection; dryer fault classification (desiccant vs. refrigerant vs. bypass); planned replacement scheduling; moisture contamination risk alert before downstream instrument air specification exceedance
Distribution and Leak Detection
System Leak Quantification and Distribution Header Trending
Distribution system leak detection uses compressor runtime analysis, header pressure baseline drift, and nighttime minimum demand profiling to quantify total system leak volume without requiring individual leak survey instrumentation. When compressor runtime is increasing at constant system demand — or when header pressure requires more frequent compressor starts to maintain setpoint — the system is accumulating leaks. AI models calculate total leak volume in SCFM, translate that into annual energy cost at current electricity rates, and track leak growth rate to project when total leakage will exceed available supply margin. This financial quantification creates the business case for scheduled leak survey programs before the leak rate reaches operationally significant levels.
Key Monitoring Signals
Compressor runtime trendHeader pressure baseline driftNighttime minimum flowStart frequency trendingLead/lag compressor dutyHeader isolation pressure test
Analytics Output
Total system leak rate in SCFM; annual energy cost of current leak volume; leak growth rate trending; supply margin erosion projection; leak survey ROI calculation; recommended survey schedule based on growth rate
Pressure and Storage Monitoring
Receiver Vessel, Header Pressure, and Supply Margin Analytics
Receiver vessel and distribution header pressure monitoring tracks both steady-state operating pressure and dynamic pressure response characteristics — how quickly the system recovers from demand transients, how much pressure drop occurs during startup sequences, and whether the available storage margin is sufficient to bridge the compressor restart delay during demand spikes. Pressure recovery rate degradation is one of the earliest indicators of accumulating system problems — reduced receiver capacity from corrosion, increased leak rate, or reduced compressor output all manifest as slower pressure recovery on the same demand profiles. AI trending isolates which component is contributing to pressure margin erosion.
Real-time supply margin versus minimum instrument air requirement; pressure recovery rate trend; receiver effective volume estimation; startup pressure adequacy projection; low-pressure risk alert with lead time estimate before minimum instrument air threshold
Compressed Air System KPI Reference: What Gets Measured and Why
The following table maps the primary performance indicators for power plant compressed air systems against their standard measurement definitions, the AI analytics signals used to calculate them, and the maintenance or operational consequence if the KPI trends outside the acceptable band. This is the measurement framework that purpose-built compressed air analytics platforms operationalize automatically.
KPI
Measurement Definition
AI Analytics Source
Acceptable Range
Consequence if Exceeded
Specific Power
kW consumed per 100 SCFM of compressed air output at rated pressure
Motor power meter vs. flow transmitter ratio — trended against baseline at equivalent load
Within 5% of clean baseline
Efficiency loss $8K–$32K/yr per compressor; indicator of valve or inter-stage cooling degradation
Discharge Temperature
Compressor final stage discharge air temperature at rated load
Discharge thermocouple vs. ambient and load-corrected baseline model
$40K–$100K/yr energy waste; supply margin erosion; compressor overloading at peak demand
Pressure Recovery Rate
Time for header pressure to recover from minimum to setpoint after a demand transient, normalized for demand magnitude
Header pressure historian trending vs. demand event classification from DCS operating records
Less than 25% increase from clean baseline recovery time
Reduced supply margin for startup sequences; indicator of receiver capacity loss or increasing leak rate
Compressor Runtime Fraction
Percentage of time lead compressor is running versus total available time, at equivalent demand conditions
Compressor run/stop signal from DCS versus historian demand profile trending
Less than 70% run fraction at average demand (preserves reserve capacity)
Excessive runtime accelerates service interval; high fraction indicates supply-demand imbalance from leaks or degradation
Filter Differential Pressure
Pressure drop across inlet and coalescing filters, indicating element loading and restriction
Differential pressure transmitters across filter elements vs. OEM replacement threshold
Below 80% of OEM element replacement specification
Increased compressor power consumption; restricted flow capacity; element failure allowing contaminant ingress
Want to see how AI-driven compressed air analytics maps to your specific compressor configuration and instrument air system? Book a 30-minute technical assessment with iFactory's power plant analytics team.
AI-Driven Analytics Workflow: From Compressed Air Data to Maintenance Action
The value of compressed air system analytics is measured by how completely it automates the chain from raw sensor data to a specific, financially quantified maintenance recommendation — without requiring a dedicated instrumentation engineer to monitor compressor performance dashboards manually. The following workflow maps that chain for a combined-cycle facility with a dual-compressor instrument air system.
01
Continuous Data Ingestion
Historian Connection and Tag Mapping Across All Compressed Air System Components
The platform connects to the plant DCS historian via read-only OPC-UA or PI API, ingesting all compressed air system instrumentation: discharge temperatures, inter-stage pressures, motor power consumption, header pressures at each distribution zone, dew point transmitter outputs, receiver vessel pressures, and compressor run/stop status signals. Each signal is mapped to the specific component it describes — compressor 1A, instrument air header North, refrigerant dryer outlet — enabling system-level correlation rather than isolated tag monitoring. Tag mapping is completed during implementation from P&IDs and existing tag lists without manual configuration of individual data points.
Output: Unified compressed air system data stream; asset-aligned tag library; real-time ingestion confirmed across all instrumentation
02
Performance Baselining
Physics-Based Performance Model Calibration for Each Compressor and Dryer
Pre-built thermodynamic models establish expected performance for each compressor at given ambient conditions, inlet temperatures, and load factors — calculating expected discharge temperature, inter-stage pressure ratios, specific power, and output capacity from first principles. Similarly, dryer models calculate expected dew point performance based on inlet air conditions, flow rate, and ambient temperature. These baselines update continuously with ambient conditions, so a high-temperature summer day does not generate false degradation alerts — only performance that deviates from the physics-corrected expectation is flagged.
Output: Ambient-corrected performance baselines for each compressor and dryer; KPI deviation thresholds calibrated to OEM specifications
03
Anomaly Detection
Multivariate Pattern Recognition Across All Compressed Air System Failure Modes
Machine learning models run continuously against normalized sensor streams, identifying the multivariate patterns that precede each compressed air failure mode. Compressor valve degradation produces a characteristic combination of discharge temperature rise and specific power increase before output capacity falls. Desiccant bed saturation shows progressively shortening dew point compliance windows between regeneration cycles before a sustained exceedance event occurs. Distribution leak accumulation manifests as increasing compressor runtime at constant demand before header pressure begins to drift. These multi-signal patterns are detected weeks before any single parameter crosses an alarm threshold.
Output: Failure mode classification with confidence score; estimated days to threshold crossing; specific component identified as degradation source
04
Financial Quantification
Energy Cost, Maintenance Cost, and Forced Outage Risk Translated Into Dollars
Every detected anomaly is translated into financial terms before reaching the operator. A compressor efficiency loss of 8% is expressed as a daily energy cost increment at current electricity rates. A system leak rate of 45 SCFM is expressed as an annual energy waste figure and a supply margin erosion timeline. A desiccant bed approaching saturation is expressed as the probability and estimated cost of a moisture contamination event within the current week. This financial translation connects compressed air system condition to the operating margin metric that plant managers use — making prioritization decisions straightforward without requiring detailed compressed air system expertise.
Output: $/day current degradation cost; projected event cost if unaddressed; financial break-even for intervention timing
05
Work Order Generation
Condition-Based Maintenance Recommendations Auto-Populated in CMMS
High-confidence findings automatically generate draft work orders in the connected CMMS — SAP PM, IBM Maximo, or Infor EAM — pre-populated with asset identification, failure mode classification, recommended inspection scope, suggested parts requirements, and financial justification for the intervention timing. Compressor service work orders include the specific performance deviation data that prompted the recommendation, so the receiving technician arrives with diagnostic context rather than a generic service instruction. Work order priority is set automatically based on the urgency classification of the finding.
Output: Pre-populated CMMS work order; mobile supervisor notification; parts pre-staging recommendation; intervention timing guidance
06
Continuous Improvement
Model Refinement From Completed Work Orders and Confirmed Events
Every confirmed finding, completed work order, and validated failure event feeds back into model retraining. After 6 to 12 months of operation, facility-specific compressed air system models — calibrated to the specific compressor fleet, dryer types, distribution system geometry, and operating demand profile of the plant — outperform generic models on both detection lead time and false positive rate. The system learns the seasonal demand patterns, the specific degradation signature of each compressor unit, and the leak accumulation characteristics of the distribution headers at the facility.
See Compressed Air Analytics Running on Your Plant's Historian Data
iFactory's team connects to your DCS historian and demonstrates compressor performance trending, dryer dew point analysis, and system leak quantification against your actual operating data — typically within two weeks of engagement, with no control system modifications required.
Measured Outcomes: What Plants Report After Deploying Compressed Air System Analytics
The financial case for compressed air system analytics at power plants follows a direct chain: earlier detection of compressor degradation prevents capacity failures, quantified leak rates drive scheduled survey programs that recover energy waste, and dew point compliance monitoring prevents moisture contamination events that destroy pneumatic actuators and control valve internals. The outcomes below reflect results from U.S. power generation facilities deploying AI-driven compressed air system analytics platforms within their first 18 months of operation.
Compressor Reliability
Unplanned Compressor Downtime
−64% vs. baseline
Condition-based service timing replaces calendar intervals — catching developing mechanical issues before capacity falls below system demand, eliminating the majority of emergency compressor failures.
Instrument Air Loss Events
−71% vs. baseline
Early detection of the specific failure pathways that lead to instrument air header pressure loss — compressor capacity, dryer performance, and leak accumulation — prevents the system-level failures that trigger plant trip scenarios.
Compressor Service Cost per Year
−28% vs. calendar schedule
Condition-based service intervals eliminate both premature maintenance on units performing within specification and late maintenance on units degrading faster than the standard interval assumes.
Energy and Efficiency
System Leak Rate Reduction
22% SCFM recovered
AI-quantified leak rates provide the business case for targeted leak survey programs — recovering an average of 22% of system air volume at facilities with previously unmanaged leak accumulation.
Compressor Energy Cost Reduction
$62K avg. annual savings
Combined savings from leak reduction, compressor efficiency recovery through timely service, and optimized lead/lag compressor sequencing based on current performance data rather than fixed rotation schedules.
Dew Point Compliance Rate
99.4% vs. 94.1% baseline
Continuous dew point monitoring with predictive desiccant life tracking eliminates the specification exceedance events that previously occurred between scheduled dryer inspections.
Operational Outcomes
Forced Outage Costs Avoided
$310K avg. first year
From compressed air-related forced outage events that AI analytics detected and prompted intervention before header pressure fell below minimum instrument air operating threshold.
Pneumatic Actuator Repair Cost
−43% vs. baseline
Dew point compliance improvement and moisture contamination prevention extends actuator service life and reduces the control valve repair backlog generated by moisture-damaged internals.
Platform Payback Period
5–9 months typical
Combined return from avoided forced outage costs, energy savings from leak reduction and efficiency recovery, and reduced actuator and valve repair costs at 200–500 MW generation facilities.
Want to see how AI-driven compressed air analytics maps to your specific compressor configuration and instrument air system? Book a 30-minute technical assessment with iFactory's power plant analytics team.
Expert Review: What Reliability Engineers Say About Compressed Air System Analytics
Expert Review
Sandra K., Lead Reliability Engineer
Gas-Fired Combined Cycle and Peaker Fleet, Southeast Region — CMRP Certified
"Compressed air was the system we worried about the least — right up until the moment we lost instrument air pressure during a startup sequence and ended up with a forced trip that cost us eleven hours of capacity payments. The post-incident investigation showed that the lead compressor had been running at 82% of rated output for six weeks before the trip, and the DCS alarm system never flagged it because header pressure was staying within normal range — barely. The second compressor had the capacity to make up the difference under normal conditions, but not during a startup transient with all the pneumatic actuators cycling simultaneously. After we deployed AI-driven analytics on the compressed air system, the first thing we noticed was that the system identified that specific compressor efficiency degradation pattern within four days of data connection — retroactively, against the historical data that led up to the incident. Prospectively, the platform caught a similar developing efficiency loss on a different unit at one of our other plants fourteen days before that unit would have reached the same operating point. We scheduled the compressor valve maintenance during a planned weekend outage. No trip, no capacity payment loss, no emergency call-out rate. The other outcome that surprised us was the leak quantification. We knew we had some leaks — every plant does — but the AI-calculated leak rate showed we were losing 38 SCFM across the instrument air distribution system. At our electricity rate, that was about $74,000 a year in energy waste we had no idea about. We ran a targeted leak survey based on the system's distribution header analysis, fixed the highest-volume sources in two maintenance windows, and cut the leak rate to 14 SCFM. The platform paid for itself in leak reduction alone before we counted the avoided trip event."
14 days
Detection Lead Time on Next Unit
$74K/yr
Annual Leak Energy Waste Identified
1 Trip
Avoided at Second Facility
Frequently Asked Questions
No modifications to the DCS or control system are required. iFactory connects to existing plant historian data using read-only OPC-UA or PI API protocols — the same historian connection used for all other platform deployments. Most power plants have adequate existing instrumentation on the compressed air system — discharge temperatures, header pressures, motor runtime signals, and dew point transmitters — to support compressor health monitoring, dryer performance tracking, and leak rate quantification without additional sensors. Where specific measurement gaps exist — typically individual distribution zone pressures or individual dryer outlet dew point transmitters — the platform identifies those gaps during the initial data audit and provides a sensor investment roadmap ranked by diagnostic value. For most facilities, fewer than three additional measurement points are required to achieve full compressed air system analytics coverage.
The platform models each compressor individually — maintaining separate performance baselines, service interval trackers, and degradation trend models for each unit in the system. For lead/lag and duty/standby configurations, the platform also monitors the combined system capacity margin — calculating whether the current performance of all available units provides sufficient supply capacity for the full range of plant demand conditions, including startup transients. Performance differences between compressors in the same duty position are automatically flagged — a unit showing higher specific power than its pair under equivalent conditions is a candidate for earlier service intervention. Lead/lag rotation recommendations can be generated based on relative condition rather than fixed rotation schedules, ensuring that the better-performing unit is in the lead position during high-consequence operating periods like startup sequences.
Yes. The platform quantifies total system leak volume using compressor runtime analysis during minimum-demand periods — typically nighttime or weekend low-load windows when process demand is minimal and compressor runtime is attributable almost entirely to replacing leaked air. This approach does not identify individual leak locations, but it accurately quantifies total system leak rate in SCFM, calculates the annual energy cost at current electricity rates, and tracks the leak growth rate over time. This quantification serves two purposes: it provides the financial justification for commissioning a targeted ultrasonic leak survey, and it establishes a pre-survey baseline against which post-survey leak reduction can be measured. The platform recommends survey scope based on which distribution headers show the highest pressure drop gradients — directing the survey team to the highest-probability leak zones rather than requiring full-system coverage.
A standard CMMS PM schedule triggers compressor service based on operating hours accumulated — the same interval regardless of whether the compressor has been running lightly loaded in favorable ambient conditions or continuously at rated load in high ambient temperatures with elevated moisture ingress. AI-driven condition monitoring tracks the actual degradation indicators that service intervals are designed to address — oil condition from temperature history, valve wear from discharge temperature and specific power trends, bearing condition from vibration analysis, and filter loading from differential pressure — and triggers a service recommendation when those indicators reach the condition threshold rather than when a fixed hour count is reached. This produces service intervals that are longer for well-running units in favorable conditions and shorter for units operating under stress — reducing total service cost while maintaining the condition standard the interval was designed to protect.
Compressed air system analytics is available as part of iFactory's plant-wide analytics subscription or as a standalone module for facilities focused specifically on instrument air reliability. For a typical 200–400 MW facility with two to four compressors, two dryer trains, and a dual-header instrument air distribution system, the annual subscription for the compressed air analytics module ranges from $18,000 to $32,000 including compressor health monitoring, dryer performance tracking, leak rate quantification, KPI dashboards, and CMMS integration. Implementation services for compressed air system configuration typically run $6,000 to $12,000 as a one-time cost. Most facilities calculate full cost recovery within 5 to 9 months from a single avoided instrument-air-related forced outage event — at $420,000 average forced outage cost, the analytics module pays for multiple years of subscription from one prevented event. Energy savings from leak reduction typically add $40,000 to $90,000 per year in ongoing return. Contact iFactory for a site-specific assessment based on your compressor fleet and distribution system configuration.
Want to see how AI-driven compressed air analytics maps to your specific compressor configuration and instrument air system? Book a 30-minute technical assessment with iFactory's power plant analytics team.
Conclusion: Compressed Air Reliability Is a Plant Availability Problem — Treat It Like One
Compressed air system failures do not fail gracefully. When instrument air pressure drops below the minimum operating threshold for pneumatic actuators and control valve positioning, the plant does not derate — it trips. The forced outage costs, capacity payment losses, and emergency repair mobilization expenses that follow a compressed air system failure are disproportionate to the monitoring investment that would have prevented it. The detection window exists: compressor efficiency degradation, dryer dew point exceedance trajectories, leak accumulation rates, and receiver pressure margin erosion all develop over weeks and produce measurable, trackable sensor signatures before they cascade into a system pressure event.
AI-driven compressed air system analytics closes the monitoring gap that conventional DCS alarm systems leave open — not by adding new alarms to an already overloaded alarm management environment, but by continuously correlating the multi-signal patterns that precede compressed air failures and translating those patterns into financially quantified, condition-based maintenance recommendations before the failure threshold is reached. For U.S. power plants where instrument air loss constitutes a plant trip scenario, this level of monitoring is not a premium investment. It is the baseline analytics that the criticality of compressed air to plant availability has always justified.
Purpose-Built Compressed Air Analytics for Power Plants
From compressor service tracking to dew point compliance and system leak quantification, iFactory delivers AI-driven instrument air system intelligence sized for U.S. generation facilities — deployable in weeks, with ROI measurable from the first avoided forced outage event.


.png)