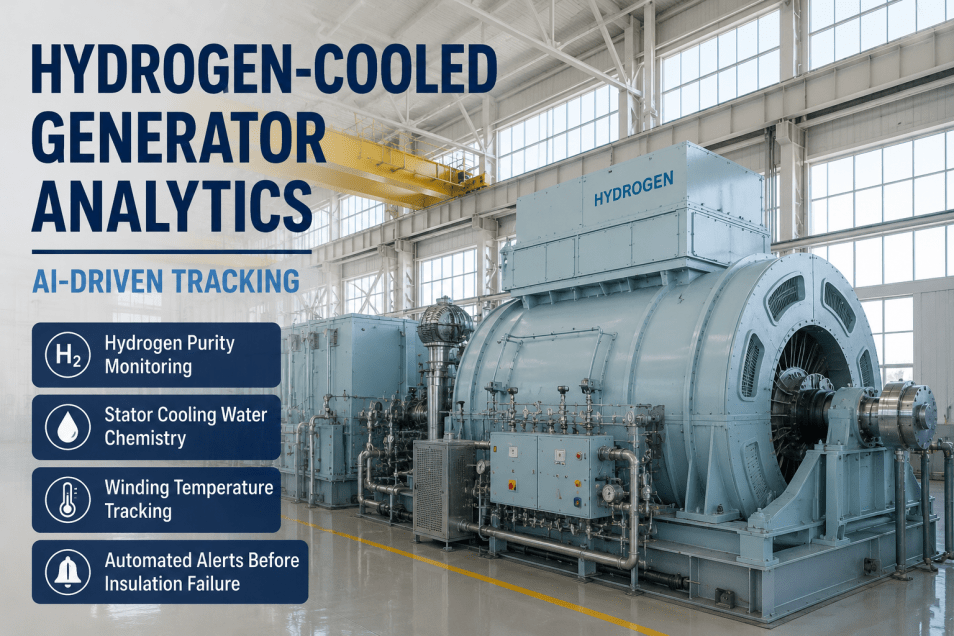
Hydrogen-cooled generators are the highest-output, highest-value rotating machines in most large thermal and combined cycle power plants — and they carry a failure risk profile that sits in an entirely different category from any other plant asset. A stator winding ground fault, cooling water chemistry excursion, a hydrogen purity degradation event, or a winding temperature gradient developing over 72 hours can each escalate from a monitor flag to a forced rotor removal in less time than a standard maintenance planning cycle allows. The challenge for power plant analytics programs is that hydrogen-cooled generator condition monitoring produces data from four separate systems — hydrogen purity and pressure monitors, stator cooling water chemistry analyzers, winding resistance temperature detectors (RTDs), and partial discharge monitoring equipment — that typically live in separate display points, reviewed independently by separate specialists, with no integrated analytics layer connecting the cross-system degradation patterns that precede the failure modes most likely to result in a multi-month outage. iFactory's AI-driven analytics platform delivers that integration layer: a generator analytics module that tracks hydrogen purity, stator cooling water chemistry, winding temperature distribution, and partial discharge activity in a single asset record — connecting condition trends across all four monitoring systems to structured maintenance alerts and work orders before any individual parameter has crossed its standalone alarm threshold. For an assessment of how generator analytics could be configured for your plant's monitoring architecture,
AI-driven · Hydrogen Generator · Power Plant Analytics
Hydrogen-Cooled Generator Analytics: Track Hydrogen Purity, Stator Cooling Water Chemistry, and Winding Temperature in iFactory AI-driven.
iFactory's generator analytics module integrates hydrogen purity, stator cooling water chemistry, winding RTD temperature distribution, and partial discharge monitoring into a single AI-driven asset record — alerting maintenance teams to cross-system degradation patterns before any individual parameter reaches its standalone alarm threshold.
Stator winding ground fault requiring rotor removal and full rewind — the most common catastrophic hydrogen generator failure
97%+
Hydrogen Purity Target
Required purity level for stable operation — purity below 95% increases windage losses and flammability risk simultaneously
6–18 mo
PD Warning Window
Advance notice available from partial discharge monitoring before insulation failure — when tracked continuously
The Generator Analytics Gap
Why Hydrogen Generator Failures Keep Surprising Maintenance Teams That Have Monitoring Systems
Most large hydrogen-cooled generators have monitoring instrumentation on all four critical condition parameters. The failure mode is not a lack of data — it is the absence of an integrated analytics layer that connects the cross-system patterns these parameters display before a catastrophic failure event.
Siloed
Four monitoring systems — hydrogen purity, stator cooling water, winding RTDs, and PD — reviewed independently with no cross-system analytics connection
Lagging
Standalone alarm thresholds are set conservatively — by the time any single parameter alarms, cross-system degradation has typically been progressing for weeks
$8–24M
Cost range for a stator ground fault event — repair, rotor removal, rewind, and outage duration that systematic cross-system monitoring prevents
6–18 mo
Available advance warning from continuous PD monitoring before insulation failure — a window that reactive monitoring programs routinely miss
Generator Analytics: Conventional vs. AI-Driven iFactory
Hydrogen purity alarms at 95%. Stator cooling water conductivity alarms at 2 μS/cm. Winding RTD alarms at maximum temperature. Partial discharge alarms at vendor-specified magnitude. Each threshold is appropriate as a standalone safety limit — but none of them captures the cross-system degradation pattern that typically develops weeks before any individual threshold is crossed. By the time a conventional monitoring system generates an actionable alarm, the maintenance window has already narrowed significantly.
iFactory's generator analytics module connects all four monitoring systems in a single asset record and tracks the cross-parameter patterns that precede failure events — purity decline correlating with winding temperature gradient development, cooling water chemistry drift preceding PD activity increase, RTD temperature distribution asymmetry indicating cooling flow restriction. Pattern alerts are generated weeks before any standalone threshold is reached, converting a catastrophic failure scenario into a planned outage with defined scope and confirmed parts.
Integrated four-system asset recordCross-parameter pattern detection6–18 months advance warning on PDAutomated CMMS work order generation
4 Core Analytics Capabilities
What iFactory Tracks Across Your Hydrogen-Cooled Generator — and What Each Capability Protects Against
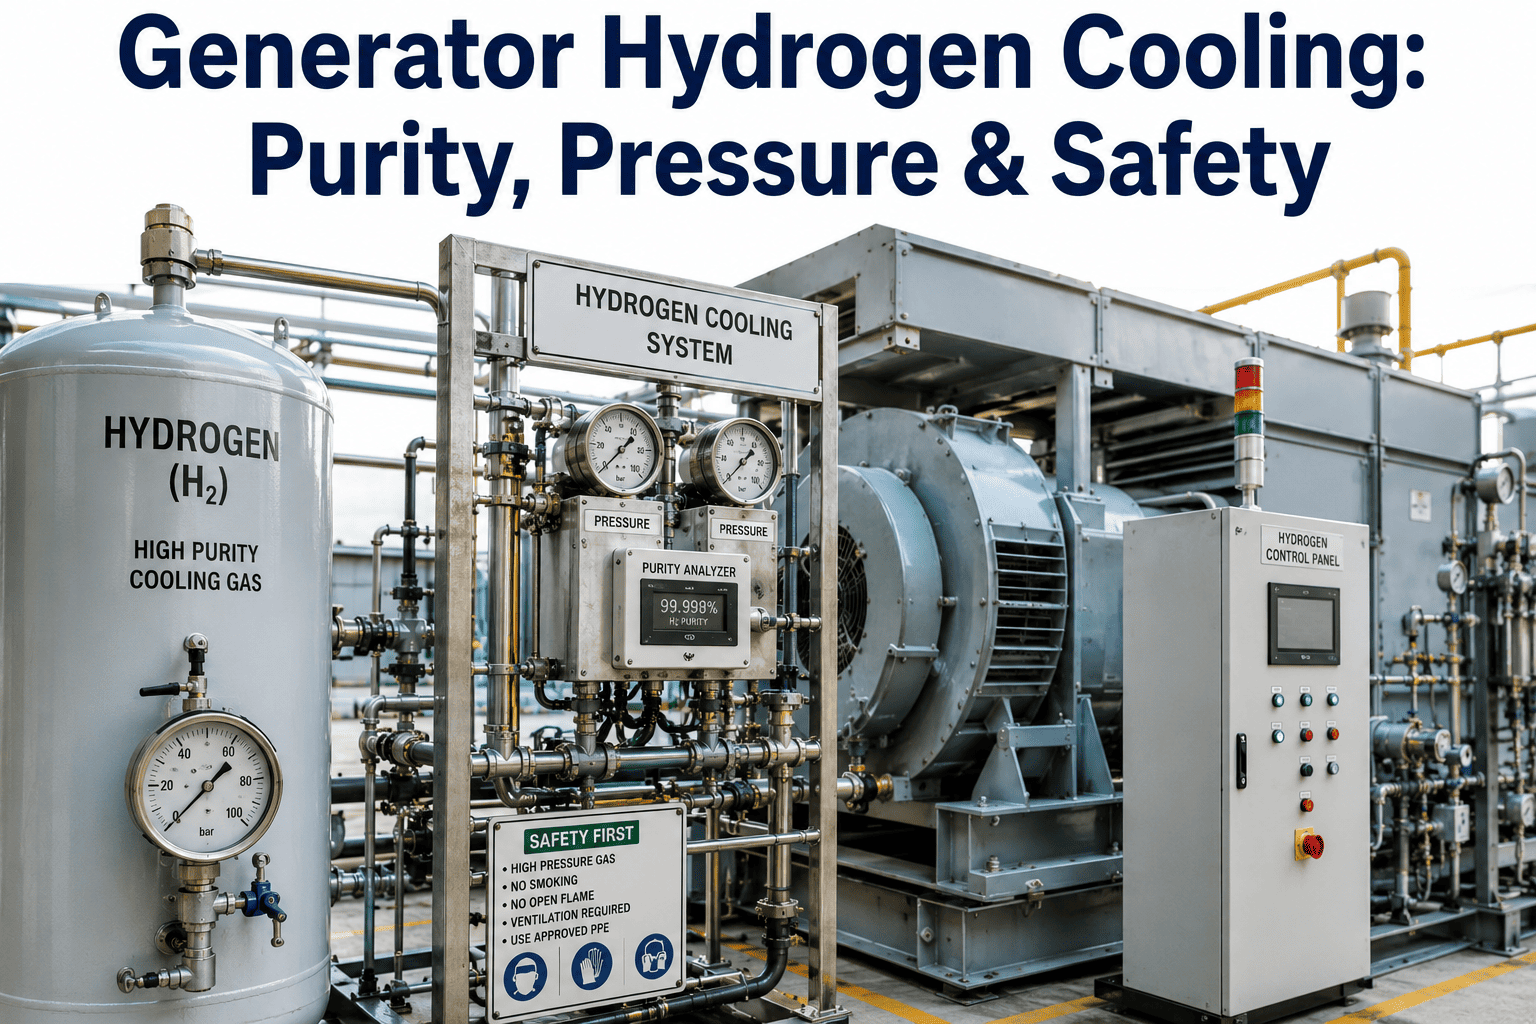
Hydrogen purity tracked continuously from in-line thermal conductivity monitors — trend velocity calculated to distinguish normal operating variation from degradation indicating seal oil contamination, air ingress, or moisture accumulation. Purity-temperature correlations flagged when winding temperature increase correlates with purity decline, indicating the onset of windage loss increase before either parameter alarms standalone. Pressure envelope tracking detects seal system leakage patterns at rates below visible indication on pressure gauges.
Protects against: Windage loss increase, seal failure, flammability risk
02
Stator Cooling Water Chemistry Tracking
Stator cooling water conductivity, pH, dissolved oxygen, and copper ion concentration tracked continuously from online analyzers or imported from laboratory results. Chemistry drift preceding insulation degradation — conductivity increase from copper dissolution, pH excursion from resin bed exhaustion, dissolved oxygen increase indicating deaeration system performance degradation — all tracked against individual unit baselines established during normal operation. Cross-system correlation with PD activity flagged when chemistry excursions correlate with PD magnitude increase.
Winding Temperature Distribution and Gradient Analysis
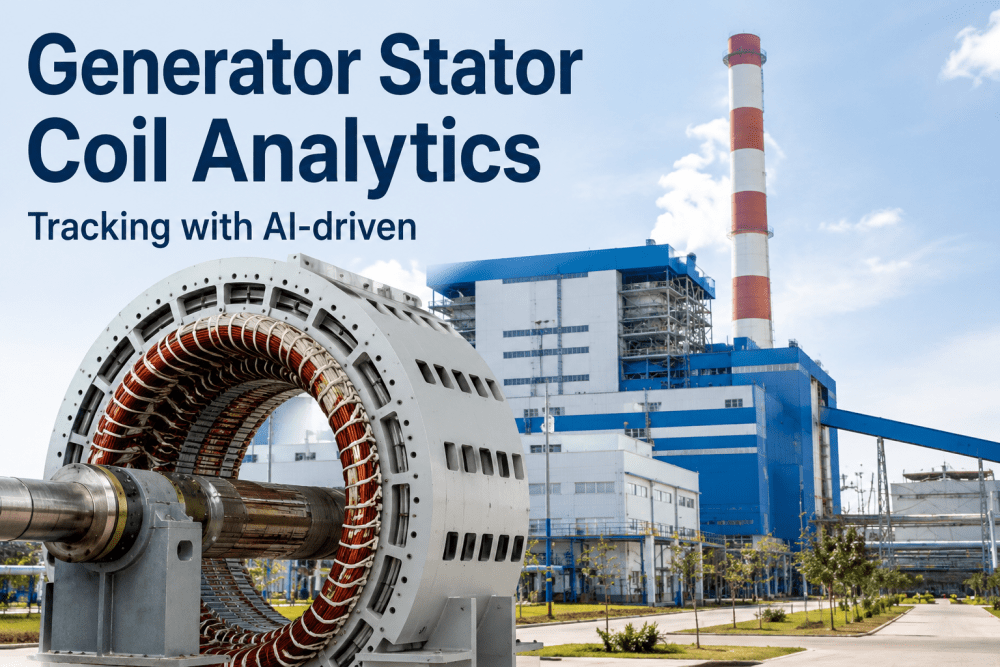
All winding RTD readings tracked simultaneously with temperature distribution analysis across both stator and rotor winding sections. Temperature gradient development — where specific slots or coil sections run hotter than the statistical mean — indicates cooling flow restriction, partial blockage, or localized insulation resistance reduction developing before it progresses to a full winding ground fault. Asymmetric gradient patterns between top and bottom slots of the same phase flagged as cooling restriction indicators.
Partial discharge magnitude and pulse repetition rate data imported from online PD monitoring systems (Iris Power, Qualitrol, Doble, or OEM-supplied) or from periodic offline PD test results. PD trending per phase, per slot, and per discharge pattern type tracked against the unit's own historical baseline. Rate of change in PD magnitude — which is more significant than absolute level — calculated continuously. Cross-system PD-to-chemistry and PD-to-temperature correlations flagged when multiple parameters trend concurrently.
Cross-System Pattern Alerts and Work Order Generation
When two or more generator condition parameters trend concurrently in a pattern correlated with known precursor degradation sequences, iFactory generates a cross-system pattern alert and creates a CMMS work order with the specific parameter combination, trend velocity data, recommended inspection scope, and any parts or specialist requirements. The maintenance planner receives an actionable work order with the supporting condition data — not a raw alarm requiring specialist interpretation before planning can begin.
Delivers: Planned intervention vs. emergency response — average 4–6 week advance scheduling window
06
Regulatory and Insurance Documentation
All generator condition monitoring records — hydrogen purity logs, cooling water chemistry test records, winding temperature trending data, and PD monitoring results — maintained in the asset record and exportable in formats accepted by NERC reliability reporting, generator OEM warranty documentation requirements, and insurance underwriter inspection documentation standards. Annual condition assessment documentation assembled automatically from the continuous monitoring records without manual data compilation.
Delivers: Audit-ready compliance documentation in under 60 seconds
How iFactory's Generator Analytics Module Works: From Four Monitoring Systems to One Maintenance Action
The integration challenge in hydrogen generator analytics is connecting four separate condition monitoring systems — each with different data formats, different update frequencies, and different specialists — into a single coherent asset health picture. iFactory does this in four steps.
Step 01
Multi-System Data Integration
Hydrogen purity and pressure data from SCADA or dedicated purity monitors; stator cooling water chemistry from online analyzers or lab import; winding RTD temperature readings from the generator protection system or SCADA historian; PD monitoring data from the online PD system's OPC-UA server or API. All four data streams mapped to a single generator asset record with synchronized timestamps — enabling cross-parameter analysis that isolated system displays cannot support.
Step 02
Individual Parameter Baseline Establishment
Healthy operating baselines established per parameter from the generator's own historical data — not generic fleet averages. Each hydrogen purity unit's normal operating variance, each cooling water chemistry parameter's expected range under the plant's water treatment program, each RTD's expected temperature at rated load, each PD channel's expected magnitude and pattern. Individual baselines convert generic alarm thresholds into unit-specific deviation alerts that are sensitive to changes that matter for this specific machine.
Step 03
Cross-System Pattern Recognition
AI models analyze all four parameter streams simultaneously for the concurrent trend patterns associated with specific generator degradation mechanisms. The key failure precursor patterns — purity decline with winding temperature rise; cooling water chemistry excursion with concurrent PD increase; RTD gradient development with cooling water flow rate decline; PD magnitude increase with load-correlated pattern suggesting specific coil locations — are scored continuously against the established baselines. Pattern detection alert generated when multi-parameter trend velocity exceeds the configured risk threshold.
Step 04
Maintenance Work Order Generation
Cross-system pattern alert converted to a CMMS work order automatically — populated with the specific parameters triggering the alert, their trend data, the degradation mechanism indicated, the recommended inspection scope (hydrogen system leak check, cooling water system flush, targeted winding section inspection, or offline PD magnitude test), and any specialist mobilization requirements. The maintenance planner receives a scheduled, actionable work order rather than an alarm requiring specialist interpretation before any planning can start.
See It Applied to Your Generator Configuration
Watch iFactory's Generator Analytics Module Connect Hydrogen Purity, Cooling Water, Winding Temperature, and PD Data in a Live Demo
We configure the demo to your specific generator model, monitoring system architecture, and plant's current analytics setup — showing exactly how the cross-system integration works with your existing instrumentation infrastructure.
Hydrogen Generator Monitoring: Conventional vs. iFactory — What Each Detects and When
This comparison maps the five primary hydrogen generator degradation pathways to the detection capability of conventional standalone monitoring versus iFactory's integrated cross-system analytics.
Detection Capability Comparison — Conventional vs. AI-Driven
Degradation Pathway
Conventional Detection
iFactory AI-Driven Detection
Lead Time Advantage
Stator insulation degradation (PD-driven)
Offline PD test at scheduled interval — 1–2 year lag between tests
Continuous PD trending with rate-of-change alert — 6–18 months advance
Up to 18 months earlier
Cooling water chemistry excursion
Conductivity alarm at 2 μS/cm — chemistry already significantly degraded
Conductivity trending from unit baseline — deviation flagged at 20% above baseline, weeks before alarm
3–6 weeks earlier
Hydrogen purity degradation
Alarm at 95% — windage losses already increasing, seal system already compromised
Purity trend velocity alert at 98.5% declining — seal system intervention before efficiency impact
2–4 weeks earlier
Winding cooling flow restriction
Individual RTD alarm — by then, localized thermal damage may have already progressed
RTD gradient pattern analysis — asymmetric temperature distribution flags restriction weeks before any RTD alarms
4–8 weeks earlier
Cross-system insulation failure precursor
No detection — individual alarms fire sequentially as failure progresses, each too late for planned response
Multi-parameter concurrent trend alert — chemistry drift + PD increase + temperature gradient together flag failure precursor before any individual alarm
Months earlier — only iFactory detects
Expert Perspective: What Generator Specialists Say About Integrated Condition Monitoring
Power generation specialists with direct experience in hydrogen generator condition monitoring programs have identified the cross-system integration gap as the defining difference between programs that prevent failures and programs that document them.
The stator failures I've investigated over a 24-year career have almost all followed the same pre-failure data pattern — if you know where to look for it. The cooling water conductivity begins trending up 8 to 12 weeks before the ground fault. The PD activity in the affected phase increases over the last 4 to 6 weeks. Sometimes there's a temperature gradient developing in the relevant slot group. And the hydrogen purity has often been cycling slightly lower than historical norms because the seal oil degassing isn't quite keeping up — which means the windage losses are slightly higher than they should be, which adds thermal load to the stator. None of these changes triggers a standalone alarm. Each one, reviewed in isolation, looks like normal operating variation by a specialist who sees only that one parameter. The pattern of all four trending concurrently in the six weeks before a stator ground fault is unmistakable — but you have to be looking at all four together, trending against that specific unit's historical baseline, not against generic fleet averages or fixed alarm thresholds. The generators that suffer preventable $10–$20 million failure events are not the ones without monitoring. They are the ones with monitoring systems that display four separate screens and no integrated view of what all four are doing simultaneously. Every time I'm called in after a stator failure, the data trail was there. The system just wasn't watching all of it at the same time.
Senior Generator Specialist and Condition Monitoring Engineer24 Years Power Generation · CIGRÉ SC A1 (Rotating Electrical Machines) National Expert · Former Lead Generator Engineer, Major U.S. Utility Fleet · IEEE Power and Energy Society Member
80%
Of catastrophic generator failures preceded by cross-system data pattern that integrated analytics would have detected
6–12 wk
Advance warning available from integrated monitoring — the planning window to scope a planned outage vs. emergency response
50%
Cost difference between planned stator repair (planned outage) vs. emergency rotor removal after ground fault
<60 sec
Time to generate full regulatory and insurance compliance documentation from iFactory's continuous monitoring records
Book a demo to see iFactory's integrated generator analytics applied to your specific generator model and monitoring system configuration.
Conclusion
Hydrogen Generator Failures Are Not Monitoring Failures — They Are Integration Failures
The data that precedes every hydrogen-cooled generator stator ground fault, cooling water chemistry excursion, or winding failure is almost always present in the monitoring systems before the event occurs. The failure is not in sensor coverage — it is in the absence of a system that watches all four condition monitoring streams simultaneously, trends them against the unit's own historical baseline, and flags the cross-system patterns that precede failure events weeks or months before any individual standalone alarm is activated.
iFactory's AI-driven generator analytics module closes that integration gap. It connects hydrogen purity, stator cooling water chemistry, winding RTD temperature distribution, and partial discharge data in a single asset record — applies AI-driven cross-parameter pattern recognition against unit-specific baselines — and converts detected precursor patterns into CMMS work orders with defined inspection scope, required specialists, and scheduling window information. The difference between an $8–$24 million forced outage event and a $400,000 planned repair is not sensor coverage. It is whether the monitoring program can see the pattern across all four systems — and act on it early enough to plan. Book a Demo to see iFactory's generator analytics configured for your plant's hydrogen unit and monitoring architecture.
Which generator OEM monitoring systems and PD monitoring platforms does iFactory integrate with?
iFactory's generator analytics module integrates with all major partial discharge monitoring platforms: Iris Power TGA-B, Qualitrol GMS-100, Doble M4100, Baker Instrument systems, and OEM-supplied PD monitoring systems from GE, Siemens, Mitsubishi, and Alstom/GE. For hydrogen and cooling water monitoring, integration uses SCADA OPC-UA connections, historian API access, or direct instrument Modbus connections. Stator cooling water online analyzers from Hach, YSI/Xylem, and Yokogawa are directly supported. For plants without online PD monitoring, iFactory accepts periodic offline PD test results import from the standard export formats used by all major portable PD test equipment. Book a Demo to confirm the specific integration path for your generator's monitoring configuration.
How does iFactory establish unit-specific baselines for a generator that has been in service for 15–20+ years with limited historical monitoring data?
For generators with limited digital monitoring history, iFactory establishes baselines through three complementary approaches. First, the integration period — typically the first 8–12 weeks after iFactory connection — profiles the unit's normal operating signature across all four condition parameters under the plant's actual load range, providing a statistically valid baseline from current data. Second, for generators with existing historian data even in limited format, iFactory's data quality module extracts available historical records and builds baseline ranges from whatever clean data periods are available. Third, iFactory's generator type knowledge base provides fleet-level benchmarks for the unit's specific OEM and model as a reference layer that is progressively replaced by unit-specific data as the monitoring record accumulates. Baseline confidence intervals are displayed alongside all alerts, so the maintenance team understands whether an alert is from a mature unit-specific baseline or a newer reference-based baseline.
How does iFactory differentiate between normal hydrogen purity variation and the early-stage seal system degradation that warrants intervention?
This differentiation is one of the key technical problems iFactory's hydrogen purity analytics is specifically designed to solve. Normal purity variation follows predictable patterns: load-correlated variation within a defined range, predictable decay rate between hydrogen charging cycles, seasonal patterns related to ambient temperature effects on seal oil performance. Seal system degradation shows distinctly different patterns: accelerating decay rate between charging cycles (rate of decline increasing rather than stable), loss of correlation between load and purity variation, and concurrent pressure envelope changes indicating active leakage rather than normal diffusion. iFactory's purity analytics tracks all three distinguishing characteristics simultaneously — rate of decay, load correlation coefficient, and pressure-purity relationship — and flags deviation from expected normal variation patterns rather than from a fixed absolute threshold. This approach detects seal degradation 2–4 weeks before the purity level itself would approach an alarm value.
What is the minimum monitoring instrumentation configuration required for iFactory's generator analytics to provide useful cross-system alerts?
The minimum viable configuration for cross-system generator analytics requires: (1) hydrogen purity monitor with digital output — thermal conductivity or gas chromatography type, (2) at least one stator cooling water parameter with digital output — conductivity preferred, (3) winding RTD readings from the generator protection relay or SCADA — at minimum one per phase per coil group. With this minimum configuration, iFactory can provide purity-temperature correlation analysis and cooling water trend monitoring. Full cross-system capability adds: online or periodic offline PD monitoring data, all available cooling water chemistry parameters (pH, dissolved oxygen, copper ion), and hydrogen system pressure envelope data. Each additional data source adds analytical capability — but the minimum configuration delivers meaningful detection improvement over isolated standalone monitoring from day one of connection.
Can iFactory's generator analytics module manage multiple hydrogen-cooled generators at the same site and compare their condition trends?
Yes — multi-unit generator analytics is a native capability of iFactory's platform. For sites with two or more hydrogen-cooled generators, iFactory maintains independent asset records per unit (with unit-specific baselines) while providing a site-level generator fleet view that compares condition status, trend trajectories, and alert histories across all units. This cross-unit comparison is particularly valuable for identifying systematic issues — a stator cooling water chemistry problem affecting both units simultaneously often indicates a shared make-up water quality issue rather than unit-specific degradation. The site-level view also enables maintenance resource planning across multiple units and priority ranking when more than one generator shows concurrent condition trends requiring attention. Book a Demo to see the multi-generator fleet view demonstrated for a dual-unit site configuration.
Protect Your Highest-Value Asset
Hydrogen Generator Data Sits in Four Separate Systems. iFactory Connects All Four Into One AI-Driven Analytics Program.
Hydrogen purity trending, stator cooling water chemistry tracking, winding temperature gradient analysis, and partial discharge monitoring — integrated in a single asset record with cross-system pattern detection that generates CMMS work orders weeks before any standalone alarm fires.