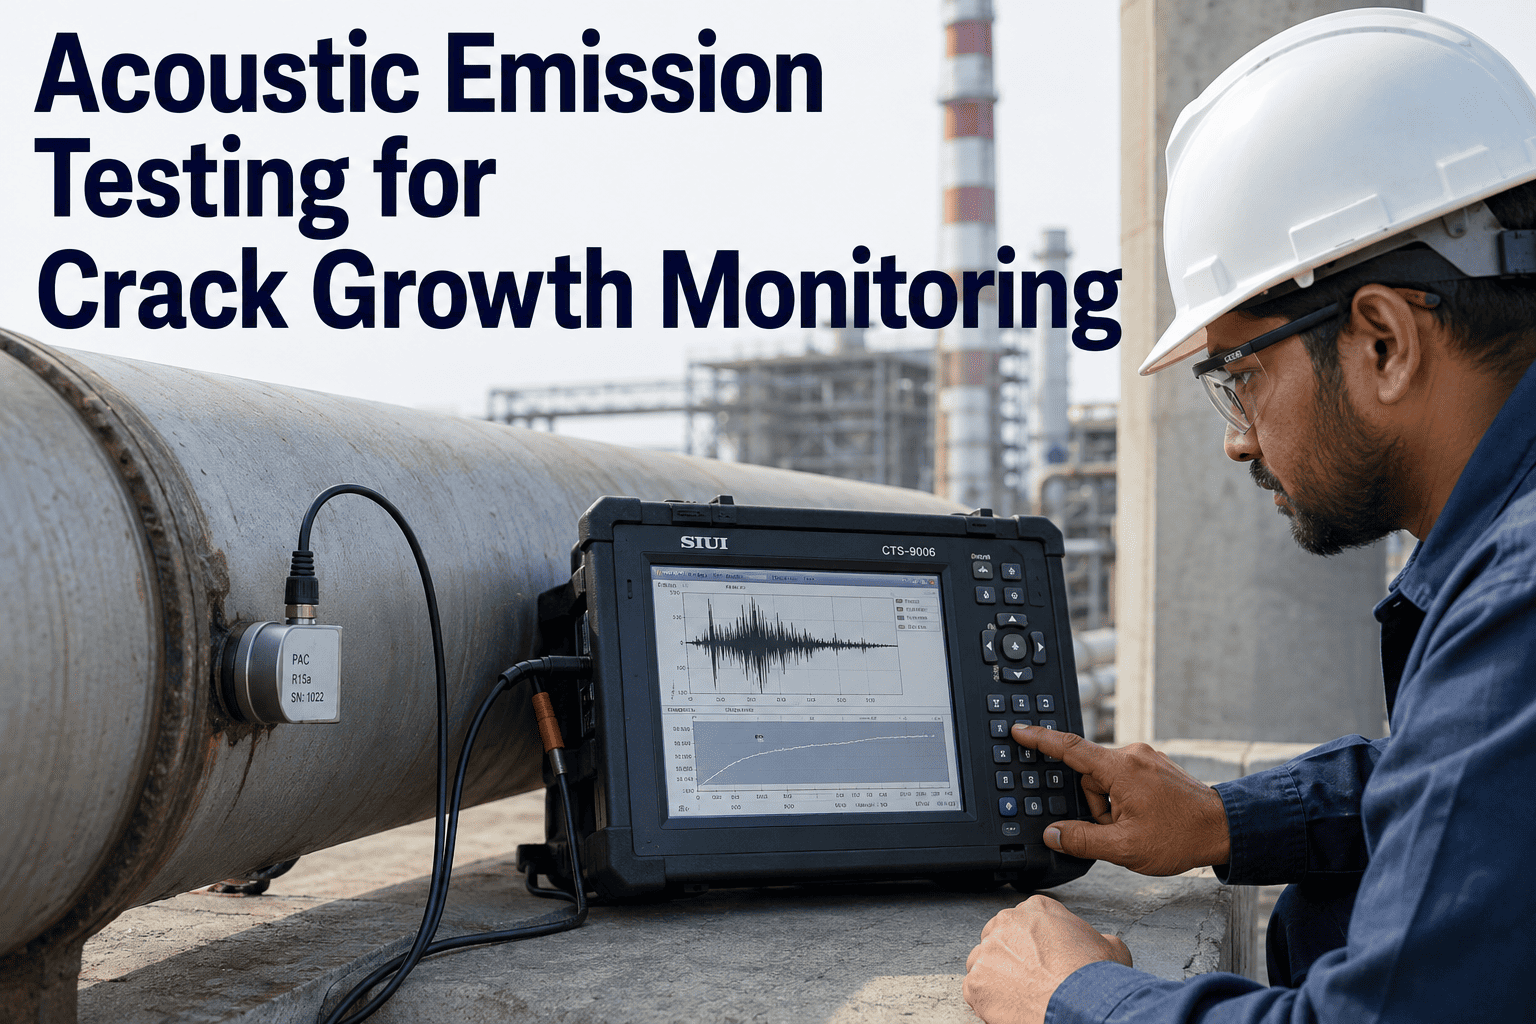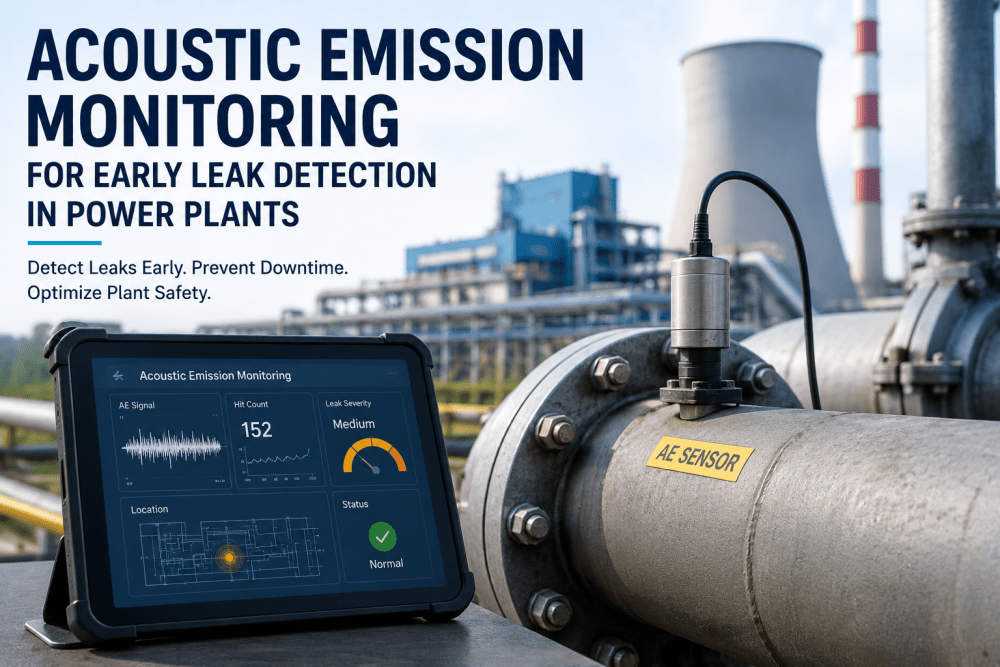
Acoustic emission monitoring is one of the most technically sophisticated — and most underutilized — condition monitoring technologies available to power plant maintenance engineers. While vibration analysis detects damage that already progressed to surface spalling, acoustic emission (AE) sensors detect the ultrasonic stress waves produced by active physical processes that precede that damage: fatigue crack propagation, corrosion under insulation (CUI), partial discharge in high-voltage equipment, cavitation in pumps, and hydrogen embrittlement in pressure vessels. The physics are clear — every advancing crack front, every discharge event, every cavitation bubble collapse produces an ultrasonic emission burst at 100 kHz to 1 MHz, frequencies that are invisible to standard vibration analysis but clearly detectable by AE sensors mounted on the structure. The practical challenge for power plant maintenance programs is not sensor technology — industrial-grade piezoelectric AE sensors are mature and cost-effective. The challenge is integration: getting AE sensor data into a structured analytics workflow that connects emission event detection to a classified fault type, links the fault classification to the correct maintenance response, generates a work order with the right parts and procedures, and tracks the progression of the defect over time in the asset record. Without that integration layer, AE monitoring produces a stream of waveform data that requires specialist interpretation, never reaches the planner's work queue, and never drives the scheduled intervention that prevents the failure it detected. iFactory's AI-driven analytics platform delivers that integration layer — connecting AE sensor data to structured analytics workflows that convert acoustic emission events into classified, tracked maintenance actions without requiring in-house AE specialists to interpret raw waveform data. Need to assess how AE monitoring could integrate with your plant's current analytics program? book a demo for a configuration review.
Acoustic Emission Monitoring for Power Plants: Detect Active Cracks, Partial Discharge, and Cavitation Before They Become Failures.
AE sensors detect the ultrasonic stress waves produced by active damage mechanisms — fatigue crack propagation, CUI, partial discharge, and cavitation — weeks before they reach the threshold detectable by conventional vibration analysis. iFactory integrates AE event data into structured analytics workflows that convert raw emission signals into classified, tracked maintenance work orders.
What Acoustic Emission Monitoring Actually Detects — and What It Cannot
AE monitoring is not a replacement for vibration analysis, ultrasonic thickness testing, or thermography. It is an additional detection layer that catches specific active damage mechanisms earlier than any other condition monitoring technology. Understanding exactly what AE detects — and what it does not — is the foundation of an effective multi-layer monitoring program.
The Four AE Fault Classification Types — How iFactory Identifies Which Response Each Requires
Raw AE waveform data contains the information needed to classify the source mechanism — but extracting that classification requires signal processing and pattern matching that power plant maintenance teams should not need to perform manually. iFactory's AE analytics module applies automated classification to every captured event, categorizing it by source mechanism and severity, and linking each category to the appropriate maintenance response.
Detection Lead Times: Acoustic Emission vs. Conventional Monitoring Methods
The primary operational value of AE monitoring is lead time — the weeks of advance notice between first detection and required intervention that conventional monitoring cannot provide. This comparison maps each fault type to the detection lead time available from AE versus the earliest alternative monitoring method.
| Fault Type | AE Detection Lead Time | Next Earliest Method | Lead Time Advantage | Consequence of Missing Window |
|---|---|---|---|---|
| Fatigue crack initiation | 6–8 weeks before fracture | Vibration: 2–3 weeks before | +4–5 weeks advance | Turbine casing fracture, $1.8M+ event |
| Partial discharge (generator) | 6–18 months before failure | Capacitance monitor: 2–4 months | +4–14 months advance | Generator winding insulation failure, full rewind |
| Pump cavitation onset | Real-time at cavitation start | Vibration: moderate to severe only | Incipient stage detection | Impeller erosion, hydraulic seal failure |
| CUI active corrosion | Active zones detected during survey | Visual: requires insulation removal | No insulation removal required | Pipe wall thinning to failure, 40–60% of piping failures |
| Pressure vessel crack | Early propagation phase | UT thickness: scheduled interval | Between scheduled inspections | Catastrophic vessel failure, mandatory shutdown |
| Weld zone cracking | Crack initiation stage | PT/MT: shutdown, surface only | Continuous online monitoring | Weld failure requiring hot work during operation |
How iFactory Integrates AE Data Into Power Plant Analytics Workflows
The technical value of acoustic emission monitoring is in the sensor data. The operational value is in what happens after the sensor captures an event. iFactory connects AE event data to four integrated workflow steps that convert raw emission signals into scheduled maintenance interventions — without requiring in-house AE specialists to interpret waveforms before every work order is generated. For specifics on how this workflow maps to your plant's current monitoring architecture, our support team can walk through the integration requirements.
AE Monitoring ROI: Cost of Detection vs. Cost of Failure
The ROI calculation for acoustic emission monitoring is driven by the cost differential between two outcomes: catching a defect in the early propagation phase via AE and scheduling a planned intervention, versus discovering the same defect at the failure stage without AE monitoring. The table below illustrates this differential for the five primary power plant AE applications.
Expert Review: What Power Plant NDT Engineers Say About Integrating AE Into Analytics Programs
Acoustic emission monitoring has been applied in research and specialist inspection contexts for decades. What has changed is the ability to integrate AE data into continuous operational analytics programs — and that integration changes the ROI calculation fundamentally.
The acoustic emission technology itself is not new. Piezoelectric sensors, time-of-flight localization, and waveform parametric analysis have been available for industrial applications since the 1970s. What kept AE from becoming a standard part of power plant condition monitoring programs was not sensor cost or sensitivity — it was the interpretation barrier. Every AE deployment required a specialist to sit with the waveform data, classify the events by hand, distinguish real crack emissions from mechanical noise, and then write a report that the maintenance team would eventually act on. By the time that cycle was complete, you were often 2 to 3 weeks from when the sensor first captured the event. At a plant where I consulted, we had an AE system on a main steam isolation valve body that had been logging elevated crack-type emission events for 23 days. The data was there. But it was sitting in a proprietary acquisition system, accessible only to the AE vendor who visited quarterly. When they finally reviewed the data, the crack had propagated to a length requiring a scheduled replacement that took the unit offline for 11 days. With an integrated analytics program that converts AE event classifications into CMMS work orders automatically, that 23-day gap becomes 1 to 2 days. The sensor sees the same things. The difference is whether the maintenance organization sees it too — in time to act in a planned window rather than an emergency. The plants getting the most value from AE monitoring are not the ones with the most sophisticated sensors. They are the ones where the sensor data flows directly into the work order system without a manual interpretation step in between."
Conclusion: The Value of AE Monitoring Is in the Integration
Acoustic emission sensors can detect active fatigue cracks, partial discharge, cavitation, and corrosion under insulation with 6 to 18 months of advance warning before failure. That detection capability has existed for decades. The reason AE monitoring has remained a specialist application rather than a standard component of power plant condition monitoring programs is not technical — it is operational. The interpretation barrier between raw AE waveform data and a scheduled maintenance work order has historically required specialist involvement that most plant maintenance organizations cannot sustain continuously.
iFactory's AI-driven analytics platform removes that barrier by automating the classification and threshold assessment steps that previously required specialist interpretation — delivering AE event classifications, severity trend scores, and automatically generated CMMS work orders directly to the maintenance planner. The sensor still sees the crack at 1 mm. The difference is that the maintenance team now sees it too, the same day, with the recommended follow-up inspection technique, the required parts, and the scheduled maintenance window — not 23 days later in a quarterly review report. Book a Demo to see iFactory's AE analytics module configured for your plant's monitored asset population and existing AE acquisition system.
Acoustic Emission Monitoring — Frequently Asked Questions
Your AE Sensors Already Detect Active Cracks, PD, and Cavitation. iFactory Makes Sure Those Detections Become Work Orders.
Automated AE fault classification, severity trending, source location, and CMMS work order generation — all inside the AI-driven analytics platform your maintenance team already uses. From 32-channel critical asset programs to comprehensive 256-channel plant-wide monitoring, iFactory connects AE sensor data to planned maintenance interventions without specialist interpretation bottlenecks.