Analytics Budget Planning Software for Power Plants
By Alistair Fenwick on May 23, 2026
Most power plant maintenance budgets are built the same way they were built fifteen years ago. A plant manager pulls last year's actual spend, adds an inflation factoradjusts for any known major overhauls on the horizon, and submits the number to the finance team. The result is a budget that reflects historical spending patterns — not the forward-looking risk profile of actual asset fleet. When a gas turbine bearing that was not on anyone's radar requires emergency replacement in Q2, that budget is wrong by $180,000. When a compressor wash interval that was scheduled every 8,000 hour turns out to need 6,200 hours based on actual degradation data, the budget is wrong again. Multiply those variances across every asset class at a 200–400 MW facility and the gap between the submitted budget and the actual spend routinely reaches 15 to 25 percent in unplanned direction.
AI-driven maintenance budget planning software changes the foundation of that calculation. Rather than projecting forward from historical actuals, it builds the maintenance budget from the current condition of the asset fleet — using degradation models, remaining useful life projections, failure probability curves, and contractor and parts cost benchmarks to generate a bottom-up spend forecast for every asset class. The result is a budget that reflects what the plant actually needs, supported by the data to defend it to finance leadership. This guide explains how AI-driven maintenance budgeting works, what it covers, and why plant managers at U.S. generation facilities are shifting their annual planning process from backward-looking to condition-driven.
Maintenance Budget Intelligence
Maintenance Budget Planning Software for Power Plants
AI-driven historical data analysis to forecast labor, parts, and contractor spend — asset by asset, across every system in your generation portfolio.
Why Maintenance Budgets at Power Plants Are Structurally Inaccurate
The 15 to 25 percent variance between submitted maintenance budgets and actual spend at U.S. power generation facilities is not primarily caused by poor planning. It is caused by planning with the wrong data. Calendar-year actuals do not capture the degradation trajectory of the current asset fleet. Last year's labor spend does not reflect the increased service frequency that a bearing operating at 78% of design life will require in the next 12 months. And a budget line that allocates fixed amounts for "rotating equipment maintenance" does not distinguish between a compressor that just completed a major overhaul and one that is 14 months past its last service with a rising vibration trend.
Backward-Looking Data Foundation
Budgets built from prior-year actuals assume next year's maintenance needs will mirror last year's — regardless of how asset conditions, operating profiles, or failure trajectories have changed. A fleet with three assets approaching major overhaul windows looks identical to a post-overhaul fleet in a historical spend report.
No Unplanned Event Reserve Logic
Standard budget templates include a contingency line — typically 10 to 15 percent of planned spend — applied uniformly regardless of the actual risk profile of the asset fleet. AI-driven planning replaces uniform contingency with asset-specific failure probability weighting, sizing the reserve to the actual risk rather than a rule-of-thumb percentage.
Labor and Parts Costs Siloed by Department
Maintenance budgets assembled from department-level inputs — mechanical, electrical, instrumentation, civil — produce totals that are the sum of individual requests rather than a system-level view of what the asset fleet actually requires. Overlapping assumptions and missing cross-system dependencies are the predictable result.
22%
Average variance between submitted and actual O&M spend at U.S. power plants using historical-only budgeting
$340K
Average unbudgeted emergency maintenance spend per year at a 250 MW combined cycle facility
67%
Of plant managers report that their current budgeting process cannot incorporate asset condition data
$1.8M
Average 5-year capital and O&M savings from shifting to condition-driven budget planning at 200–400 MW facilities
Ready to build your next maintenance budget from asset condition data rather than last year's actuals? Schedule your budget planning assessment with iFactory's power generation analytics team.
What AI-Driven Maintenance Budget Planning Software Actually Does
Purpose-built maintenance budget planning software for power plants is not a spreadsheet automation tool or a CMMS reporting module. It is a forward-looking spend forecasting engine that combines asset condition data, degradation model outputs, historical cost benchmarks, and contractor market rates to build a bottom-up maintenance budget that reflects what the plant actually needs in the coming 12 to 36 months — with defensible data behind every line item.
Labor Cost Forecasting
Condition-Driven Labor Hour and Rate Projections by Asset Class
AI-driven labor forecasting starts from the current degradation trajectory of each monitored asset — not from last year's work order actuals. For each asset class, the platform projects the number of maintenance events expected in the forecast period, classifies those events by task type and skill requirement, and applies craft rate benchmarks to generate a labor cost forecast by trade category. Assets approaching major overhaul windows generate proportionally higher labor projections; recently serviced assets generate lower ones. The result is a labor budget built from the specific work the fleet will require — not from what it happened to require last year.
Labor forecast by asset class, trade category, and quarter; variance from prior-year actuals with explanation; confidence interval based on asset condition uncertainty; export-ready format for budget submission templates
Parts and Materials
Remaining Useful Life-Based Parts Demand Forecasting
Parts and materials forecasting is driven by the platform's remaining useful life projections for each monitored component. When an asset's RUL model indicates a bearing replacement within the next 6 to 9 months, the parts forecast populates a line item with the appropriate replacement part, current procurement cost, and lead time flag if the part requires pre-ordering. Consumable demand — filter elements, lubricants, sealing materials — is forecast from operating hour projections and usage rate benchmarks. The platform cross-references current parts inventory levels in the CMMS against projected demand, identifying pre-buy requirements before budget submission to avoid emergency procurement premiums.
Parts Categories Forecasted
Rotating equipment componentsElectrical system partsFilter and consumable demandLong-lead procurement flagsInventory gap analysisEmergency spares reserve
Platform Output
Itemized parts demand forecast by asset and quarter; current price benchmarks from procurement history; long-lead parts pre-buy schedule; inventory gap summary; total parts budget by asset class with confidence range
Contractor Spend
OEM and Third-Party Service Contract Cost Modeling
Contractor spend forecasting covers both scheduled OEM service visits and discretionary third-party maintenance services that the platform's condition models are projecting will be needed in the forecast period. For facilities with long-term service agreements, the platform maps scheduled outage windows and associated LTSA costs against the asset condition calendar — confirming that scheduled service windows align with the actual condition-based intervention schedule and flagging gaps where the LTSA schedule is either too aggressive or insufficiently frequent for current operating conditions. Discretionary contractor spend is projected from the failure mode library, mapping developing conditions to the specific specialty contractor resources they will require.
Contractor spend forecast by service category and quarter; LTSA schedule vs. condition-based interval comparison; specialty contractor pre-qualification recommendations for projected scope; total contractor budget by asset class
Unplanned Reserves
Failure Probability-Weighted Contingency Sizing
The unplanned maintenance reserve in an AI-driven budget is not a uniform percentage of planned spend — it is a probability-weighted sum of the expected unplanned event costs across the asset fleet. Each asset's failure probability in the forecast period is estimated from its current degradation trajectory, remaining useful life confidence interval, and historical fleet failure rate for that failure mode. The platform multiplies failure probability by consequence cost for each asset to generate an expected value of unplanned spend — then aggregates those expected values across the fleet to produce an unplanned reserve that is sized to the actual risk profile rather than a rule-of-thumb contingency. This approach typically reduces the contingency allocation while improving coverage of actual unplanned events.
Reserve Calculation Inputs
Asset failure probabilityConsequence cost by event typeDetection confidence factorFleet failure rate benchmarksReplacement power costRepair mobilization cost
Platform Output
Probability-weighted unplanned reserve by asset class; highest-risk assets with expected unplanned event cost; reserve sizing comparison vs. uniform contingency method; sensitivity analysis on key risk assumptions
Budget Planning Comparison: Manual Process vs. AI-Driven Platform
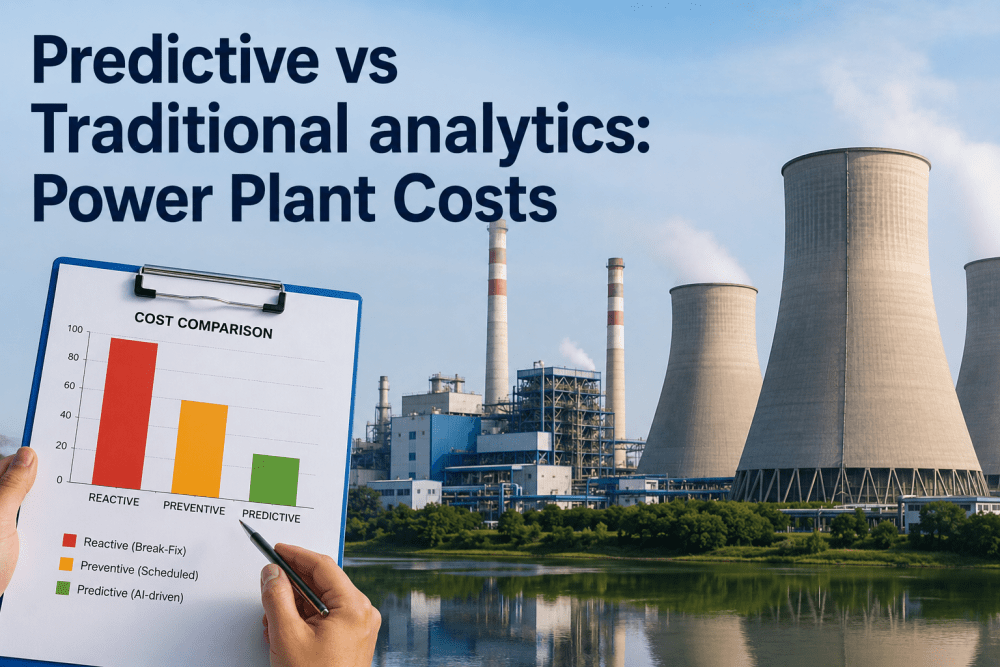
The operational and financial differences between a conventional annual maintenance budgeting process and an AI-driven platform are visible at every stage — from the data inputs used to build the budget to the quality of the line-item defense a plant manager can provide when finance challenges a number. The comparison below maps both processes across the dimensions that determine whether a maintenance budget is trusted by the organization.
Manual Budget Process
Data Foundation
Prior-year actuals + inflation factor
Asset Condition Input
None — calendar age used as proxy
Unplanned Reserve Method
Uniform 10–15% contingency
Parts Demand Forecasting
Department-level estimates — no RUL input
Budget Variance (typical)
18–28% over or under
Finance Defense Quality
Narrative only — no data-backed line items
Build Time
4–8 weeks of manual assembly
VS
AI-Driven Budget Platform
Data Foundation
Live asset condition + RUL projections
Asset Condition Input
Continuous — degradation models updated daily
Unplanned Reserve Method
Probability-weighted by asset failure risk
Parts Demand Forecasting
Item-level forecast from RUL + usage benchmarks
Budget Variance (typical)
6–9% — within finance planning tolerance
Finance Defense Quality
Asset-level data + condition evidence per line item
Build Time
Platform generates draft in hours; manager reviews
Want to see how AI-driven budgeting applies to your specific asset mix and current planning cycle? Book a 30-minute budget planning assessment with iFactory's power generation team.
The AI-Driven Budget Build Workflow: From Asset Data to Submitted Budget
The practical workflow for building an AI-driven maintenance budget follows a defined sequence — from current asset condition assessment through spend projection, scenario testing, and final budget package assembly. The following steps trace that workflow for a 250 MW combined cycle facility preparing its annual O&M budget submission.
01
Asset Condition Snapshot and Remaining Useful Life Assessment
The platform generates a current-state asset health report across all monitored equipment classes — gas turbines, HRSGs, generators, balance of plant, and rotating equipment. Each asset receives a condition score, a remaining useful life estimate with confidence interval, and a projected maintenance event schedule for the coming 12 to 36 months. This snapshot replaces the calendar-age assumption with actual degradation data as the foundation for every subsequent budget calculation.
Output: Asset health register with RUL projections and event schedules per asset class
02
Planned Maintenance Event Scheduling and Cost Mapping
Each projected maintenance event is mapped to a cost structure: estimated labor hours by craft, parts demand by component, contractor scope requirements, and outage duration. The platform applies current cost benchmarks from the facility's own procurement history and industry rate data — not generic national averages — to produce event-level cost estimates. Outage windows are scheduled into the budget calendar based on the optimal intervention timing generated by the platform's degradation models.
Output: Quarterly maintenance event schedule with event-level labor, parts, and contractor cost estimates
03
Unplanned Reserve Calculation From Failure Probability Models
The unplanned reserve is built from the probability-weighted expected cost of unplanned events across the fleet. Each asset's failure probability in the forecast period is derived from its current degradation trajectory and historical fleet failure rates for its identified failure modes. The platform calculates the expected value of unplanned spend per asset and aggregates those values into an asset-specific reserve recommendation — larger reserves for high-probability failure modes, smaller reserves for recently serviced or low-risk assets.
Output: Probability-weighted unplanned reserve by asset class; highest-risk asset identification with supporting evidence
04
Scenario Analysis: Budget Sensitivity to Operating and Risk Assumptions
Before submitting the budget, the platform runs scenario analyses that quantify how the spend projection changes under different operating assumptions. What does the budget look like if the plant cycles 20 percent more than the baseline assumption? What is the financial impact if a specific high-risk asset reaches failure during the budget period? What is the cost difference between the planned maintenance schedule and a deferred-maintenance scenario? These scenarios give plant managers quantified, defensible answers to the what-if questions that finance teams routinely ask.
Output: Budget sensitivity ranges under three to five operating scenarios; highest-impact risk factors identified with cost range
05
Budget Package Assembly and Finance Submission Documentation
The platform assembles the complete budget submission package — line-item spend by asset class, labor and parts and contractor breakdowns, unplanned reserve with methodology documentation, scenario analysis summary, and a comparison to prior-year actuals with variance explanation. Every line item is linked to the underlying asset condition data that generated it, so the plant manager can defend any number in the budget with a specific data reference rather than a narrative estimate. The package exports in formats compatible with standard finance planning templates and ERP systems.
Output: Complete budget submission package with data-backed line items; ERP-compatible export; variance-from-prior-year narrative with condition evidence
06
In-Year Budget Tracking and Reforecast Against Actual Conditions
After submission, the platform tracks actual spend against the forecast continuously — updating the budget projection as actual maintenance events are completed and recorded in the CMMS and as asset condition models evolve with new sensor data. Mid-year reforecasts are generated automatically when developing conditions indicate that the original budget allocation for a specific asset class will be materially exceeded. This continuous tracking replaces the quarterly manual budget review with a live view of actual versus forecast that plant managers can access at any time.
Output: Live actual vs. forecast tracking; automated mid-year reforecast triggers; year-end variance analysis with root cause attribution
Asset-Class Budget Allocation: Where AI-Driven Planning Changes the Numbers
The most immediate financial impact of shifting
Asset-Class Budget Allocation: Where AI-Driven Planning Changes the Numbers
The most immediate financial impact of shifting from historical to condition-driven budget planning is visible in the asset-class allocation — specifically, in how spend is distributed across equipment categories based on actual risk rather than historical patterns. The following table illustrates how a typical AI-driven budget allocation differs from a historical-actuals-based budget at a 250 MW combined cycle facility.
Asset Class
Historical Budget Method
AI-Driven Condition Method
Typical Reallocation
Gas Turbine
Prior-year LTSA cost + 3% inflation
LTSA cost adjusted for actual hot-section inspection interval based on equivalent operating hours and fuel type cycling
±$40K–$120K vs. historical
HRSG / Steam Systems
Fixed annual inspection budget regardless of tube condition
Inspection scope driven by current tube health scores; additional budget flagged where flow-accelerated corrosion indicators are elevated
+$15K–$60K if corrosion risk elevated
Generator
Biennial inspection on calendar schedule
Inspection timing driven by insulation resistance trend and partial discharge data — can extend or advance the interval based on condition
−$30K–$80K if condition exceeds baseline
Rotating Equipment (BOP)
Standard overhaul intervals regardless of operating profile
Condition-based overhaul scheduling; units with favorable condition extend intervals; units with developing degradation advance
Net −8% to −18% vs. calendar-based
Electrical Systems
Fixed transformer and switchgear inspection budgets by equipment age
Inspection scope and frequency driven by DGA trends, insulation resistance, and thermal imaging history
Reallocated from age-based to condition-based priority
Contingency Reserve
Uniform 12–15% of total planned spend
Probability-weighted expected unplanned event cost by asset class — typically 7–10% of planned spend with better coverage
−3% to −6% of total budget with improved accuracy
Get a Condition-Driven Budget Projection for Your Facility
iFactory's team builds a site-specific maintenance budget projection from your current asset condition data and operating history — showing you where your historical budget is over- or under-allocated before your next submission cycle.
Measured Outcomes: What Plants Achieve With AI-Driven Budget Planning
The financial and organizational value of condition-driven budget planning compounds across multiple dimensions simultaneously — tighter variance, better finance relationships, optimized capital timing, and reduced emergency spend. The outcomes below reflect results reported by U.S. power generation facilities deploying AI-driven maintenance budget planning platforms within their first two annual budget cycles.
7.2%
Avg. Budget Variance
vs. 22% industry average under historical-only budgeting — within the 8–10% finance planning tolerance at most generation companies
$210K
Average Annual Emergency Spend Reduction
From condition-based intervention timing that converts emergency reactive events into planned maintenance windows at lower total cost
31%
Reduction in Contingency Reserve Size
Probability-weighted reserves are typically smaller than uniform contingency — while covering a higher percentage of actual unplanned events that occur
6 hrs
Budget Build Time (Platform Draft)
vs. 4–8 weeks of manual department-level assembly — plant manager reviews and adjusts rather than building from scratch
$1.8M
5-Year O&M Optimization
Combined from optimized maintenance timing, reduced emergency spend, improved capital deferral decisions, and contractor cost management at 200–400 MW facilities
92%
Finance Approval Rate on First Submission
Data-backed line items with condition evidence reduce budget revision cycles — most submissions approved without significant cuts when supported by AI-generated documentation
Want to see how AI-driven budgeting applies to your specific asset mix and current planning cycle? Book a 30-minute budget planning assessment with iFactory's power generation team.
Expert Review: What Plant Managers Should Demand From a Budget Planning Platform
Expert Perspective
After supporting maintenance budget development at fourteen power generation facilities over seventeen years — from simple-cycle peakers to large combined cycle plants — the pattern of what separates useful budget planning tools from impressive-looking platforms that do not survive contact with the finance process is consistent. Here are the specific capabilities every plant manager should verify before committing to any maintenance budget planning software.
Demand asset-level line items, not asset-class totals. A budget planning platform that produces "rotating equipment maintenance — $480,000" is not useful in a finance review meeting. Your CFO will ask which rotating equipment, what work, and why that number rather than last year's $420,000. You need line items that trace to specific assets, specific failure modes or service events, specific labor and parts cost components, and specific condition evidence. Any platform that cannot produce that granularity is generating budget estimates, not budget justifications.
Verify that the unplanned reserve method uses actual failure probabilities — not blanket percentages. Uniform contingency reserves are the most defensible thing to cut in a budget challenge meeting, because there is no specific evidence supporting the number. A probability-weighted reserve — where you can show the finance team exactly which assets are driving the contingency line and what their estimated failure probability is — is significantly harder to cut without accepting the operational risk it represents. Verify that the platform's reserve methodology is documented and can be presented in a format that a non-technical finance audience can evaluate.
Require integration with both the CMMS and the asset condition analytics platform — not just one or the other. A budget planning tool connected only to the CMMS knows what work was done and what it cost. A tool connected only to the analytics platform knows what work is predicted. You need both — the CMMS provides the actual cost benchmarks that ground the projections in real procurement and labor rate history, and the analytics platform provides the condition data that determines what work is actually needed. Platforms that accept manual inputs for either of these data streams are introducing the same estimation error that historical budgeting already uses.
Confirm that scenario modeling is native — not an exported spreadsheet exercise. Budget scenarios — cycling frequency changes, deferred maintenance cases, early replacement decisions — need to be run inside the same platform that built the base budget, using the same models and cost benchmarks. Exporting the budget to a spreadsheet and running scenarios manually introduces the same estimation errors the platform was supposed to eliminate. If the vendor's scenario analysis capability requires a separate modeling tool or manual adjustment of exported data, the platform's scenario functionality is not mature enough for production budget planning.
Senior Plant Operations and Finance AdvisorPower Generation Asset Management, 17 Years — CMRP Certified, PE Licensed
Want to see how AI-driven budgeting applies to your specific asset mix and current planning cycle? Book a 30-minute budget planning assessment with iFactory's power generation team.
Conclusion
The case for AI-driven maintenance budget planning at U.S. power plants is straightforward: the data needed to build an accurate, defensible maintenance budget already exists in the plant historian, the CMMS work order records, and the asset condition analytics platform. The gap is not data availability — it is a planning tool that can connect those data sources into a forward-looking spend forecast that finance leadership can evaluate and approve with confidence.
Plants that make that transition do not simply improve their budget accuracy. They change the organizational standing of the maintenance function in budget negotiations — shifting from submitting an estimate that gets cut to presenting an evidence-based projection that finance can evaluate against documented risk. The 7 to 9 percent variance reduction and 92 percent first-submission approval rate reported at deployed facilities are not primarily a technology outcome. They are a credibility outcome — the result of arriving at a budget discussion with condition data behind every number instead of historical actuals and an inflation factor.
Ready to build your next maintenance budget from asset condition data rather than last year's actuals? Schedule your budget planning assessment with iFactory's power generation analytics team.
Frequently Asked Questions
Yes. iFactory's budget planning module connects natively with SAP Plant Maintenance, IBM Maximo, Infor EAM, and Oracle EBS — pulling actual work order costs, labor hours, parts consumption, and contractor invoices directly from CMMS records to build the cost benchmarks that ground every forward-looking projection. ERP financial data — general ledger actuals, purchase order history, contractor invoice records — supplements CMMS data where available. The platform uses your actual procurement and labor rate history rather than generic industry benchmarks, which significantly improves the accuracy of cost projections for your specific contractor market and purchasing agreements. Budget output exports in formats compatible with SAP FI, Oracle Financials, and standard Excel-based planning templates used by most power generation finance teams.
The platform generates 1-year, 3-year, and 5-year budget projections simultaneously — allowing plant managers to present both the annual O&M submission and a multi-year capital planning view in the same budget cycle. For assets approaching end-of-life, the platform produces a replacement-versus-continued-operation cost analysis that integrates into the capital budget projection — quantifying the escalating O&M cost of continued operation against the capital cost of replacement at various timing options. This multi-year view is particularly valuable for major overhaul planning: the platform projects the compounding maintenance cost and reliability risk of deferring a major overhaul, providing the financial case for capital allocation in the optimal budget year rather than the nearest convenient one.
Yes. The platform supports configurable budget hierarchies that can roll up to any organizational structure the finance team requires. A fleet operator with multiple generation sites can view budgets by individual plant, by fuel type, by asset class across the portfolio, or by cost center — with the ability to drill from the consolidated view down to the individual asset-level line item that drives each number. Budget submissions can be exported in the specific format and structure each plant's finance reporting system requires. For organizations with shared service structures — where one maintenance team supports multiple units — the platform can allocate shared labor and contractor costs across units using configured allocation methods.
For assets with limited local failure history, the platform uses a combination of physics-based remaining useful life models — which do not require failure event history to generate degradation projections — and fleet-wide cost benchmarks from comparable equipment at other facilities. These fleet benchmarks are specific to equipment class, vintage, and operating profile, not generic national averages. As local CMMS history accumulates over 12 to 24 months, the platform progressively weights local actuals more heavily than fleet benchmarks in its cost projections. For most asset classes, the platform reaches comparable accuracy to history-rich assets within two budget cycles, because the condition-based projection methodology is inherently less dependent on historical failure frequency than statistical actuarial approaches.
iFactory's maintenance budget planning module is available as a standalone subscription or as part of the broader plant analytics platform. For a 200–400 MW generation facility, the annual subscription for the budget planning module ranges from $24,000 to $48,000 including all asset class coverage, CMMS and ERP integration, multi-year projection capability, scenario modeling, and budget submission documentation. Implementation services for initial CMMS integration and historical cost data ingestion typically run $8,000 to $16,000 as a one-time cost. Most plant managers calculate positive ROI within the first budget cycle from reduced emergency spend alone — the $210,000 average annual emergency spend reduction at comparable facilities covers the platform cost several times over in the first operating year. Contact iFactory for a site-specific pricing and ROI estimate based on your asset configuration and current budget process.
Build Your Next Maintenance Budget From Asset Condition Data — Not Last Year's Actuals
From labor and parts forecasting to probability-weighted contingency reserves, iFactory delivers AI-driven maintenance budget planning sized for U.S. power generation facilities — reducing budget variance from 22% to under 8% within two annual planning cycles.