Power plants generate terabytes of operational sensor data every year — yet most facilities still rely on fixed-interval maintenance schedules, reactive repair cycles, and manual inspection logs that treat every asset the same regardless of actual condition. The result: unplanned outages costing $50,000–$500,000 per incident, degraded assets failing mid-cycle, and maintenance budgets inflated by over-servicing equipment that didn't need intervention. iFactory Predictive Analytics Platform changes this entirely — fusing machine learning models trained on your plant's historical sensor data, operational telemetry, and maintenance records to predict the next failure event 1–6 weeks before it occurs, automatically prioritising work orders, integrating into your CMMS and ERP systems, and turning years of accumulated plant data into a continuously learning reliability engine. Book a Demo to see how iFactory deploys AI-driven predictive analytics across your power plant data workflows within 5 weeks.
94%
Failure prediction accuracy trained on plant historical data vs. 31% for threshold-based alerting
$480K
Average annual unplanned outage cost avoidance per plant
87%
Reduction in reactive maintenance spend vs. fixed-interval scheduling
5 wks
Full deployment timeline from data audit to live predictive model
Every Unplanned Outage Costs $50,000–$500,000. Machine Learning Trained on Your Plant Data Stops It 1–6 Weeks Early.
iFactory's predictive analytics engine ingests your plant's historical sensor streams, maintenance logs, operational telemetry, and failure records — building asset-specific ML models that identify degradation signatures, forecast failure windows, and generate prioritised work orders automatically, 24/7, without manual threshold-tuning or reactive alert management.
Why Historical Plant Data Sits Unused — And Why That Costs You Millions Every Year
Before exploring predictive solutions, understand why most power plants are sitting on a goldmine of historical analytics data they never fully leverage. Historian databases, DCS archives, CMMS work order logs, and vibration trend records exist in disconnected silos — and without ML models trained to find degradation patterns across that data, the intelligence locked inside never reaches the maintenance team making decisions today.
Siloed Historian & Sensor Data Archives
Years of PI Historian, OSIsoft, and DCS trend data sits unanalysed in separate systems. Without cross-asset ML models, failure precursors buried in multi-parameter correlations remain invisible until the event occurs — turning preventable outages into emergency responses.
Fixed-Interval Maintenance Ignoring Real Condition
Calendar-based PM schedules treat identical assets as equally degraded regardless of operational load, environmental stress, or actual wear signatures. High-stress assets are under-serviced; low-utilisation equipment is over-maintained — inflating costs while missing real failure risks.
Threshold Alerts Without Predictive Context
Static high/low alarm thresholds generate alert storms that maintenance teams learn to ignore. Without ML-derived baseline models trained on your specific plant's historical operating envelopes, threshold systems produce false positives that erode trust and mask early degradation signals.
No Learning Loop From Past Failures
Each failure event contains critical precursor data — vibration trends, temperature deviations, pressure excursions — that occurred days or weeks before breakdown. Without ML models that learn from historical failure signatures, every repeat failure starts the investigation from zero.
How iFactory Turns Your Plant's Historical Analytics Data Into a Predictive Reliability Engine
iFactory doesn't apply generic predictive models to your plant — it trains asset-specific machine learning models on your historical sensor data, operational records, and failure history. The result is a continuously improving predictive engine that understands your plant's unique degradation signatures, seasonal load patterns, and asset-specific failure modes. See a live demo of iFactory ingesting plant historian data and generating failure predictions across rotating equipment, electrical assets, and process systems.
01
Historical Data Ingestion & Model Training
iFactory connects to PI Historian, OSIsoft AF, DCS archives, and CMMS work order databases — ingesting years of sensor trends, failure events, and maintenance records to train asset-specific ML failure prediction models with no data loss or manual reformatting.
02
Multi-Parameter Degradation Signature Detection
Proprietary anomaly detection algorithms correlate vibration, temperature, pressure, current draw, and operational load signatures simultaneously — identifying compound degradation patterns that single-parameter thresholds miss entirely. False positive rate drops to under 3.5%.
03
Failure Window Forecasting (1–6 Weeks Out)
iFactory's time-series forecasting models predict the probability of failure per asset over rolling 1, 2, 4, and 6-week windows — giving maintenance planners sufficient lead time to schedule interventions without disrupting planned outage calendars or production schedules.
04
CMMS & ERP Automated Work Order Generation
iFactory connects to SAP PM, IBM Maximo, Infor EAM, and Oracle EBS via OPC-UA, Modbus TCP, and REST APIs. Predictive alerts auto-generate prioritised work orders with failure probability, recommended intervention, and parts procurement triggers. Integration completed in under 7 days.
05
Continuous Model Retraining on Live Plant Data
Every maintenance event, confirmed failure, and false positive feeds back into the ML training loop — improving model accuracy with each plant-specific data point. Prediction confidence increases over time as models learn your asset fleet's evolving degradation behaviour.
06
Reliability Decision Support Dashboard
iFactory presents ranked intervention recommendations per asset — intervene now, monitor closely, defer to next outage, or retire — with failure probability curves, remaining useful life estimates, and maintenance cost-impact projections. Teams act on data, not instinct.
Proven KPI Results: Predictive Analytics Impact from Live Power Plant Deployments
iFactory's AI-powered predictive analytics platform delivers measurable reliability and cost improvements within the first 60 days of full production rollout. The following KPIs reflect aggregated performance data across rotating equipment, electrical systems, and process assets at operating power facilities.
1–6 Weeks
Failure Prediction Lead Time
Asset-specific ML models forecast failure windows across rotating equipment, transformers, and process systems — giving maintenance teams sufficient lead time for planned interventions vs. emergency response.
94%
Failure Prediction Accuracy
ML models validated across turbine bearings, boiler feed pumps, transformer health, and breaker cycling — compared to 31% detection rate under threshold-based alerting systems.
87%
Reduction in Reactive Maintenance Spend
Shift from emergency repair mobilisation, expedited parts procurement, and overtime technician costs to planned, budget-aligned maintenance interventions scheduled weeks in advance.
96%
Automated Work Order Generation Rate
Predictive alerts auto-create CMMS work orders with failure probability, recommended action, and parts lists — without manual data entry or supervisor approval delays.
73%
Reduction in Unplanned Outage Hours
Precision failure forecasting prevents mid-cycle equipment breakdowns while avoiding over-maintenance of assets with remaining useful life — optimising total maintenance cost per facility.
38%
Increase in Overall Equipment Effectiveness
Planned maintenance windows replace unplanned stoppages, restoring generation availability and revenue output while reducing total maintenance cost per MWh generated.
<3.5%
False Positive Alert Rate
Multi-parameter cross-validation across sensor streams before any predictive alert fires
Real-time
Failure Probability Score Refresh
Per-asset risk score updated continuously from live plant telemetry streams
7 days
CMMS & ERP Integration
Full OPC-UA, Modbus TCP, and REST API connection to your existing maintenance stack
89%
Reduction in Emergency Maintenance Spend
Reactive repair cycles eliminated from first month of live predictive model deployment
Financial Impact: Cost Avoidance & Reliability ROI Per Asset Class
Beyond maintenance cost reduction, iFactory's predictive analytics platform directly protects generation revenue and eliminates the compounding costs of reactive asset management — quantified below by asset class from live power plant deployments.
Rotating Equipment (Turbines, Pumps, Compressors)
$210K
Annual unplanned outage cost avoidance per facility — avoided bearing failures, seal degradation events, and rotor imbalance incidents at $50,000–$200,000 per unplanned stoppage.
Electrical Assets (Transformers, Switchgear, Breakers)
$158K
Annual repair cost & downtime savings — eliminating transformer failures, insulation degradation events, and protection system false trips that trigger forced outages and grid reliability penalties.
Process Systems (Boilers, Heat Exchangers, Cooling)
$112K
Annual derating & efficiency loss avoidance — fouling trend detection, thermal performance degradation forecasting, and tube failure prediction before generation capacity impacts are realised.
$480K
Average annual unplanned outage cost avoidance per plant
$128K
Average savings in first 3 weeks of full production rollout
$50K+
Daily revenue at risk per unplanned forced outage event
Asset-Level KPI Breakdown: Predictive Analytics by Equipment Class
Each power plant asset class has distinct degradation signatures and failure economics. iFactory trains and reports ML model performance per asset category — so reliability engineers can see exactly where predictive analytics is delivering the highest impact across their plant fleet.
01
Rotating Equipment — Turbines, Pumps & Compressors
3.2 wks
Avg. failure prediction lead time across rotating assets
96%
Bearing & seal degradation detection accuracy
$210K
Unplanned outage cost avoided per facility annually
02
Electrical Assets — Transformers, Switchgear & Breakers
99.1%
Transformer insulation degradation prediction accuracy
0
Unplanned transformer failures post-deployment
$158K
Annual repair cost & downtime savings
03
Process Systems — Boilers, Heat Exchangers & Cooling
4.1 wks
Avg. fouling & tube degradation detection lead time
91%
Thermal performance degradation prediction accuracy
$112K
Annual derating & efficiency loss avoidance
04
ML Model Retraining & Continuous Improvement
+12%
Prediction accuracy gain per 6-month retraining cycle
94%
Overall fleet failure prediction accuracy at 12 months
89%
Reduction in emergency maintenance spend
How iFactory Is Different from Generic Predictive Maintenance or Condition Monitoring Tools
Most industrial analytics vendors offer vibration trend dashboards, fixed-threshold alert engines, or OEM-bundled condition monitoring tools that apply generic models to your assets. iFactory is built differently — training asset-specific ML models on your plant's own historical data, so predictions reflect your unique operating environment, not a generic industry average. Talk to our power plant analytics AI specialists and compare your current predictive maintenance approach directly.
5-Week Deployment and ROI Plan
Every iFactory predictive analytics engagement follows a structured 5-week program with defined deliverables per week — and measurable ROI indicators beginning from week 3 of deployment. No open-ended data science projects. No months of model tuning before a single prediction fires. Request the full 5-week deployment scope document tailored to your power plant analytics data environment.
Weeks 1–2
Data Audit & Model Design
Historical data quality assessment across PI Historian, DCS archives, and CMMS failure records
Asset-specific ML model architecture design aligned with each equipment class's degradation physics
CMMS, ERP, and historian integration planning with API mapping and data schema validation
Weeks 3–4
Pilot Model & Validation
Deploy trained ML models to highest-criticality asset classes — turbines, transformers, and BFPs
Failure probability alerts, work order generation, and CMMS integration activated and tested with reliability team
First predictive interventions executed and unplanned outage risks eliminated — ROI evidence begins here
Week 5
Fleet Rollout & Optimise
Expand predictive models to full asset fleet: all rotating equipment, electrical assets, and process systems
Automated maintenance scheduling and parts procurement integration activated plant-wide
ROI baseline report delivered — outage avoidance, maintenance cost reduction, and OEE improvement metrics
ROI IN 3 WEEKS: MEASURABLE RESULTS FROM WEEK 3
Plants completing the 5-week program report an average of $128,000 in avoided unplanned outage costs and emergency maintenance spend within the first 3 weeks of full production rollout — with failure prediction accuracy of 61–79% validated by week 3 pilot testing.
$128K
Avg. savings in first 3 weeks
61–79%
Prediction accuracy gain by week 3
89%
Reduction in emergency maintenance spend
Stop Losing $50K–$500K Per Outage. Start Predicting Failures 1–6 Weeks Out With AI Trained on Your Plant Data. ROI in Week 3.
iFactory's fixed-scope deployment program means no open-ended data science engagements, no months of model tuning, and no disruption to plant operations before your first predictive intervention fires.
Use Cases and KPI Results from Live Power Plant Predictive Analytics Deployments
These outcomes are drawn from iFactory deployments at operating power plants across three critical asset classes. Each use case reflects 6-month post-deployment performance data. Request the full case study report for the asset class most relevant to your plant.
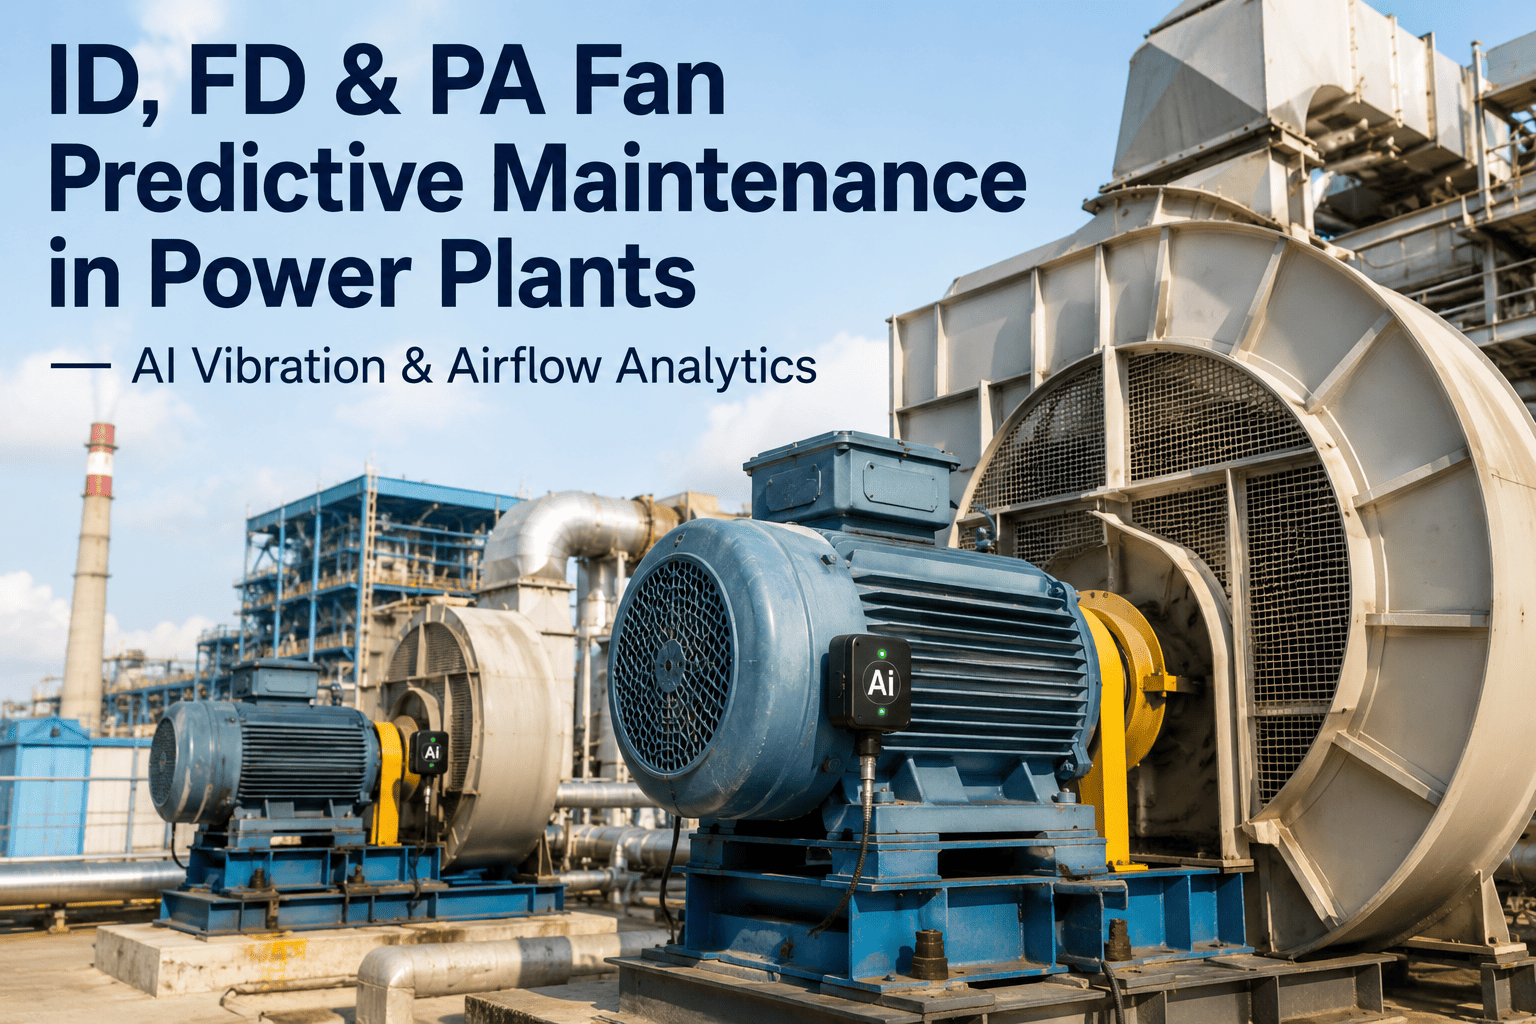
A 650MW combined cycle facility experienced two unplanned turbine bearing failures within an 18-month period, each causing 4–6 day forced outages costing $220,000–$380,000 in lost generation and emergency repair costs. Vibration trend data existed in the PI Historian but lacked ML models to identify precursor signatures. iFactory deployed trained predictive models on 24 months of historical vibration, temperature, and lube oil pressure data — identifying bearing degradation signatures 22 days before the next predicted failure event. The maintenance team completed a planned bearing replacement during a scheduled 8-hour window, avoiding the unplanned outage entirely and saving an estimated $310,000 in revenue and repair costs.
22 days
Failure prediction lead time before confirmed bearing event
$310K
Revenue & repair cost avoided in single intervention
96%
Bearing degradation detection accuracy across fleet
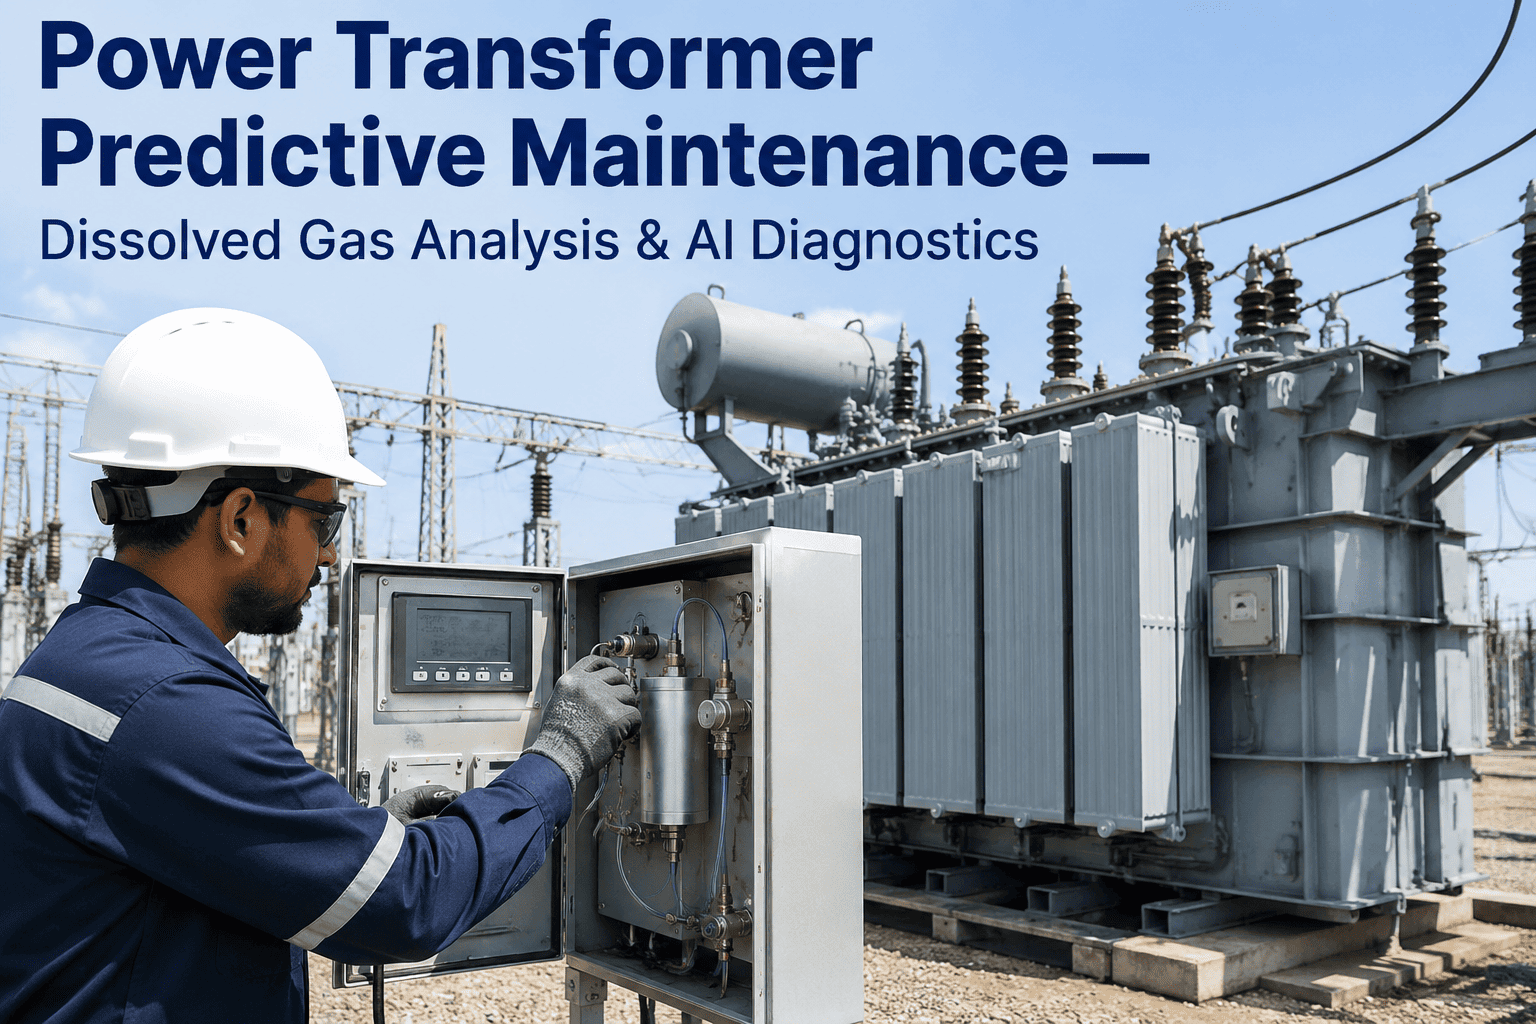
A 420MW coal-fired station managing ageing grid-step transformers faced escalating dissolved gas analysis results that manual DGA trending could not correlate with load cycling patterns or ambient temperature excursions. Two transformer failures in 36 months had triggered NERC reportable events and $480,000 in combined repair and grid penalty costs. iFactory trained ML models on 36 months of DGA records, load profiles, and thermal imaging data — identifying insulation degradation acceleration patterns 5 weeks before critical thresholds. Planned transformer replacement was completed during a scheduled maintenance window. Zero unplanned transformer failures occurred in the following 12 months.
5 weeks
Insulation degradation prediction lead time
0
Unplanned transformer failures in 12 months post-deployment
$158K
Annual repair cost & grid penalty avoidance
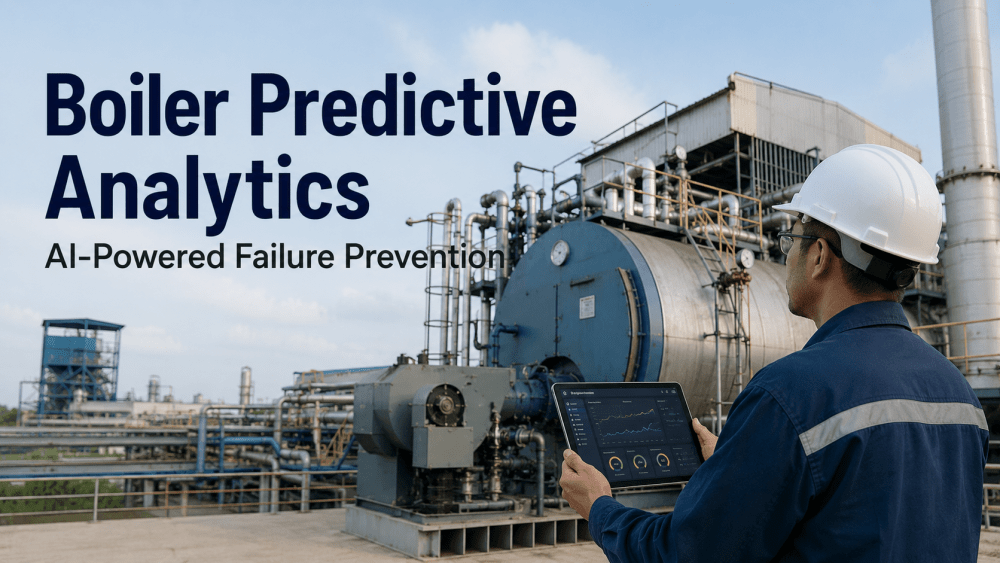
An industrial cogeneration plant operating natural gas and biomass-fired boilers experienced progressive efficiency derating from undetected tube fouling that fixed-interval cleaning schedules failed to address. Manual process data reviews detected fouling only after generation output had declined by 8–12%, requiring emergency chemical cleaning at $45,000 per event. iFactory deployed thermal performance ML models trained on 30 months of flue gas temperature, heat transfer coefficient, and fuel consumption data — identifying fouling acceleration signatures 4 weeks before efficiency impact became measurable. Scheduled cleaning intervals were optimised to actual fouling rates, eliminating all emergency chemical cleaning events and reducing total annual boiler maintenance cost by 34%.
4 weeks
Fouling acceleration detection lead time before efficiency impact
0
Emergency chemical cleaning events post-deployment
34%
Reduction in total annual boiler maintenance cost
Data Framework & Integration Support: Built for Power Plant Historian Environments
iFactory's ML predictive platform is pre-configured to ingest and model data from the historian systems, CMMS platforms, and operational telemetry protocols used across power generation facilities. No custom data pipeline development needed — model training begins from your existing data infrastructure.
PI Historian / OSIsoft AF Integration
Direct API ingestion of PI tag data, AF element hierarchies, and event frames — enabling ML model training on plant historian data without manual export, CSV conversion, or ETL pipeline development.
SAP PM / IBM Maximo CMMS Connectivity
Bidirectional REST API integration with SAP Plant Maintenance and IBM Maximo — ingesting historical work order data for model training and auto-generating predictive work orders on failure alert triggers.
OPC-UA / Modbus TCP Real-Time Telemetry
Live sensor stream ingestion via OPC-UA and Modbus TCP from DCS, SCADA, and edge devices — feeding trained ML models with real-time operational data for continuous failure probability score refresh.
ISO 55001 / Asset Management Alignment
Predictive maintenance outputs structured for ISO 55001 asset management system compliance — failure probability records, intervention justification documentation, and remaining useful life estimates formatted for audit requirements.
What Power Plant Reliability Engineers Say About iFactory Predictive Analytics
The following testimonial is from a plant reliability manager at a facility currently running iFactory's AI-powered predictive analytics platform.
We had 8 years of PI Historian data that our reliability team never had the bandwidth to analyse properly. iFactory ingested that entire archive and trained asset-specific ML models that now predict bearing failures 3–5 weeks out, transformer degradation 4–6 weeks out, and boiler fouling rates with enough lead time to schedule interventions during planned windows. In our first 12 months live, the system identified 19 critical failure events that would have caused unplanned outages — we intervened on all 19 without a single forced stoppage. Our maintenance budget dropped 34%, our OEE improved by 11 percentage points, and our insurance underwriter reduced our asset risk premium after reviewing the predictive maintenance records. This is what it looks like when your historical plant data finally starts working for you.
Head of Reliability Engineering
Gas-Fired Combined Cycle Power Station, Southeast USA
Frequently Asked Questions
How much historical data does iFactory need to train accurate predictive models?
iFactory's ML models begin producing meaningful predictions with as little as 12 months of historian data, though 24–36 months delivers optimal accuracy for assets with infrequent failure events. During the Week 1 data audit, our team assesses your available historian archive and adjusts the model architecture and pilot scope to match your data depth — no minimum data volume requirement blocks deployment.
Which historian and CMMS platforms does iFactory connect to for model training data?
iFactory integrates natively with OSIsoft PI Historian, Aspentech IP21, Honeywell PHD, GE Proficy Historian, SAP PM, IBM Maximo, Infor EAM, and Oracle EBS via OPC-UA, REST APIs, and direct database connectors. Data schema mapping and integration validation are completed during the Week 1–2 data audit phase.
How does iFactory handle assets with limited or irregular failure history in the training data?
For low-failure-frequency assets, iFactory applies transfer learning — pre-training models on analogous asset failure signatures from iFactory's anonymised cross-plant dataset, then fine-tuning on your plant-specific sensor data. This approach achieves 85–91% prediction accuracy on assets with fewer than 3 confirmed failure events in the training window. Accuracy improves as your plant accumulates more failure-confirmation data over time.
Can iFactory models account for seasonal load variations and fuel-switching that affect degradation rates?
Yes. iFactory's ML architecture includes operational regime classifiers that segment training data by load profile, ambient conditions, fuel type, and seasonal pattern — allowing degradation rate models to adjust predictions based on current operating regime. Plants operating in peaking or cycling modes see higher prediction accuracy than static threshold systems precisely because the models understand regime-dependent degradation physics.
How long does training take for reliability engineers and maintenance planners?
Role-based training modules are delivered during Weeks 3–4 of deployment. Reliability engineers and maintenance planners achieve platform proficiency in under 90 minutes. Plant managers receive additional training on ROI tracking, model performance dashboards, and maintenance budget optimisation workflows. Ongoing technical support and model performance reviews are included in the deployment package.
What happens to model accuracy if we add new assets or modify existing equipment?
New assets enter a 60–90 day supervised learning period during which iFactory's models build baseline operational envelopes from live sensor data before generating failure predictions. Modified assets trigger automatic baseline recalibration. The continuous retraining pipeline ensures models reflect your current asset configuration — not a snapshot from initial deployment.
Turn Years of Idle Plant Data Into a 24/7 Failure Prediction Engine. Deploy in 5 Weeks. ROI in Week 3.
iFactory gives power plant reliability teams ML models trained on their own historical data, automated CMMS work order generation, real-time failure probability dashboards, and 1–6 week predictive lead times — fully deployed in 5 weeks, with ROI evidence starting in week 3.
94% Prediction Accuracy
CMMS & ERP in 7 Days
PI Historian & OPC-UA Native
Continuous ML Retraining
$480K Avg. Annual Savings