Steam condenser performance is one of the highest-leverage variables in thermal power plant heat rate and output capacity — and it is also one of the most systematically undermonitored. A condenser operating at degraded vacuum due to tube fouling, air in-leakage, or hotwell chemistry drift can cost a 500 MW plant 8–15 MW of lost output continuously, increase heat rate by 2–5%, and accelerate turbine last-stage blade erosion without triggering a single conventional alarm. The data required to detect these losses exists in every instrumented plant: condenser backpressure, cooling water inlet and outlet temperatures, hotwell dissolved oxygen and conductivity, air removal system performance. The problem is that these parameters are typically monitored in isolation — each reviewed by a different specialist against a standalone alarm threshold, with no integrated analytics layer connecting the cross-parameter patterns that characterize a condenser moving from normal operation toward performance-limiting degradation. iFactory's AI-driven analytics platform delivers that integration: a steam condenser analytics module that tracks tube fouling progression, air in-leakage signatures, hotwell chemistry trends, and vacuum system performance in a single asset record — connecting cross-parameter condition patterns to structured maintenance recommendations before any individual threshold is reached. For information on how condenser analytics can be configured for your plant's existing instrumentation,
AI-driven · Steam Condenser · Power Plant Analytics
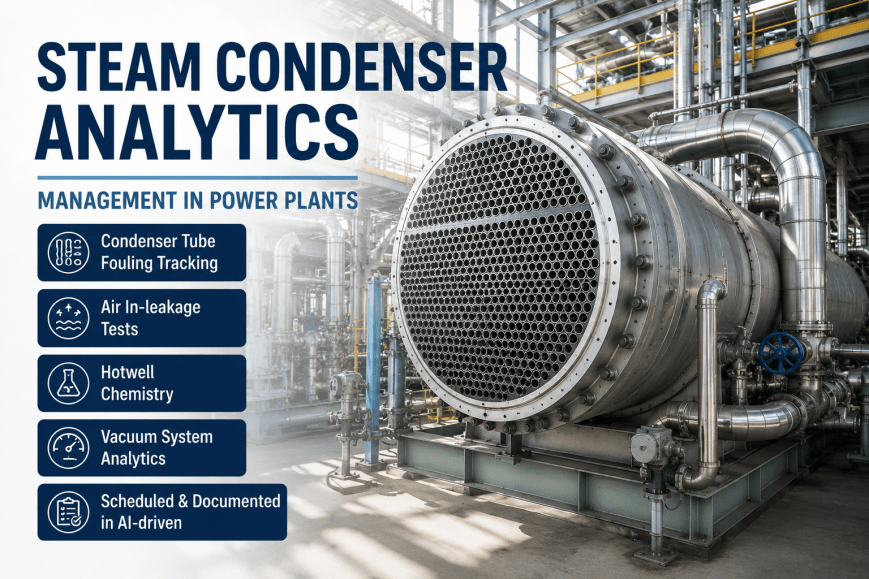
Steam Condenser Analytics: Track Tube Fouling, Air In-Leakage, Hotwell Chemistry, and Vacuum System Performance in iFactory AI-driven
iFactory's condenser analytics module connects backpressure trending, tube fouling indices, air removal performance, and hotwell chemistry into a single AI-driven asset record — protecting turbine efficiency and output from the gradual condenser degradation that standalone monitoring cannot detect until it has already cost megawatts.
8–15 MW
Output lost from degraded condenser vacuum in a 500 MW plant — often invisible without integrated analytics
2–5%
Heat rate penalty from tube fouling and air in-leakage — translating directly to fuel cost increase per MWh
$1–4M
Annual cost of undetected condenser performance degradation in a mid-size thermal plant
30–60%
Earlier detection of tube fouling progression with AI trending vs. standalone backpressure alarms
The Condenser Analytics Gap
Why Condenser Degradation Keeps Costing Power Plants Revenue They Cannot See
Most instrumented thermal plants have the sensors required to detect condenser degradation early. The problem is not data availability — it is the absence of an integrated analytics layer that connects the four condition parameters that degrade together before any individual parameter alarms standalone.
Siloed
Four Disconnected Monitoring Points
Backpressure, cooling water differential, air removal performance, and hotwell chemistry each reviewed independently — no system connecting the cross-parameter patterns that characterize early degradation.
Lagging
Threshold-Based Detection Only
Standalone alarms fire only after significant performance loss has already occurred. By the time backpressure alarms, the heat rate penalty has been accumulating for weeks and tube fouling may require an outage to correct.
$1–4M
Annual Revenue Cost of Late Detection
Fuel cost increase from heat rate degradation, lost generation capacity, and emergency cleaning outages — all preventable with integrated condition trending that detects degradation during the symptom phase rather than the failure phase.
60%
Of Condenser Issues Show Cross-Parameter Signatures
Most condenser degradation mechanisms — fouling, air in-leakage, cooling water chemistry — produce correlated changes across multiple parameters simultaneously before any single parameter reaches its alarm threshold.
Four Core Analytics Capabilities
What iFactory Tracks Across Your Steam Condenser — and What Each Capability Protects Against
Each analytics capability addresses a specific condenser degradation mechanism. Together they provide the cross-system coverage that closes the gap between standalone threshold monitoring and true predictive condenser management. Book a Demo to see how these apply to your condenser design and instrumentation.
01
Tube Fouling Index Tracking and Cleanliness Factor Trending
Condenser tube fouling is calculated continuously from cooling water inlet temperature, outlet temperature differential, circulating water flow rate, and backpressure — generating a real-time cleanliness factor and fouling resistance index for each condenser pass. AI trending detects fouling rate acceleration before the cleanliness factor drops below the threshold that triggers tube cleaning — enabling scheduled hydroblast cleaning at the optimal maintenance window rather than emergency cleaning during an availability event. Cross-correlation with cooling water source temperature identifies seasonal fouling rate changes that affect cleaning frequency planning.
Earlier fouling detection vs. backpressure alarm
30–60% earlier
02
Air In-Leakage Detection and Vacuum System Analytics
Air in-leakage is the most difficult condenser degradation mechanism to detect without dedicated analytics — because it manifests as gradual vacuum deterioration that mimics fouling-related backpressure increase until the air removal system becomes overloaded. iFactory's vacuum analytics tracks air ejector or vacuum pump performance (suction pressure, discharge pressure, steam consumption or motor load) simultaneously with condenser backpressure and corrects for cooling water temperature to isolate air in-leakage contributions to backpressure from thermal contributions. Air in-leakage rate is calculated continuously — alerting maintenance teams to leakage developing at rates well below what would be detectable from backpressure alone.
Earlier air in-leakage detection vs. vacuum alarm
4–8 weeks earlier
03
Hotwell Chemistry Tracking and Condensate Quality Monitoring
Hotwell dissolved oxygen, conductivity, pH, and sodium concentration tracked continuously from online analyzers or imported from laboratory samples. Chemistry excursions — conductivity increase indicating condenser tube leak ingress, dissolved oxygen increase indicating air in-leakage contribution to condensate contamination, sodium increase from cooling water ingress — all tracked against unit-specific baselines established during normal operation. Cross-parameter correlation between hotwell chemistry and air removal system performance identifies the mechanism driving chemistry degradation — distinguishing tube leaks from air in-leakage from deaeration system performance degradation, each of which requires a different maintenance response.
Earlier tube leak detection vs. conductivity alarm
2–4 weeks earlier
04
Cross-Parameter Condenser Performance Scoring and Work Order Generation
When two or more condenser condition parameters trend concurrently in a pattern associated with a specific degradation mechanism, iFactory generates a cross-parameter performance alert and creates a CMMS work order — populated with the degradation mechanism indicated, the specific parameters driving the alert, their trend data, the recommended inspection or maintenance scope (tube bundle inspection, vacuum leak check, hotwell chemistry flush, or air ejector service), and the estimated heat rate recovery from the recommended intervention. The maintenance planner receives an actionable work order with economic justification rather than a raw alarm requiring engineering interpretation before planning can begin.
Reduction in time from detection to planned work order
72% faster
05
Heat Rate Impact Quantification and Economic Justification
Every condenser performance alert includes a calculated heat rate impact — translating the detected vacuum degradation, fouling index change, or chemistry excursion into fuel cost per hour, lost generation capacity, and projected cost of intervention delay. This economic layer converts a technical maintenance recommendation into a business decision: the maintenance planner and plant manager can see the cost of acting now versus deferring, making prioritization against competing maintenance demands data-driven rather than experience-dependent.
Heat rate recovery from timely condenser intervention
Full recovery possible
See iFactory's Condenser Analytics Applied to Your Plant's Instrumentation in a Live Demo
We configure the demo to your condenser design, cooling water system, and existing SCADA data — showing exactly how tube fouling, air in-leakage, and hotwell chemistry are tracked in a single integrated asset record.
Conventional vs. AI-Driven
Steam Condenser Monitoring: Standalone Alarms vs. iFactory Integrated Analytics
Condition Parameter
Conventional Monitoring
iFactory AI-Driven Analytics
Tube Fouling
Backpressure alarm at fixed threshold — fouling has already caused significant heat rate penalty before alarm fires
Cleanliness factor trending from CW differential — fouling rate acceleration detected 30–60% before any backpressure alarm
Air In-Leakage
Vacuum alarm only — air in-leakage indistinguishable from fouling-related backpressure increase without dedicated analytics
Vacuum pump/ejector performance cross-correlated with temperature-corrected backpressure — leakage rate calculated continuously
Hotwell Chemistry
Conductivity alarm at fixed µS/cm — chemistry already significantly degraded, contamination mechanism unknown
Conductivity, DO, pH, and sodium trended against unit baseline — mechanism identified (tube leak vs. air vs. deaeration) before alarm
Cross-Parameter Patterns
No detection — each parameter reviewed independently, combined degradation pattern invisible until multiple alarms fire simultaneously
Concurrent trend alert when multiple parameters drift together — mechanism identified and work order generated weeks earlier
Heat Rate Impact
Heat rate loss visible only in monthly performance reports — economic impact of condenser degradation never quantified in real time
Real-time heat rate impact calculation on every alert — fuel cost per hour and intervention ROI visible to maintenance and management
Maintenance Planning
Emergency cleaning outages — unplanned availability loss, no advance scope definition, no parts or contractor pre-staging
Planned cleaning window with defined scope, economic justification, and 4–8 week scheduling advance — zero emergency cleaning events
Expert Perspective
What Power Plant Engineers Say About Integrated Condenser Analytics
In 22 years of power plant performance engineering, the condenser has consistently been the most under-optimized major component in thermal plant operations. Not because operators don't care about backpressure — they do, every shift. But because the way condenser monitoring is structured, you are almost always watching the outcome rather than the cause. By the time backpressure climbs enough to alarm, you have been losing heat rate for three to six weeks from a combination of fouling and air leakage that the individual monitoring systems could not separate. I have seen plants spending $400,000 on an emergency cleaning outage that a $20,000 routine cleaning six weeks earlier would have prevented — because nothing in their monitoring told them the fouling rate had doubled and the vacuum pump was working harder than normal at the same time. The two signals together are almost always significant. The two signals in isolation are almost never above the alarm threshold. Integrated analytics that cross-correlates all four condenser condition indicators against load-corrected baselines — and calculates the heat rate penalty in real time — changes this from a reactive problem into a managed asset. Every large thermal plant I have worked with has the data. They are just not looking at all of it at the same time.
Senior Thermal Performance Engineer and Plant Optimization Consultant
22 Years Power Plant Performance · Former Plant Performance Manager, 800 MW Combined Cycle Facility · ASME PTC 12.2 (Steam Surface Condensers) Working Group · EPRI Heat Rate Optimization Advisory Board Member
8–15 MW
Output Recovered
Typical capacity recovery from integrated condenser analytics program vs. standalone threshold monitoring.
30–60%
Earlier Fouling Detection
Cleanliness factor trending detects fouling rate acceleration weeks before backpressure alarm threshold is reached.
4–8 wk
Air In-Leakage Lead Time
Vacuum system cross-analytics detects air leakage developing 4–8 weeks before vacuum alarm — time to plan and execute a leak check.
Zero
Emergency Cleaning Events
Plants with iFactory condenser analytics eliminate emergency cleaning outages — every tube cleaning scheduled, scoped, and planned.
Conclusion
The Condenser Is Your Plant's Most Measurable Performance Lever. iFactory Makes It Visible.
Every megawatt-hour generated by a thermal plant passes through the steam condenser. Every degree of backpressure above design costs heat rate. Every unit of air in-leakage costs vacuum. Every hotwell chemistry excursion risks turbine contamination. And every one of these degradation mechanisms produces detectable signals in the plant's existing instrumentation — weeks before any conventional alarm threshold is reached — if those signals are being analyzed together rather than independently. iFactory's AI-driven condenser analytics module delivers that integrated view: tube fouling progression tracked as a cleanliness factor trend, air in-leakage quantified from vacuum system cross-analytics, hotwell chemistry excursions identified by mechanism rather than just magnitude, and every detected degradation event converted into a work order with economic justification. The result is a condenser management program that eliminates emergency cleaning outages, recovers 8–15 MW of lost output, and returns 2–5% heat rate to design — all from the instrumentation that is already installed. Book a Demo to see iFactory's condenser analytics configured for your plant's specific condenser design and cooling water system.
Your Condenser Data Is Already Telling You What Is Wrong. iFactory Connects It Into One Clear Picture.
Tube fouling index tracking. Air in-leakage detection. Hotwell chemistry trending. Heat rate impact quantification. All in one AI-driven asset record — protecting turbine efficiency and output from the gradual condenser degradation that standalone monitoring cannot see until it has already cost megawatts.
Frequently Asked Questions
Steam Condenser Analytics — Questions from Power Plant Engineers
What instrumentation does iFactory require to calculate the condenser tube fouling index and cleanliness factor?
The minimum instrumentation required for fouling index calculation is: cooling water inlet temperature (CW in), cooling water outlet temperature (CW out), steam turbine exhaust pressure (condenser backpressure), and turbine exhaust flow or load signal. With these four inputs, iFactory calculates the log mean temperature difference (LMTD) for the condenser and derives the heat transfer coefficient and cleanliness factor using the HEI or TEMA design standard appropriate for your condenser. For plants with circulating water flow measurement, the calculation is more precise. For plants with multiple condenser passes or divided waterboxes, pass-level fouling analysis is available with appropriate temperature measurement at each pass. Most instrumented thermal plants already have all required measurements in their SCADA historian — iFactory connects to the historian via standard protocols, no new instrumentation required in the majority of cases.
Book a Demo to verify the integration path for your plant's specific SCADA and historian configuration.
How does iFactory distinguish air in-leakage from tube fouling as the cause of rising condenser backpressure?
The distinction between air in-leakage and tube fouling as drivers of backpressure increase is one of the most practically important separations that condenser analytics enables — and it requires simultaneously analyzing parameters that conventional monitoring reviews in isolation. Tube fouling degrades the condenser's heat transfer coefficient — visible as a declining cleanliness factor with normal air removal system performance. Air in-leakage increases the non-condensable gas partial pressure in the condenser — visible as elevated air ejector or vacuum pump load (higher steam consumption or motor current) with normal or improving cooling water differential temperature. When both mechanisms are present simultaneously — a common scenario — the combined backpressure impact is greater than either alone, but the maintenance response is different: tube fouling requires hydroblast cleaning, air in-leakage requires a vacuum leak check and seal repair. iFactory's cross-parameter analytics calculates both the fouling resistance index and the non-condensable load index simultaneously, identifying the dominant mechanism and the appropriate maintenance scope from the outset rather than requiring trial-and-error interventions.
How does iFactory handle condenser backpressure correction for varying cooling water inlet temperature?
Cooling water inlet temperature variation is the primary confounding factor in condenser backpressure trending — seasonal temperature changes of 10–20°F produce backpressure changes that dwarf early fouling or air in-leakage signals if the backpressure is evaluated against a fixed threshold rather than a temperature-corrected baseline. iFactory's condenser analytics applies continuous load and temperature correction to all condenser performance parameters using the plant's actual turbine heat acceptance curves and condenser design data. The corrected performance metrics — corrected backpressure, corrected cleanliness factor, corrected heat transfer coefficient — represent how the condenser is performing relative to its capability at the current operating conditions, not relative to a fixed historical value that was established at different ambient conditions. This temperature correction is what enables meaningful fouling detection during summer months when raw backpressure is already elevated from cooling water temperature — the corrected cleanliness factor still shows fouling degradation clearly against the temperature-adjusted baseline.
What hotwell chemistry parameters does iFactory track, and how are contamination sources identified?
iFactory tracks the primary hotwell chemistry parameters: specific conductivity (µS/cm), cation conductivity (for dissolved CO2 and anion contamination), dissolved oxygen (ppb), pH, and sodium (ppb where sodium analyzers are installed). The platform accepts both continuous online analyzer data via SCADA integration and periodic laboratory sample results entered manually or imported from laboratory information management systems. Source identification uses the characteristic multi-parameter signature of each contamination mechanism: condenser tube leak produces conductivity increase with sodium increase proportional to cooling water chemistry; air in-leakage produces dissolved oxygen increase disproportionate to conductivity change; deaeration system degradation produces dissolved oxygen increase without conductivity or sodium change; CO2 ingress produces cation conductivity increase with pH decrease. The combination of which parameters change and the rate at which they change together identifies the source mechanism — enabling the maintenance team to dispatch the right intervention (tube plugging, vacuum leak repair, or deaeration system service) without sequential diagnostic attempts.
Book a Demo to see hotwell chemistry source identification demonstrated with real plant data.
Can iFactory's condenser analytics integrate with our existing CMMS to generate maintenance work orders automatically?
Yes — automated CMMS work order generation from condenser performance alerts is a core capability of iFactory's platform. When the condenser analytics module detects a cross-parameter degradation pattern that meets the configured alert threshold, it generates a CMMS work order populated with: the specific parameters triggering the alert and their trend data, the degradation mechanism indicated (fouling, air in-leakage, tube leak, or deaeration), the recommended maintenance scope, the estimated heat rate recovery from the intervention, and the calculated cost per hour of delay. iFactory integrates with all major CMMS platforms including IBM Maximo, SAP PM, Infor EAM, Oracle EAM, and others through standard API connections. Work orders can be generated automatically or routed through a maintenance planner review step — the approval workflow is configurable. The integrated economic justification included in each work order — showing fuel cost per hour of continued degradation — is consistently cited by plant managers as the capability that most improves maintenance prioritization decision quality across competing work demands.
.png)