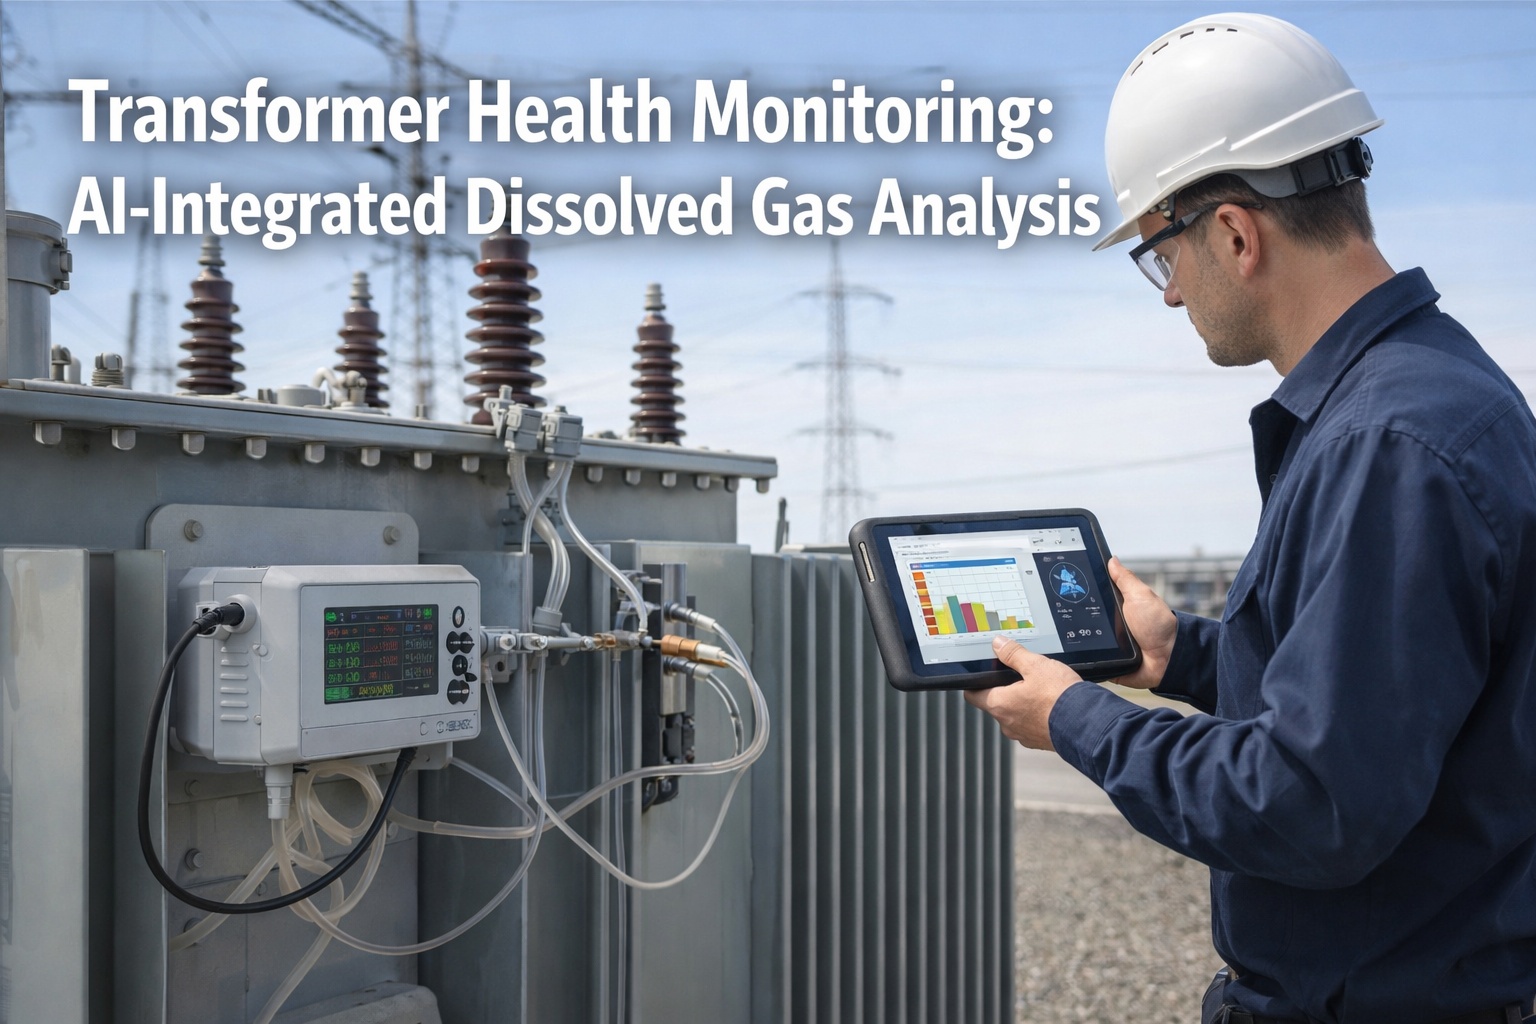
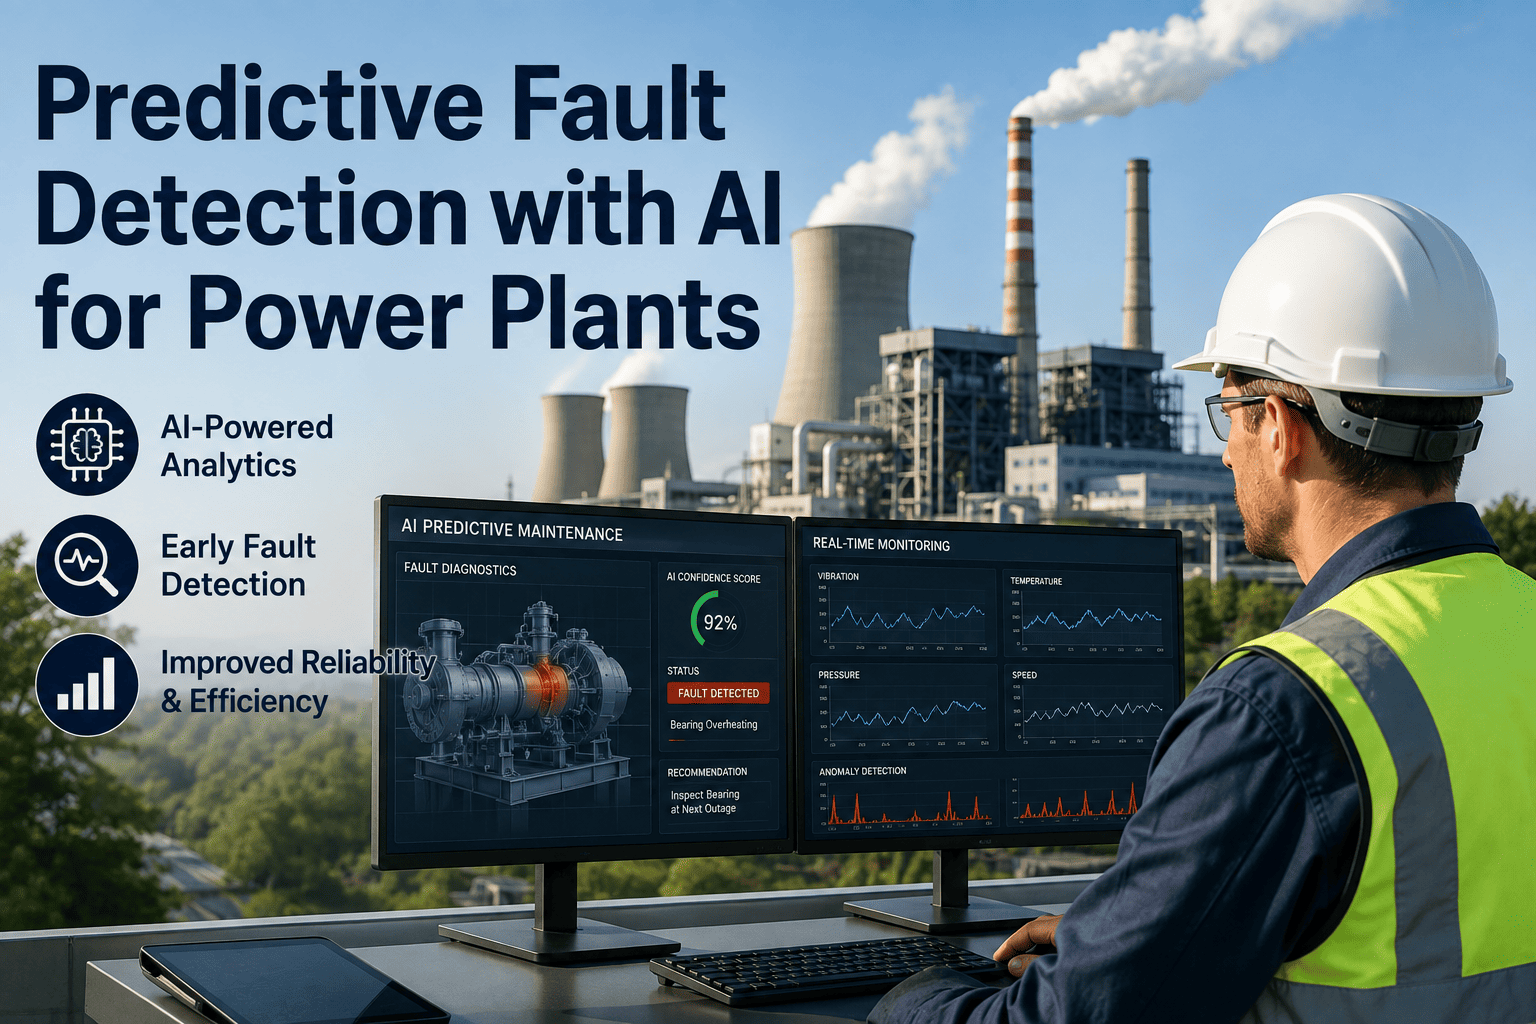
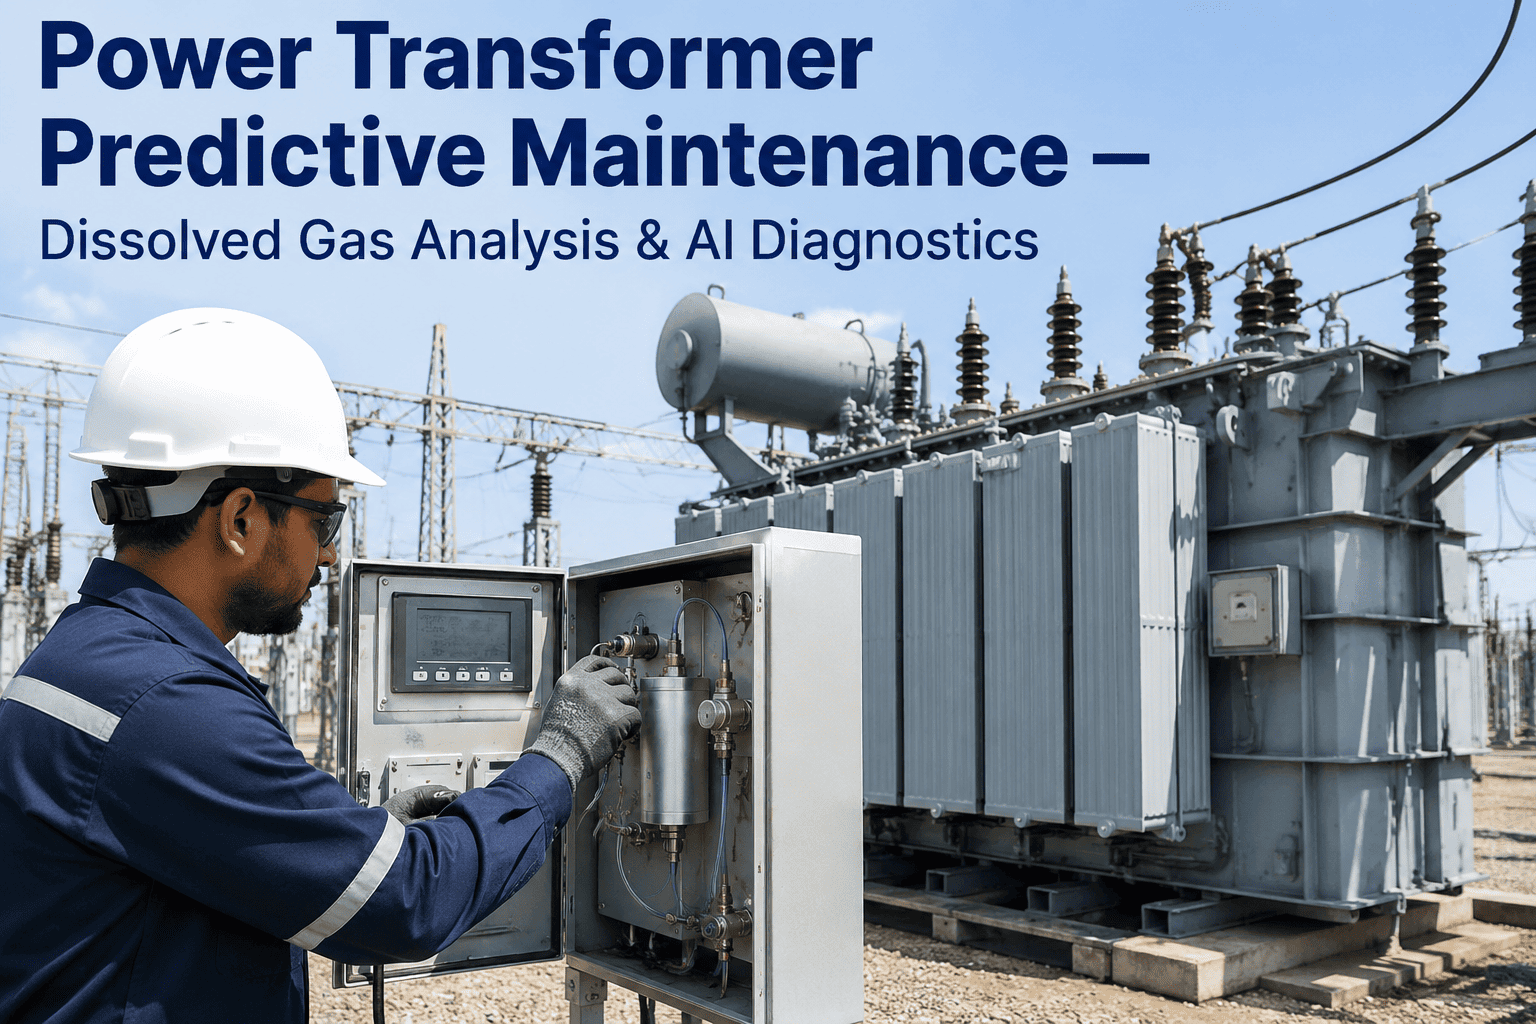
Transformer Health Monitoring: AI-Integrated Dissolved Gas Analysis
By shreen on March 10, 2026
Transformer failures account for over 30% of all power grid outages and a single catastrophic failure can cost utilities $3–10 million in replacement, environmental cleanup, and lost revenue. Dissolved Gas Analysis has been the gold standard for detecting internal transformer faults for decades — but traditional DGA still depends on manual oil sampling, lab turnaround times of 5–14 days, and human interpretation of complex gas ratios. AI-integrated DGA changes this completely: continuous online monitoring paired with machine learning delivers fault detection accuracy above 95% and provides actionable alerts weeks before failure. If your transformers are still on annual oil sampling schedules, the gap between what you know and what is actually happening inside your fleet is measured in millions of dollars. Book a free assessment to see how AI-powered DGA monitoring connects to your maintenance workflows today.
Transformer Asset Intelligence
AI-Integrated Dissolved Gas Analysis for Power Transformers
From Periodic Sampling to Continuous Fault Prediction — The Complete Guide for Utility Asset Managers in 2026
Why Traditional DGA Leaves Transformers Vulnerable
Power transformers are the most expensive and least replaceable assets on any electrical grid. A large power transformer takes 12–18 months to manufacture and deliver. Yet the dominant monitoring approach — periodic manual oil sampling — creates dangerous blind spots between tests. Faults that develop in the weeks or months between samples go undetected until they escalate into catastrophic failures, tank ruptures, or fires.
Traditional DGA Sampling
What You Miss Between Oil Tests
Annual or quarterly oil sampling creates a monitoring gap measured in months. During that gap, thermal faults, partial discharge events, arcing, and oil degradation can progress through multiple severity stages undetected. By the time the next sample reveals elevated gas levels, the damage trajectory may already require a forced outage.
5–14 day lab turnaroundMonths between samplesManual interpretation errorsNo trend analysis possible
AI-Integrated Online DGA
Continuous Monitoring, Instant Intelligence
Online DGA monitors sample dissolved gases continuously — every few minutes to every few hours — and feed results directly to AI models trained on millions of transformer fault signatures. The system detects fault onset at the earliest stage, classifies the fault type automatically, and predicts time-to-failure with enough lead time for planned intervention.
Real-time gas trendingAutomated fault classificationPredictive failure timelineCMMS work order integration
Critical Insight
IEEE and IEC studies confirm that Dissolved Gas Analysis can detect over 70% of all incipient transformer faults before they progress to failure — but only when monitoring is continuous and interpretation is automated. Manual sampling at annual intervals catches less than 30% of developing faults in time for planned repair. The difference between these two numbers represents millions of dollars in avoided emergency replacements, environmental incidents, and grid reliability penalties for every utility fleet.
Every type of internal transformer fault produces a characteristic gas signature. AI models analyze the ratios and generation rates of these gases simultaneously — something no manual Duval Triangle or Rogers Ratio calculation can match at speed or scale.
Hydrogen (H₂)
Normal: <100 ppm
The most sensitive indicator of low-energy electrical faults. Elevated hydrogen is often the first sign of partial discharge activity in insulation systems — detectable by AI weeks before other gas concentrations rise.
Indicates: Partial discharge, corona
Acetylene (C₂H₂)
Normal: <2 ppm
The most critical gas in DGA interpretation. Even small amounts indicate high-energy arcing — the most destructive fault type. Any detectable acetylene generation trend requires immediate investigation and is treated as a priority alert by AI systems.
Indicates: High-energy arcing
Ethylene (C₂H₄)
Normal: <75 ppm
Produced by severe overheating of oil above 700°C. High ethylene levels point to hot metal surfaces — often caused by circulating currents, bad contacts, or overloaded windings. AI trending of ethylene generation rate reveals whether the thermal event is stable or accelerating.
Indicates: Severe thermal faults
Methane (CH₄)
Normal: <120 ppm
Associated with low-temperature thermal degradation of oil (150–300°C). Elevated methane often signals overheating in oil ducts, core hot spots, or stray flux heating. Combined with ethane ratios, AI pinpoints the temperature range of the thermal event.
Indicates: Low-temperature thermal faults
CO / CO₂ Ratio
CO₂/CO: Typically 3–11
Carbon oxide gases reveal cellulose insulation degradation — the irreversible aging process that determines remaining transformer life. A declining CO₂/CO ratio signals accelerated paper aging, which AI models correlate with load history and temperature data to estimate remaining insulation life.
Indicates: Cellulose insulation aging
Total Dissolved Combustible Gas
TDCG threshold: 720 ppm (IEEE C57.104)
TDCG is the aggregate measure used for initial screening. AI platforms go far beyond TDCG thresholds by analyzing individual gas ratios, generation rates, and cross-correlating with load, ambient temperature, and historical fleet data to eliminate false alarms and prioritize genuine threats.
Indicates: Overall fault screening
AI Advantage
How AI Transforms DGA from Diagnostic to Predictive
Traditional DGA interpretation relies on static ratio methods — Duval Triangle, Rogers Ratio, Key Gas Method — each with documented blind spots and conflicting conclusions for the same data set. AI eliminates these limitations by learning from millions of real-world transformer fault records and continuously refining its models.
01
Continuous Gas Data Ingestion
Online DGA monitors installed on transformers stream dissolved gas concentrations to the AI platform at intervals from 15 minutes to 4 hours. Unlike lab samples, this creates an unbroken timeline of gas evolution — the foundation for trend-based fault detection.
02
Multi-Variable Pattern Recognition
Machine learning models analyze all gas ratios simultaneously — not just the 2–3 ratios used in manual methods. The AI cross-references gas trends with load profile, ambient temperature, tap changer position, and oil quality parameters to separate genuine fault signals from normal operational variations.
03
Fault Classification and Severity Scoring
When the AI detects an anomaly, it classifies the fault type — partial discharge, low-energy discharge, arcing, thermal fault in oil, thermal fault in cellulose — with a confidence score and severity rating. This eliminates the ambiguity of traditional ratio methods that often produce conflicting diagnoses for the same gas profile.
04
Remaining Life Estimation
By combining DGA trends with furfural analysis, degree of polymerization estimates, and thermal modeling, AI calculates the remaining useful life of both the oil and the cellulose insulation system. This transforms maintenance from condition-based to lifecycle-optimized — ensuring every transformer runs safely to its full economic potential.
05
Automated CMMS Work Orders
Critical alerts automatically generate work orders in iFactory's CMMS — pre-populated with fault diagnosis, recommended actions, required materials, and assigned to the right maintenance team. No more alerts that sit in email inboxes while fault conditions worsen. The system closes the loop between detection and action automatically.
See It Working
Watch iFactory Detect a Developing Winding Hot Spot 52 Days Before Forced Outage
In our 30-minute demo, we walk through a real transformer DGA case — from the first anomalous hydrogen spike through AI fault classification, severity escalation, and automated work order generation. You will see the dashboard, the alert logic, and the cost avoidance calculation.
This comparison reflects documented performance differences between utilities using periodic lab-based DGA and those operating AI-integrated online monitoring across their critical transformer fleet.
Measured Results from iFactory-Connected Transformer Fleets
These outcomes represent verified performance data from utilities and industrial operators running iFactory's AI-integrated DGA monitoring for 12 months or more across critical transformer assets.
60%
Reduction in Unplanned Transformer Outages
45%
Lower Transformer Maintenance Spend (Year One)
80%
Fewer False Alarms vs. Static Threshold Systems
35%
Extension in Average Transformer Service Life
Sign up free and connect your first transformer monitors. Most utilities detect their first actionable anomaly within the first 60 days of continuous monitoring.
What iFactory's AI DGA Platform Delivers
Every feature is designed to close the gap between gas data collection and maintenance action — so no fault signal is ever lost between a sensor reading and a work order.
Unified Fleet Dashboard
See the health status of every transformer in your fleet from a single interface — color-coded by condition, sortable by criticality, and filterable by location, voltage class, or age. No more spreadsheet aggregation from multiple monitoring systems.
Fleet-Wide Visibility
Gas Trend Analytics
Interactive time-series charts for every monitored gas with configurable baselines, rate-of-change alerts, and overlay capability for load, temperature, and tap changer data. Trend deviations are flagged automatically before they cross alarm thresholds.
Predictive Trending
Multi-Model Fault Diagnosis
The platform runs Duval Triangle, Rogers Ratio, Key Gas, IEC 60599, and proprietary ML models simultaneously — then delivers a consensus diagnosis. Where traditional methods produce conflicting results, iFactory resolves the ambiguity with contextual AI.
95%+ Accuracy
Automated Work Order Dispatch
When a fault crosses the action threshold, the CMMS generates a prioritized work order — assigned to the right engineer, pre-loaded with the diagnosis, recommended intervention, and required materials. No manual alert triage. No action delays.
Zero-Delay Response
Remaining Life Calculation
Integrated cellulose aging models combine DGA data, furan analysis, degree of polymerization, and thermal history to estimate remaining insulation life. This enables confident capital planning — replace transformers when they need replacing, not on arbitrary schedules.
Lifecycle Optimization
Regulatory Compliance Records
Every DGA reading, alert, diagnosis, and maintenance action is timestamped and stored in an auditable record. IEEE C57.104, IEC 60599, and utility-specific reporting requirements are satisfied automatically — eliminating the administrative burden that consumes engineering time.
Audit-Ready Documentation
We had 14 power transformers on annual DGA sampling when we connected iFactory's online monitoring. Within 90 days, the AI flagged a developing thermal fault in a 230kV unit that our last lab sample — taken just four months earlier — showed as completely normal. The fault was traced to a loose connection on a bushing terminal. Repair cost: $12,000. Replacement cost if it had progressed to failure: over $4.5 million. The platform justified five years of monitoring investment on that single catch. We have since expanded to 47 units across three substations.
iFactory AI DGA Monitoring — Continuous Intelligence for Every Critical Transformer
iFactory connects to your existing online DGA monitors, applies AI-powered fault classification and remaining life estimation, automates work order generation through CMMS integration, and delivers the compliance documentation your regulators require. No rip-and-replace. No lengthy implementation. Connect your first transformers and start generating actionable intelligence within days.
AI fault classification across all monitored gases
Automated work order generation and technician dispatch
Remaining insulation life estimation with thermal modeling
IEEE C57.104 and IEC 60599 compliance documentation
What types of transformers benefit most from AI-integrated DGA monitoring?
The highest ROI comes from critical power transformers — those where an unplanned outage would result in significant financial loss, safety risk, or regulatory penalty. Transmission-class units (69kV and above), generator step-up transformers, and substation transformers feeding essential loads are the primary candidates. However, even distribution transformers with high replacement costs or long lead times benefit from continuous monitoring. Book a demo to see how iFactory prioritizes your fleet by risk level.
How accurate is AI fault classification compared to traditional DGA interpretation?
AI-powered DGA classification achieves above 95% accuracy in fault type identification — compared to 60–75% for individual ratio methods (Duval Triangle, Rogers Ratio). The improvement comes from analyzing all gases simultaneously, incorporating rate-of-change data unavailable to static methods, and cross-referencing with operational parameters. Critically, AI reduces false alarms by 80% compared to fixed-threshold alarm systems.
Does AI monitoring replace the need for periodic lab oil sampling?
Not entirely — lab analysis still provides valuable data that online monitors do not capture, including dissolved metals content, interfacial tension, power factor, and moisture equilibrium measurements. However, AI monitoring dramatically reduces the frequency of lab samples needed (from quarterly to annual or biannual) and ensures that no fault develops undetected between samples. The two approaches are complementary, not competitive.
What online DGA monitors does iFactory integrate with?
iFactory integrates with all major online DGA monitor manufacturers through standard communication protocols (Modbus, DNP3, IEC 61850, and API connections). Supported monitors include systems from Vaisala, GE Kelman, Qualitrol, Dynamic Ratings, MTE, and others. If your monitor can output gas concentration data, iFactory can ingest and analyze it. Book a demo to verify compatibility with your existing monitoring hardware.
How long does it take for AI models to become effective on a new transformer?
AI models begin providing value from day one using industry-wide training data and IEEE/IEC standard thresholds. Within 30–60 days of continuous monitoring, the system builds a unit-specific behavioral baseline that dramatically improves anomaly detection sensitivity and reduces false alarms. After 6–12 months, the model has learned enough operational context to provide remaining life estimates and nuanced fault progression forecasts. Sign up to start building baselines today.
What is the ROI timeline for AI DGA monitoring deployment?
Most utilities achieve positive ROI within the first year — often by preventing a single major transformer failure that would cost $1–10M in replacement and lost revenue. The monitoring system cost is typically less than 2% of the asset value it protects. Beyond failure prevention, ongoing savings come from reduced lab sampling costs, optimized maintenance scheduling, deferred capital replacement through condition-based lifecycle management, and lower insurance premiums through documented monitoring programs.