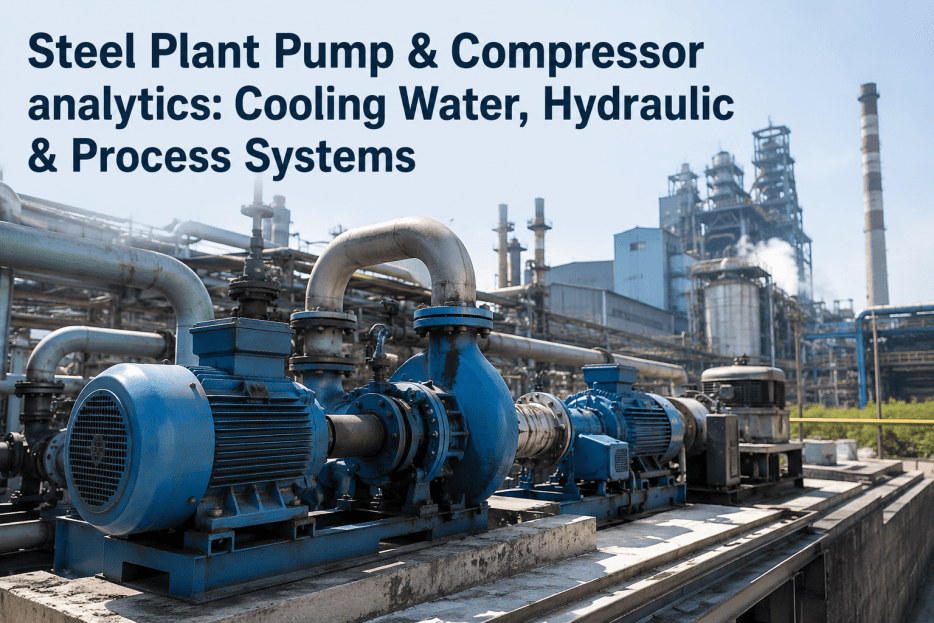
Every hour of unplanned downtime in a steel plant traces back to a rotating asset that failed without warning — a motor bearing that overheated while the vibration alarm was set 40% above normal operating levels, a cooling water pump that cavitated progressively over three weeks while only weekly oil samples were being taken, a combustion air fan whose impeller was fouling asymmetrically while the standard maintenance schedule called for cleaning at the next annual outage. The rotating equipment fleet in a U.S. integrated or EAF steel plant spans hundreds of assets across every production area — from 15,000-hp blast furnace blower motors to 2-hp cooling circuit pumps — and the cost of reactive maintenance across that fleet compounds relentlessly. The industry benchmark for rotating equipment failure cost in U.S. steel operations is $14,000 to $38,000 per unplanned event including production loss, emergency parts procurement, and overtime labor. Across a fleet of 400 to 800 monitored rotating assets, that number appears 60 to 120 times per year in operations without a structured predictive analytics program. iFactory's rotating equipment predictive analytics platform changes the equation by monitoring every motor, pump, fan, and compressor in the fleet simultaneously — applying vibration analysis, thermal imaging integration, and oil condition modeling to detect developing faults months before they reach the failure threshold. Operations that have deployed iFactory's rotating equipment analytics platform report 71% reduction in unplanned rotating equipment failures, 26% reduction in total maintenance labor cost, and average annual savings of $1.6 million per steel plant from avoided emergency repairs and optimized preventive maintenance intervals.
Why Steel Plant Rotating Equipment Fails the Way It Does — and What Analytics Changes
The failure modes that generate the most costly unplanned downtime events in steel plant rotating equipment are not random or sudden. They are progressive mechanical and electrical degradation conditions — bearing fatigue, impeller imbalance from fouling or erosion, shaft misalignment from thermal growth, motor winding insulation degradation, and lubrication breakdown — that develop over days to weeks and generate measurable condition signals throughout their progression. The reason these conditions reach failure rather than being caught and corrected is not sensor absence. It is analytics absence: fixed alarm thresholds that do not distinguish asset-specific normal from abnormal, vibration data that is collected but never analyzed for frequency-specific fault signatures, oil samples that are sent to labs monthly but whose results never connect to a work order decision before the next sample is due.
iFactory's analytics platform addresses the gap not by adding sensors but by applying fault-specific detection models — calibrated to each asset's individual operating baseline — to the condition data already being generated. The transition from reactive to predictive maintenance on a steel plant rotating equipment fleet delivers measurable results within the first operating quarter. Book a Demo to see the detection models applied to your specific asset register.
- Vibration monitored against fixed ISO thresholds — not asset-specific baselines
- Oil samples sent to lab monthly — results arrive 5–10 days after collection
- Work orders generated after equipment failure or operator report of abnormal noise
- Preventive maintenance intervals fixed by calendar regardless of actual asset condition
- Emergency parts procurement at 40–80% premium over planned purchasing price
- Fleet-level condition visibility absent — risk ranking impossible without manual assessment
- Vibration analyzed against asset-specific baseline at bearing defect frequencies — fault-specific detection
- Continuous oil condition trending from in-line sensors or lab result integration — real-time degradation index
- Severity-ranked alerts generated 14–45 days before failure with specific fault classification
- Condition-based maintenance intervals — assets with good condition extended, degrading assets prioritized
- Parts ordered on 14-day standard lead time from advance alert — planned procurement pricing
- Fleet-wide risk ranking updated continuously — maintenance resources directed to highest-risk assets
The Four Detection Technologies: What Each Catches That the Others Miss
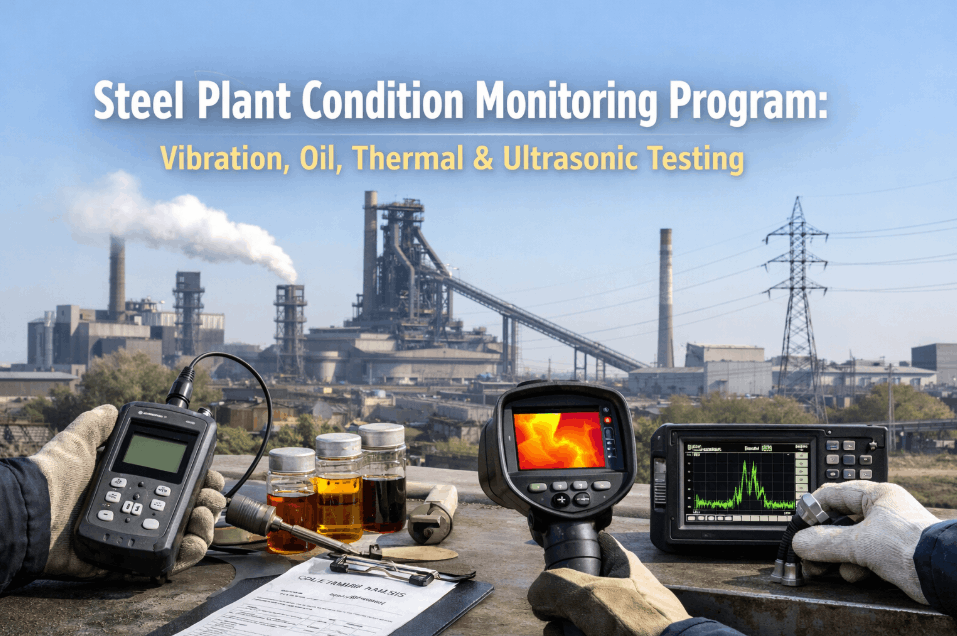
No single condition monitoring technology detects all rotating equipment failure modes with equal reliability. Vibration analysis detects mechanical faults — bearing defects, imbalance, misalignment — with high sensitivity and early detection. Thermal imaging detects electrical and overload conditions — winding hot spots, connection resistance, cooling system degradation — that vibration analysis cannot see. Oil condition monitoring detects lubrication breakdown and contamination — wear particle generation, viscosity degradation, water ingress — that thermal and vibration signals miss entirely. Motor current signature analysis detects rotor bar defects, electrical asymmetry, and mechanical load variation in AC motors without requiring vibration sensors on the motor housing. iFactory integrates all four detection streams into a unified asset health picture that provides both early detection and reliable fault classification across the full failure mode spectrum. Book a Demo to see how these four streams combine on your steel plant asset register.
Steel Plant Rotating Equipment Analytics — Asset Class Reference Matrix
The monitoring parameters, primary failure modes, and detection methods vary significantly across the major rotating equipment classes in a steel plant. The matrix below maps iFactory's analytics coverage across the six principal rotating equipment classes found in U.S. integrated and EAF steel operations — from the highest-consequence assets (process fans and large drive motors) to the highest-frequency failure category (cooling and process pumps).
| Equipment Class | Primary Failure Modes | Primary Detection Method | Secondary Detection | Typical Detection Lead Time | Consequence Per Event |
|---|---|---|---|---|---|
| Large Process Fans (ID, FD, BFG) | Bearing fatigue, impeller erosion/fouling imbalance, shaft fatigue | Vibration — 1× imbalance and bearing defect frequencies | Thermal imaging — bearing housing temp trend | 21–45 days (bearing); 7–14 days (imbalance) | $28K–$85K per event — process interruption |
| Large AC Drive Motors (>500 hp) | Rotor bar crack, winding insulation degradation, bearing wear | MCSA — rotor bar sideband analysis | Thermal imaging — winding hot spot; vibration — bearing | 30–90 days (rotor bar); 14–30 days (bearing) | $45K–$180K per event — motor replacement + downtime |
| Cooling Water and Process Pumps | Cavitation, impeller wear, mechanical seal failure, bearing fatigue | Vibration — sub-synchronous cavitation; MCSA — load signature | Oil condition — seal/bearing lubrication; thermal — seal housing | 3–14 days (cavitation); 14–28 days (bearing) | $8K–$28K per event — highest frequency failure class |
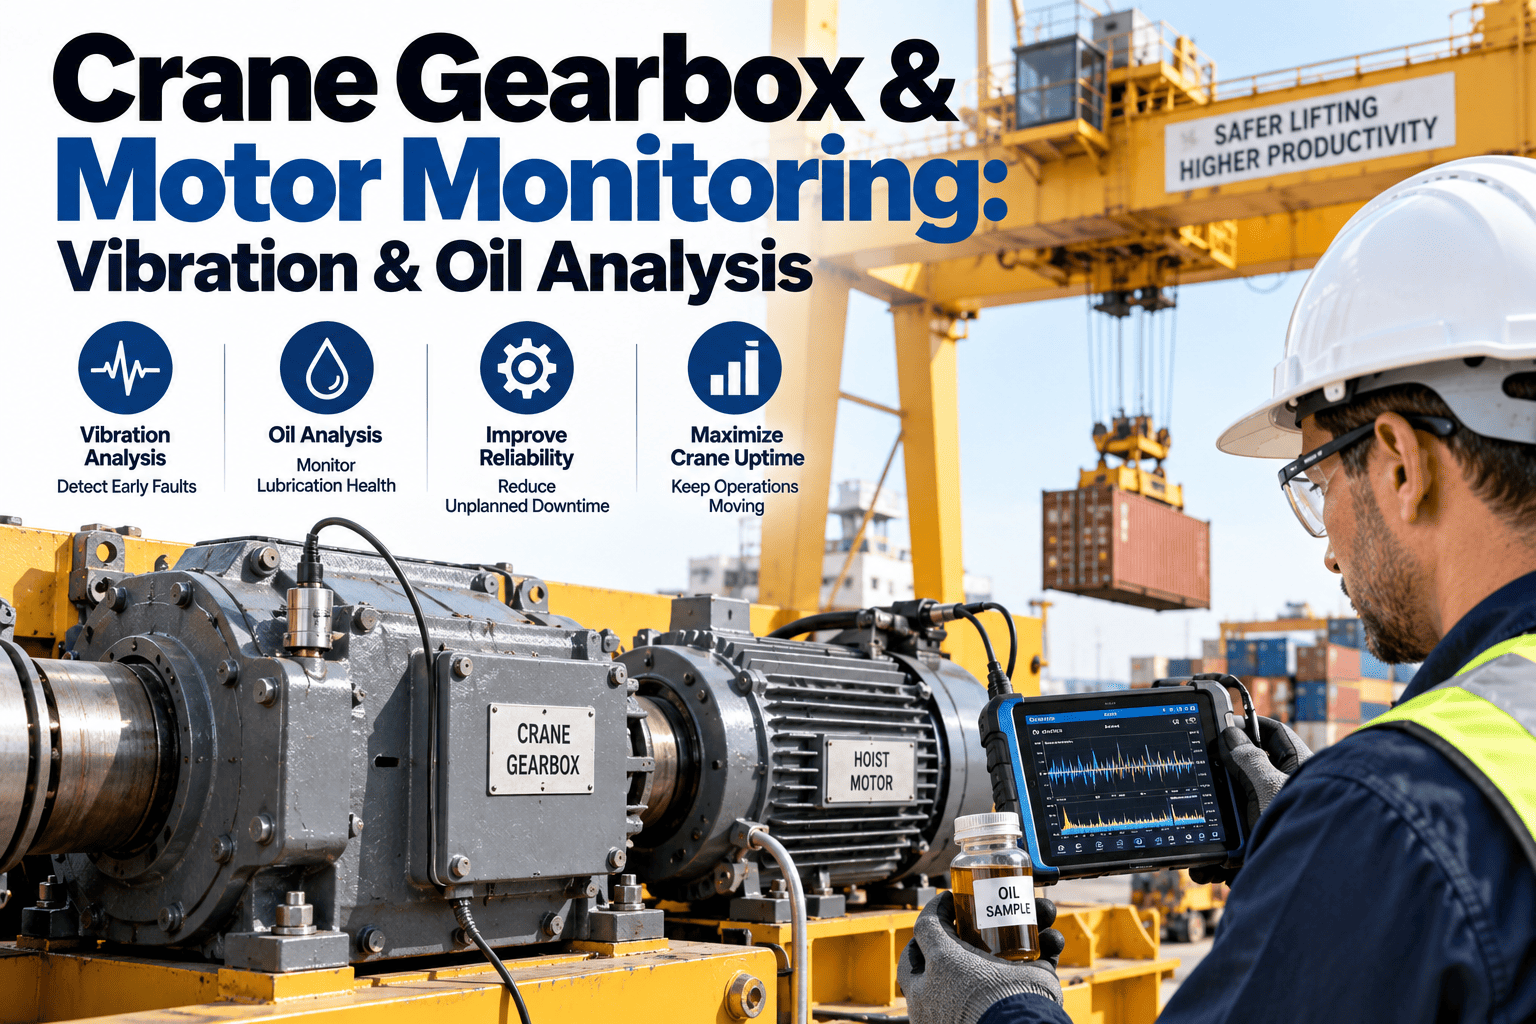
| Gearboxes and Pinion Stands | Gear tooth wear/spalling, bearing degradation, oil contamination | Vibration — gear mesh frequency and sidebands | Oil analysis — wear metal spectrometry, particle count | 14–45 days (gear tooth); 21–60 days (oil-detected) | $38K–$140K per event — rebuild or replacement |
| Compressors (Air, Instrument, Process) | Valve wear, piston ring degradation, bearing wear, intercooler fouling | Vibration — valve impact; pressure ratio efficiency model | Thermal imaging — intercooler fouling; oil analysis — wear metals | 14–30 days (valve); 30–60 days (bearing) | $18K–$65K per event — instrument air or process interruption |
| Rolling Mill Drive Motors and Pinions | Spindle coupling wear, pinion bearing fatigue, gear tooth damage | Vibration — synchronous and gear mesh; MCSA — load variation | Oil analysis — gearbox wear metals; thermal — coupling hot spots | 14–28 days (bearing); 21–45 days (gear tooth) | $85K–$280K per event — production schedule disruption |
Fleet-Level Risk Ranking: How iFactory Prioritizes Maintenance Resources Across Hundreds of Assets
The operational value of a steel plant rotating equipment analytics program is not just in detecting individual faults — it is in providing the fleet-level risk ranking that allows the maintenance team to direct resources to the right assets at the right time. Without fleet-level risk ranking, the maintenance supervisor faces a prioritization problem every shift: which of the 40 assets with open condition alerts is most critical, which can wait until the next planned outage, and which needs intervention today? iFactory solves this by calculating a Composite Risk Score (CRS) for every monitored asset — integrating fault severity, fault progression rate, asset criticality classification, and production consequence into a single number that ranks the full fleet from highest to lowest priority at every update cycle.
Expert Perspective: What Separates Steel Plants That Eliminate Rotating Equipment Failures From Those That Keep Experiencing Them
In twenty-four years of rotating equipment reliability engineering across integrated steel, EAF, and flat-rolled operations, the performance difference between plants that consistently achieve low unplanned failure rates and those that accept 60 to 100 emergency maintenance events per year on rotating equipment comes down to one fundamental distinction: asset-specific baselines versus generic alarm thresholds. Plants that run generic ISO vibration alarms across their fleet are not running predictive maintenance — they are running an earlier reactive maintenance program, because the ISO alarm fires so close to actual failure that you have hours rather than days to respond. The plants I have seen eliminate their rotating equipment emergency rate are the ones that take the time to establish individual baseline vibration signatures for each monitored asset at each operating point, then apply fault-specific frequency analysis against those baselines. That approach consistently identifies bearing defects 3 to 6 weeks before the ISO alarm would fire, which is the difference between planning an intervention at the next outage and scrambling to replace a failed motor on a production-critical pump at 2 AM on a Saturday. The second thing those high-performing plants do is connect their oil analysis data to their vibration data at the asset level. A bearing whose vibration is trending normally but whose oil sample shows a 40% rise in iron particle count is telling you something important — the wear is happening but the mechanical signature hasn't emerged yet. The plants that see both signals simultaneously catch conditions at stage 1 that the plants treating vibration and oil analysis as separate programs miss until stage 3. That combination — asset-specific vibration baselines connected to oil analysis trending — is exactly what iFactory delivers and what the highest-performing rotating equipment programs in U.S. steel are now running."
Conclusion
Predictive analytics for steel plant rotating equipment is not a future-state aspiration — it is a deployed operational capability that eliminates the reactive maintenance cycle that costs U.S. steel operations $14,000 to $38,000 per unplanned event across fleets of 400 to 800 assets. The technology is mature, the detection lead times are documented, and the ROI from avoided emergency repairs and optimized preventive maintenance intervals is measurable within the first operating quarter of deployment. What has historically kept most steel plants from realizing this value is the analytics layer — the step between raw condition data collection and fault-specific, asset-specific, severity-ranked intelligence that maintenance teams can act on. iFactory's rotating equipment analytics platform delivers that layer: four detection technologies integrated into a unified asset health picture, asset-specific baselines calibrated to each machine's individual operating characteristics, a Composite Risk Score that ranks the full fleet continuously, and automated CMMS work orders that deliver complete fault context to the maintenance scheduler before the failure window closes.
The 71% reduction in unplanned rotating equipment failures at comparable steel plant deployments is the documented result of catching fault conditions at 30-day average lead time rather than reacting to emergency conditions with zero lead time. Book a Demo to see how iFactory would perform across your specific rotating equipment fleet and production environment.
Frequently Asked Questions
iFactory is designed to deliver maximum value from existing sensor infrastructure — no minimum sensor count is required to begin deployment, and the platform works with any combination of permanently installed vibration transmitters, route-based data collector uploads, online continuous monitoring system data exports, and wireless sensor network feeds. For steel plants with existing permanently installed vibration transmitters on critical rotating assets connected to a data historian (OSIsoft PI, Aspentech IP21, Wonderware Historian), iFactory connects directly to the historian via API and begins processing the existing data stream without any new hardware. For assets monitored by route-based data collectors, iFactory accepts periodic data uploads in standard formats (Emerson CSI, SKF Microlog, Commtest Ascent, Pruftechnik Vibxpert) and applies the same fault detection models on a time-series basis from route interval data. The most common sensor gap identified in initial steel plant assessments is the absence of axial-direction sensors on assets with thrust bearing configurations — iFactory's assessment identifies these gaps and provides a targeted sensor addition recommendation prioritized by asset criticality and failure mode. Most steel plants begin generating actionable fault detections within the first 30 days of data connection using only existing instrumentation.
Asset-specific baselines are established through an operating state characterization process that clusters each asset's historical condition data by operating point — speed, load, and process conditions — and establishes separate baseline profiles for each cluster. For assets with continuous historian data available, this process uses 14 to 30 days of representative operating history. For assets with route-based data, it uses the most recent 8 to 12 route measurement cycles (typically covering 2 to 4 months of monthly data). The baseline characterization identifies both the normal vibration amplitude at each monitored frequency and the normal variability of that amplitude under the current operating point — allowing the fault detection models to distinguish between amplitude changes driven by genuine degradation and amplitude changes driven by normal load variation. For new assets without sufficient historical data, iFactory applies an adaptive baseline approach: alerts during the first 14 days of operation are advisory only, with the system calibrating the baseline from the new data while maintaining conservative detection thresholds. After 30 days of production operation, the baseline is promoted to full production status and the standard detection sensitivity is applied. This approach prevents false alarms during early deployment while ensuring that genuine faults developing on new assets are not missed during the calibration period.
Steel plant environments present specific challenges for rotating equipment condition monitoring — high ambient vibration from structural transmission, temperature extremes in melt shop and hot mill areas, dusty and corrosive atmospheres, and electromagnetic interference from arc furnaces and large drive systems. iFactory addresses each of these challenges through the analytics architecture rather than requiring special sensor hardware. Structural vibration — transmission from adjacent heavy equipment or rolling operations — is separated from true machine vibration through synchronous averaging and order-based analysis that isolates the monitored asset's shaft-speed harmonics from non-synchronous structural noise. Temperature effects on vibration amplitude and frequency are corrected through the operating state normalization model, which includes bearing housing temperature as a parameter in the baseline selection. For electromagnetic interference in EAF areas affecting MCSA signals, iFactory applies signal conditioning filters calibrated to the specific interference frequency characteristics of the plant's electrical environment. For sensor installations in extreme-temperature locations (up to 150°C bearing housing), standard industrial vibration transmitters with appropriate temperature ratings are used — iFactory's sensor specification guidance provides hardware recommendations for each installation environment encountered during the site assessment.
iFactory integrates with all major CMMS platforms deployed in U.S. steel operations through REST API, OData, or flat-file exchange depending on the platform's available integration interfaces. Supported platforms include SAP Plant Maintenance (PM) via RFC and REST API — the most common CMMS in integrated steel operations — IBM Maximo via REST API, Infor EAM via web services, Oracle eAM via REST API, and AVEVA Asset Performance Management via direct integration. For plants running custom or legacy CMMS platforms without published API interfaces, iFactory provides a configurable flat-file work order export in the format required by the target system, with automated file placement in the import directory on the configured schedule. Work orders are generated with pre-populated fields including asset ID (matching the CMMS functional location or equipment number), fault description, recommended inspection scope, priority classification (Emergency/High/Medium/Low based on CRS), estimated labor hours for the recommended intervention, and attachment of the iFactory condition trend chart as supporting documentation. The work order generation trigger threshold is configurable per asset class and per criticality classification — Critical assets generate work orders at lower CRS thresholds than General assets, ensuring that high-consequence assets receive earlier intervention planning without generating noise on non-critical equipment.
For a steel plant monitoring 400 rotating assets — covering critical and important assets from melt shop through rolling and finishing — iFactory's complete platform deployment runs $95,000 to $195,000 depending on data connectivity complexity, CMMS integration scope, and whether supplemental sensor hardware is required for coverage gaps. The cost breaks into data integration (historian and sensor connectivity): $24,000–$55,000; platform configuration (asset register, baseline establishment, criticality classification, alert threshold setup): $38,000–$78,000; CMMS work order integration and testing: $18,000–$38,000; training and commissioning: $15,000–$24,000. Supplemental sensor hardware for coverage gaps — typically 20 to 60 additional vibration transmitters at $800 to $1,400 per sensor installed — adds $16,000 to $84,000 where required and is specified in the Phase 1 gap assessment. Deployment timeline from contract execution to full fleet monitoring is 7 to 11 weeks: Weeks 1–3 cover data connection and asset register build; Weeks 4–6 cover baseline establishment and alert threshold calibration; Weeks 7–11 cover CMMS integration, fleet risk ranking configuration, and operator training. The first actionable fault detections typically arrive within 30 days of data connection as baselines are established asset by asset. Against the $1.6 million average annual savings at comparable steel plants, payback typically occurs within 3 to 5 months — often from a single prevented large drive motor or process fan failure event in the first operating quarter.
.png)