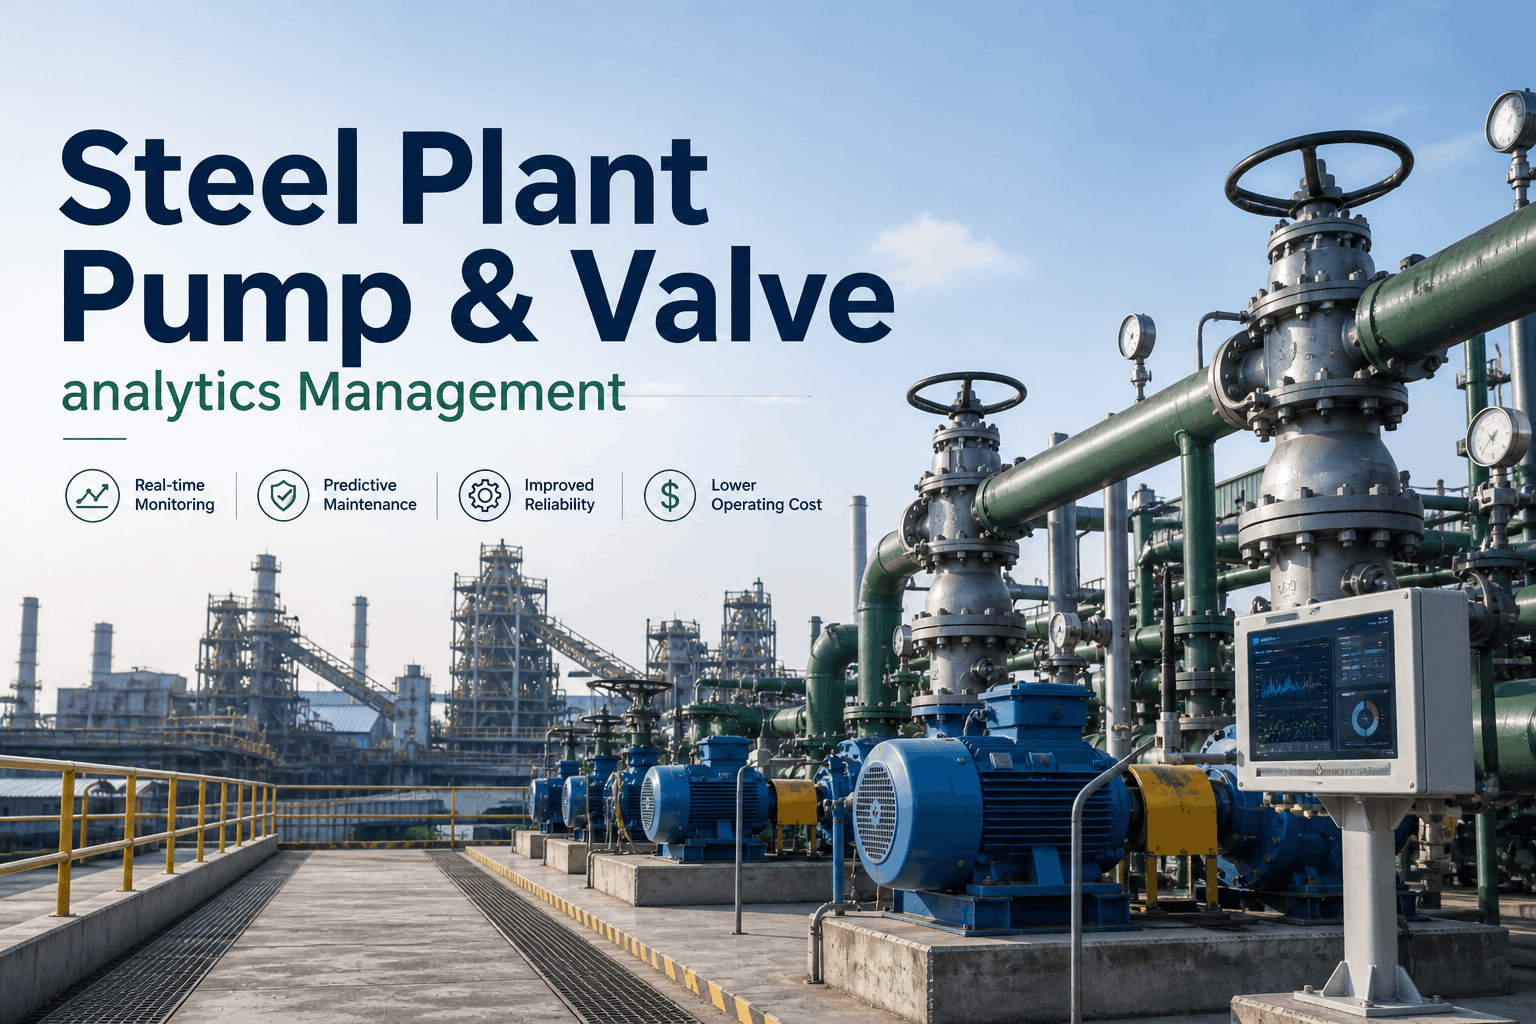
Pumps and compressors are the circulatory system of a steel plant. Cooling water flows through hundreds of heat exchangers, tuyères, mold cooling circuits, and roller tables. Hydraulic power units drive ladle gates, converter tilts, continuous caster segments, and rolling mill screwdowns. Process gas compressors move blast furnace gas, oxygen, nitrogen, argon, and compressed air across dozens of consumers simultaneously. When any of these machines fails — without warning, as they almost always do when managed reactively — the consequence is not a slowed conveyor or a delayed shipment. It is a furnace tap interrupted mid-heat, a continuous caster forced into an unplanned sequence stop or a rolling mill screwdown that loses hydraulic pressure mid-pass. The financial damage from a single unplanned pump or compressor failure in an integrated steel plant ranges from $180,000 to over $1.2 million per event when lost production, emergency maintenance labor, and downstream quality losses are fully accounted. Yet the condition data that would predict these failures — vibration signatures, seal leakage rates, oil contamination levels, suction pressure drops, discharge temperature trends — exists in every steel plant. The problem is that without an AI analytics layer connecting and interpreting that data continuously, it sits in historians, generates no alerts, and informs no decisions until the machine has already failed. This guide covers the complete pump and compressor reliability picture for steel plants: the critical machine families, their characteristic failure modes, the condition monitoring parameters that predict those failures, and the specific AI analytics capabilities that convert raw sensor data into protection against the unplanned outages that are costing your plant millions annually.
Why Pump and Compressor Failures Hit Steel Plants So Hard
Steel manufacturing is a continuous-process industry. Unlike discrete manufacturing where individual machine downtime creates a local delay, a pump or compressor failure in an integrated steel plant propagates upstream and downstream through process dependencies that are physically constrained and thermally time-limited. A cooling water pump serving a blast furnace tuyère cooling circuit cannot be offline for more than minutes before tuyère thermal damage begins. A hydraulic power unit feeding a continuous caster segment drive cannot lose pressure mid-strand without forcing a sequence stop — and every sequence stop requires casting a short strand, cleaning the tundish, restarting, and absorbing the associated heat, time, and quality losses. A process gas compressor failure on a blast furnace gas network can require reverting to backup fuel supply at two to three times the operating cost, for as long as the compressor is unavailable.
The reactive maintenance paradigm — wait for failure, then repair — generates three separate cost streams that most maintenance accounting systems undercount. Direct repair costs (parts, labor, expedited delivery of specialty seals or impellers) typically represent less than 30% of the total failure cost. Production losses — the value of steel not made while the affected process is offline or degraded — typically represent 50 to 65%. And consequential equipment damage — the bearing housing damage, shaft deflection, or impeller erosion that occurs when a machine runs to failure rather than being taken down on a planned outage — typically adds another 10 to 25%. iFactory's pump and compressor analytics platform targets all three cost streams simultaneously: predicting failures before they occur eliminates production losses, enables planned component replacement rather than emergency repair, and prevents the consequential equipment damage that turns a $15,000 seal replacement into a $120,000 shaft and housing rebuild. Book a Demo to see why pumps and compressors fails
The Four Critical Pump and Compressor Families in Steel Plants
Steel plants operate four distinct families of pump and compressor assets, each with different process criticality, characteristic failure modes, and condition monitoring requirements. Treating all four as a single asset class — as most generic CMMS platforms do — results in over-monitoring low-risk machines and under-monitoring critical ones. iFactory's steel plant analytics library includes pre-configured monitoring templates for each family, calibrated to the specific process context and consequence severity of each machine type.
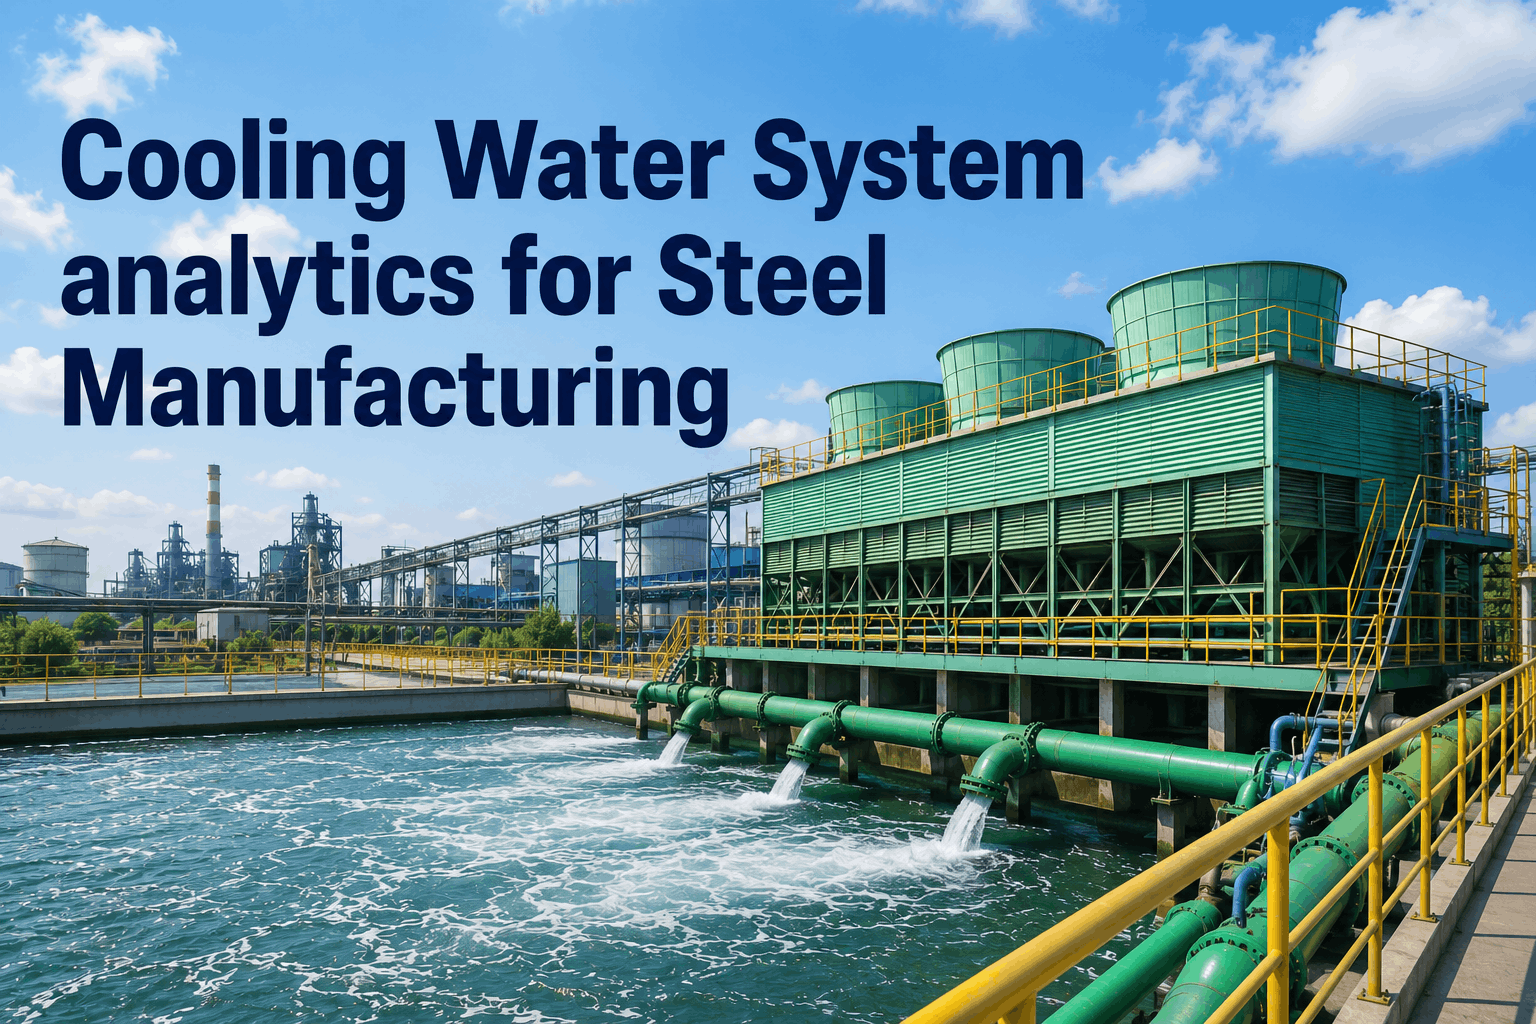
Cooling Water Pump Systems
Cooling water pumps are the highest-density pump population in a steel plant. A typical integrated mill operates 80 to 150 cooling water pumps across blast furnace stave cooling, converter shell cooling, continuous caster mold and secondary cooling, reheat furnace skid cooling, and rolling mill roll cooling circuits. Most are large centrifugal pumps — 200 kW to 2,000 kW — running continuously at fixed speed or via variable frequency drives. Their failure consequence ranges from moderate (roll cooling circuit pump with backup available) to catastrophic (blast furnace tuyère cooling pump with no standby).
Hydraulic Power Units (HPU)
Hydraulic power units in steel plants drive the most safety- and quality-critical actuators in the process: converter tilting drives, continuous caster segment clamping, hot rolling mill screwdowns and loopers, coiler mandrel expansion, and ladle slide gates. HPU failures are particularly consequential because they are frequently single-point failures — there is typically no backup HPU for a caster segment drive or a converter tilt — and because hydraulic pressure loss in the middle of a critical operation creates both safety risk and immediate quality loss.
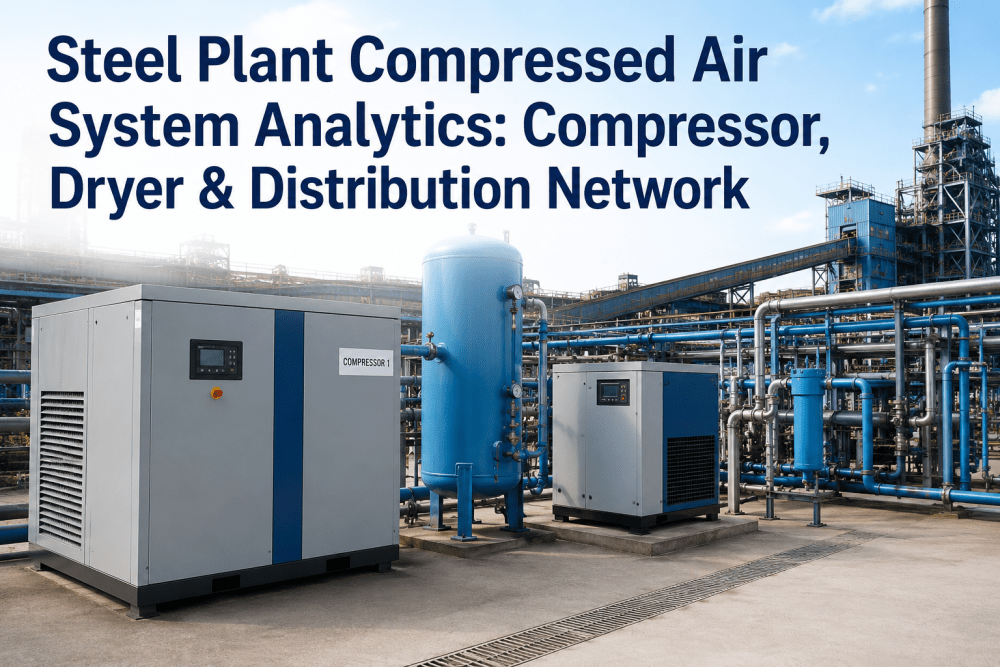
Process Gas Compressors
Process gas compressors in integrated steel include blast furnace gas boosters, coke oven gas compressors, oxygen and nitrogen compressors serving the BOF shop and continuous caster, and compressed air systems. BFG compressors operate in dust-laden, moisture-variable environments that accelerate impeller fouling. COG compressors handle naphthalene and tar vapor content that condenses under certain temperature conditions. Oxygen compressors operate under explosion prevention constraints that make over-temperature and contamination detection safety-critical rather than merely reliability-critical.
Vacuum Pump Systems
Vacuum pumps in steel plants serve RH degassing vessels and VOD units, requiring large steam ejector or mechanical vacuum systems to achieve sub-millibar pressures for hydrogen and nitrogen removal from liquid steel. Vacuum degassing is mandatory for virtually all high-grade steel production — automotive deep-drawing grades, bearing steels, tool steels, and electrical steels all require degassing — meaning that vacuum system availability directly constrains the plant's ability to produce premium-grade output.
Condition Monitoring Parameters: What to Measure and Why
Effective pump and compressor analytics requires monitoring the right parameters — not every available parameter. Over-instrumented machines with no analytics layer generate alarm fatigue. Under-instrumented machines miss the early warning signals that make predictive intervention possible. iFactory's steel plant monitoring framework defines a tiered instrumentation and analytics approach based on failure consequence, failure mode distribution, and sensor ROI for each machine class.
| Parameter | Machine Types | Measurement Method | Failure Modes Detected | Min. Sampling Rate | iFactory Analytics Action |
|---|---|---|---|---|---|
| Vibration Velocity (10–1,000 Hz) | All rotating pumps & compressors | Accelerometer (4-20mA or ICP) | Bearing, imbalance, misalignment, looseness | Continuous (1-sec RMS) | ISO 10816 trending + AI anomaly baseline |
| Vibration Spectrum (FFT) | Compressors, critical pumps | Online spectrum analyzer or periodic route | Specific bearing frequencies, gear mesh, blade pass | Hourly FFT snapshot | Automated fault frequency identification |
| Bearing Temperature | All rotating equipment | PT100 RTD or thermocouple at bearing housing | Lubrication failure, overload, cooling loss | Continuous (30-sec) | Rate-of-rise alarm + absolute threshold |
| Suction / Discharge Pressure | Pumps, compressors | Existing process transmitters (4-20mA) | Cavitation, impeller wear, valve leakage, fouling | Continuous (1-sec) | Pump curve deviation model (head vs. flow) |
| Motor Current (per-phase) | All motor-driven machines | CT clamps on MCC or existing SCADA point | Hydraulic load change, rotor fault, bearing load | Continuous (1-sec) | Motor Current Signature Analysis (MCSA) |
| Seal Flush Pressure / Flow | Mechanical seal pumps | Pressure transmitter on flush line | Seal face wear, flush blockage, leakage onset | Continuous (10-sec) | Deviation from baseline flush demand model |
| Oil Particle Count (ISO 4406) | HPU, compressor lube systems | Inline particle counter (optical) | Gear/pump internal wear, contamination ingress | Continuous or 4-hr sample | Wear particle rate-of-change trending |
| Discharge Gas Temperature | Reciprocating compressors | Thermocouple per cylinder / stage | Valve wear, intercooler fouling, compression ratio shift | Continuous (30-sec) | Stage-to-stage temperature balance model |
iFactory AI Analytics: How the Platform Converts Sensor Data Into Decisions
Collecting condition data from pumps and compressors is a solved problem — every modern steel plant has historians full of sensor data. The unsolved problem, until AI analytics, was converting that data into actionable maintenance intelligence faster than the human eye could spot trends across hundreds of assets simultaneously. iFactory's steel plant analytics platform addresses four specific intelligence gaps that manual monitoring and rule-based alarming cannot close.
Multi-Variable Anomaly Detection
Individual sensor threshold alarms miss the degradation signatures that only appear as correlated deviations across multiple parameters simultaneously. A centrifugal pump bearing in early-stage degradation may show vibration velocity still within ISO 10816 Zone B, bearing temperature only 3°C above its summer baseline, and motor current 1.2% above the rolling average — individually, none of these triggers an alarm. Together, as a correlated multi-variable pattern that iFactory's AI recognizes from thousands of historical pump degradation events, they constitute a bearing failure prediction with 14 to 21 days of lead time. iFactory monitors every machine as a multivariate system, not as a collection of independent alarm points.
Process-Aware Baseline Adjustment
Pump and compressor condition parameters change with process load, ambient temperature, fluid properties, and operating mode. A cooling water pump running at 60% speed during a furnace tap shows very different vibration and temperature signatures than the same pump at 100% speed during peak cooling demand. Static alarm thresholds calibrated at full load trigger false alarms at part load, or miss real degradation signatures masked by load effects. iFactory's baselines are dynamic — continuously recalibrated to the machine's current operating point — so that an anomaly detected at any load condition is a genuine deviation from expected state at that load, not a load-change artifact.
Hydraulic Circuit Performance Modeling
HPU analytics requires understanding the relationship between pump output, circuit demand, and actuator response — not just monitoring the pump in isolation. iFactory models each hydraulic circuit as a system: expected pressure at each actuator demand profile, expected flow consumption, expected temperature rise across the circuit. Deviations from these circuit models identify whether a performance problem originates at the pump (volumetric efficiency loss), in the circuit (valve wear, seal leakage, line blockage), or at the actuator (servo valve degradation). This system-level diagnosis dramatically reduces investigation time between fault detection and confirmed root cause identification — from days to hours.
Compressor Map Monitoring and Surge Protection
Centrifugal compressors must be operated within defined boundaries on the compressor map — the performance envelope defined by head, flow, speed, and gas composition. Operation too close to the surge line risks a catastrophic surge event; operation far from the surge line wastes energy on unnecessary anti-surge recycle. iFactory continuously plots each compressor's real-time operating point on its map, tracking distance to the surge line as gas demand and composition fluctuate. When the operating point approaches a defined surge margin boundary, iFactory alerts operators and recommends anti-surge valve adjustments or speed changes before a surge event occurs.
Pump Curve Analytics: The Most Underused Diagnostic in Steel Plants
Every centrifugal pump has a characteristic curve — the relationship between head (pressure) and flow at a given speed — that is defined by its impeller geometry and degraded by wear, fouling, or damage in characteristic, predictable ways. Tracking a pump's actual operating point against its design curve, continuously, is one of the most powerful early-warning diagnostics available — and one of the least implemented, because it requires simultaneously reliable flow measurement, suction and discharge pressure data, and an analytics layer to compare the live data against the design curve. Most steel plants have two of the three. iFactory's pump performance module supplies the third.
Hydraulic Oil Condition Analytics: The Highest-ROI Monitor in Steel Plants
Oil condition monitoring is the highest-ROI condition monitoring investment available for hydraulic power units and oil-lubricated compressors — and the most consistently under-implemented. Inline oil condition sensors — continuous particle counters, water activity sensors, viscosity monitors, and ferrographic wear debris detectors — combined with iFactory's oil condition trending analytics, provide continuous visibility into the degradation rate of both the oil and the machine it lubricates.
Expert Review: Pump and Compressor Analytics in Steel
The steel industry has been instrumented for decades — the data was always there. What we lacked was the analytical layer that could look at 200 parameters across 120 pumps simultaneously and tell you which three machines were going to fail in the next 21 days, with enough specificity to know whether you needed to order a mechanical seal or a set of bearings. iFactory changed that conversation completely for us. Within the first six months, we had three significant pump failures predicted and planned out — two cooling water pumps serving the caster and one BFG compressor — that under our old reactive model would have been unplanned events costing us somewhere between $600,000 and $1.4 million combined. The platform paid for itself on the first event. The cultural change is real too: our maintenance planners now trust the predictions, and operators have stopped the habit of running machines until something breaks because they believe the AI will tell them when to act.
Conclusion: From Reactive Repair to Predictive Protection
Steel plants that continue managing pumps and compressors reactively are not just accepting higher maintenance costs — they are accepting the strategic disadvantage of unpredictable production capacity. When a cooling water pump fails unexpectedly, the question is not just how quickly it can be repaired. The question is how many heats were lost, whether the continuous caster had to be emergency-stopped, whether the downstream rolling mill lost its schedule, and whether customer commitments were affected. Every one of those consequences was avoidable with 14 to 21 days of prediction lead time.
iFactory's pump and compressor analytics platform for steel plants converts the condition data your historians are already collecting — vibration, temperature, pressure, motor current, oil particle count — into a continuously updated, prioritized list of machines approaching failure, with specific failure mode identification and recommended maintenance actions. The result is a maintenance organization that spends its labor on planned interventions rather than emergency responses, a production organization that operates with confidence rather than uncertainty, and a financial outcome that documents multi-million dollar avoided failure costs in the first year of deployment.
Frequently Asked Questions
iFactory connects to your historian (OSIsoft PI, Aveva, Wonderware, Ignition, or any OPC-UA compliant system) and SCADA platform via read-only data extraction — no writes to production systems, no changes to DCS logic, no interruption to existing control architecture. The integration is completed at the historian or data gateway level, typically requiring 2 to 4 weeks for a full steel plant connectivity scope. For plants using older proprietary historians, iFactory provides lightweight edge connectors that extract data via standard industrial protocols (Modbus, OPC-DA, OPC-UA) without any modification to the production control system. Most steel plant customers achieve full data connectivity within the first 30 days of engagement.
iFactory delivers meaningful analytics from the instrumentation most steel plants already have: motor current from MCC or SCADA, suction and discharge pressure, bearing temperature, and basic process flow data. From these four data streams, iFactory's Motor Current Signature Analysis and process deviation models can detect bearing degradation, impeller wear, seal performance decline, and pump efficiency loss without any additional sensors. For plants that want to maximize prediction lead time and failure mode specificity, iFactory recommends adding continuous vibration monitoring on critical pumps — but this is an enhancement, not a prerequisite. A typical steel plant reaches 70–80% of maximum analytics value with zero new sensor investment in the first phase.
iFactory's alert architecture is explicitly designed to prevent alarm fatigue. The platform uses a criticality-weighted prioritization model: every alert is scored on failure consequence severity, confidence level of the failure prediction, and urgency based on estimated time to failure. The maintenance team sees a prioritized work list — typically 3 to 8 actionable items per shift, not 50 low-confidence alerts — with each item presenting the machine, predicted failure mode, recommended action, and estimated consequence of deferring. False positive rates across iFactory's steel plant deployments are below 8%, meaning that when iFactory flags a machine, maintenance teams act on it with confidence.
Yes — iFactory maintains separate, independently trained baseline models for each individual pump in a duty/standby arrangement. When a pump transitions from standby to duty service, iFactory detects the mode change through motor current and process data, activates the appropriate baseline for that machine in that service role, and immediately begins generating condition assessments against the correct reference. Standby machines are also monitored during periodic test runs — iFactory captures vibration, temperature, and hydraulic performance data from every standby test and updates the standby machine's baseline accordingly, so that when it enters duty service, its condition entering service is already well-characterized.
A full steel plant deployment — covering cooling water pumps, HPUs, process gas compressors, and vacuum systems — is typically completed in 6 to 10 weeks from contract execution to live analytics. The deployment sequence runs from historian and SCADA connectivity in weeks 1–3, through asset registry configuration in weeks 2–5, baseline model training in weeks 4–8, operator training in weeks 7–9, and live production monitoring from week 9 onward. Most steel plants receive their first actionable failure prediction within 30 days of live monitoring. First-year ROI averages 4.8× the platform cost across iFactory's steel plant customer base. A site-specific ROI model is available as part of the pre-engagement process.