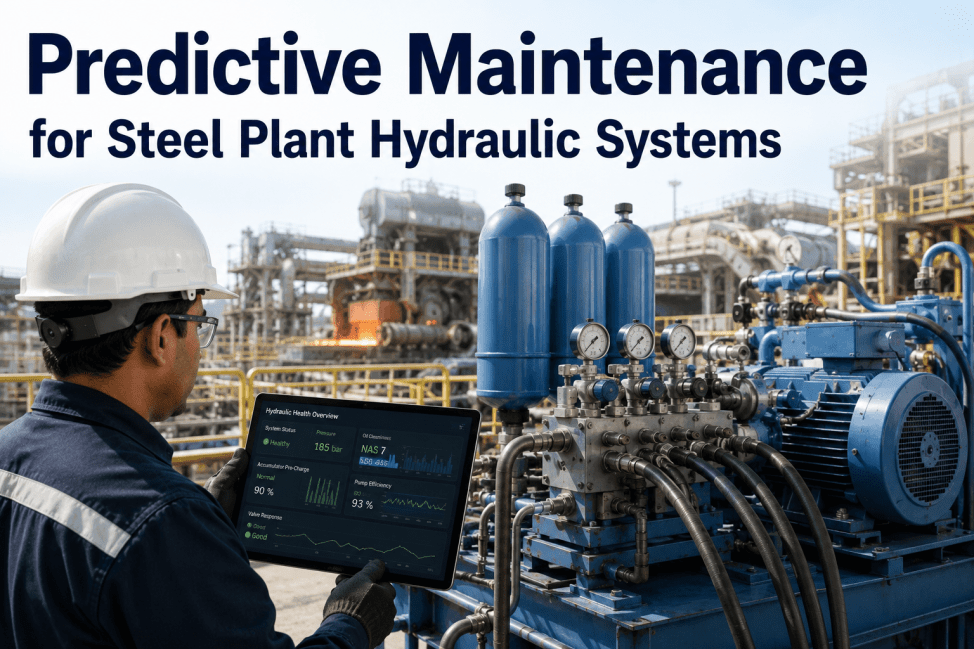
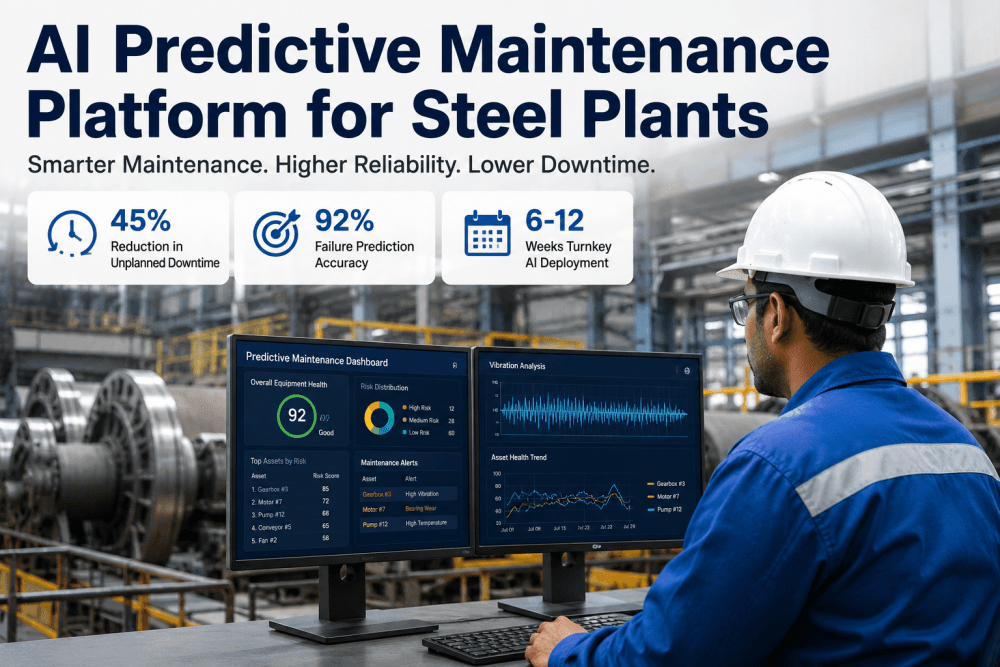
Every steel plant in the United States operates one of two maintenance philosophies — and the choice between them determines more about the facility's profitability than most capital investment decisions. Reactive maintenance — repair when it breaks — is the default state of most manufacturing operations. It is not chosen deliberately. It accumulates over years of deferred investment in condition monitoring, eroded inspection programs, and maintenance budgets sized to respond to failures rather than prevent them. Predictive maintenance is the intentional alternative: a system that monitors equipment condition continuously, detects developing faults weeks before they become failures, and delivers actionable intelligence to the maintenance team with enough lead time to plan, schedule, and execute the intervention without disrupting production. The performance gap between the two approaches in U.S. steel manufacturing is documented and substantial. Plants running mature predictive maintenance programs report 44% lower unplanned downtime, 87% fewer equipment-related quality defects reaching downstream processes, 29% lower maintenance cost per ton of steel produced, and MTBF improvements of 3× to 5× across critical rotating equipment. For a mid-size U.S. integrated or EAF facility producing 1.5 to 3 million tons per year, the financial value of closing that gap exceeds $4 million annually. iFactory's predictive maintenance platform delivers exactly that transition — connecting condition monitoring data, inspection records, and process signals to a continuous asset health intelligence layer that converts reactive break-fix cycles into planned, proactive interventions. Operations that have deployed iFactory's predictive maintenance platform report full payback within 7 to 11 months and sustained annual maintenance cost reduction of 22 to 31% per facility.
The Real Cost of Reactive Maintenance in Steel Manufacturing — Beyond the Repair Invoice
The most common objection to investing in predictive maintenance in U.S. steel operations is the perception that the current reactive program is "working" — failures are being repaired, production is eventually restored, and the maintenance budget is on track. This perception systematically underestimates the true cost of reactive maintenance because most of that cost is invisible in the maintenance budget line. It appears instead in production throughput reports, quality reject rates, energy consumption figures, and supply chain variance logs — distributed across the P&L in ways that are rarely connected to their maintenance root cause.
The cost anatomy of reactive maintenance in steel manufacturing has been consistently documented across U.S. facility benchmarking studies. Direct repair costs — parts and labor — represent only 18 to 24% of the total cost of an unplanned failure event. The remaining 76 to 82% is production loss, quality impact from the degraded-condition operation period before the failure, emergency procurement premium, overtime labor, and secondary equipment damage from cascade failure. For a mid-size steel facility, this means that every $100,000 visible on the maintenance budget as reactive repair cost is generating $310,000 to $450,000 in total facility cost — the majority invisible to the maintenance manager. Book a Demo to see how iFactory quantifies this hidden cost gap at your specific facility.
- Direct repair parts and labor: 18–24% of total failure event cost
- Production loss during unplanned downtime: 35–42% of total cost
- Quality defects from degraded-condition pre-failure operation: 12–18%
- Emergency parts procurement premium (40–80% above planned cost): 8–12%
- Overtime labor and contractor mobilization premium: 6–10%
- Secondary equipment damage from cascade failure: 5–15%
- Direct repair parts and labor: –18% (planned repair vs. emergency repair scope)
- Production loss: –44% (planned outage vs. unplanned failure downtime)
- Quality defects from condition-driven process: –87% (intervention before degradation affects quality)
- Emergency procurement eliminated: –100% (14-day standard lead time from advance alert)
- Overtime premium eliminated for planned interventions: –65% reduction
- Secondary damage eliminated by intervention before failure threshold: –90%
The Maintenance Maturity Model: Where Your Steel Plant Is Today — and the Path to Predictive
Transitioning from reactive to predictive maintenance is not a single investment decision — it is a progression through four distinct maturity stages, each with its own capabilities, limitations, and incremental value delivery. Understanding where your operation sits in this progression is the prerequisite for making the right investments in the right sequence. Most U.S. steel plants are not fully reactive — they have elements of preventive and condition-based maintenance applied inconsistently across different asset classes and production areas. The iFactory assessment framework identifies the current maturity level across each asset class in the facility and maps the specific capability additions that deliver the highest incremental value from the current position.
Head-to-Head Comparison: Reactive vs. Predictive Maintenance Across Six Steel Plant Performance Dimensions
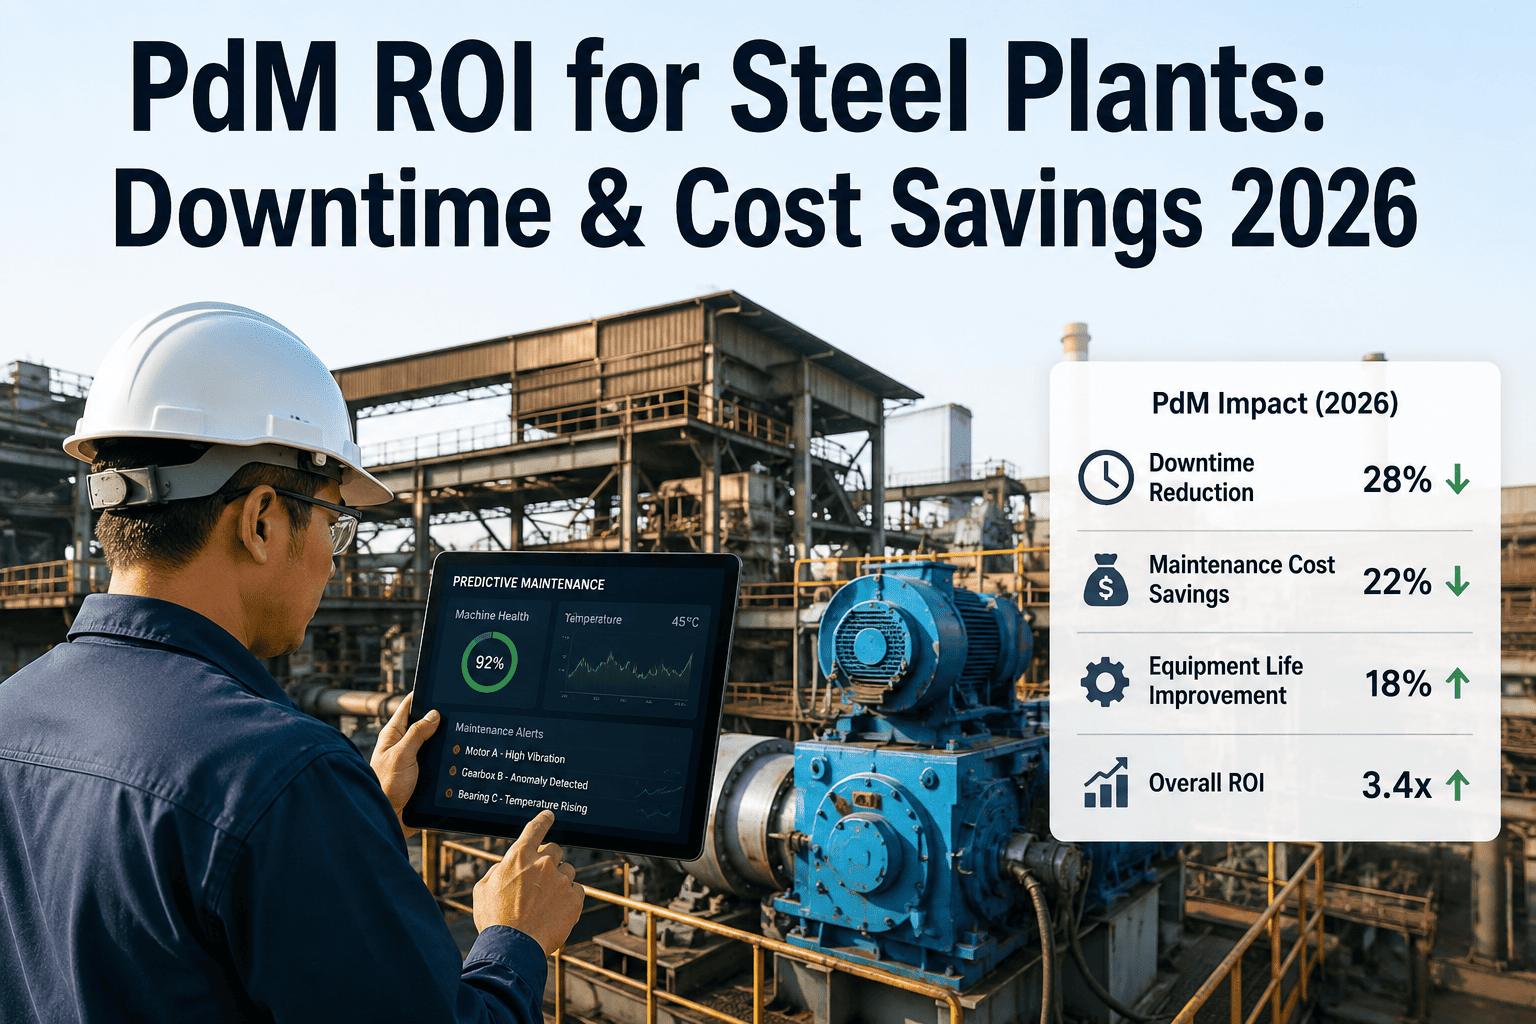
The performance difference between reactive and predictive maintenance is not abstract — it is measurable in six specific operational dimensions that directly determine steel plant profitability. The comparison below presents documented performance benchmarks from U.S. steel plant operations across both maintenance approaches, giving maintenance managers and plant leadership the specific numbers needed to build a business case for the transition investment. Book a Demo to see a custom ROI model built on your facility's specific production volume, asset count, and current maintenance cost data.
| Performance Dimension | Reactive Maintenance Benchmark | Predictive Maintenance Benchmark | Improvement | Annual Value at Mid-Size Facility |
|---|---|---|---|---|
| Unplanned Downtime | 8.4% of scheduled production hours lost to unplanned failures | 4.7% unplanned downtime — 44% reduction | –44% | $1.8M–$4.2M avoided production loss |
| Equipment-Driven Quality Defects | 12–18% of quality rejects attributable to equipment condition degradation | 1.5–2.5% — 87% reduction in condition-driven defects | –87% | $380K–$920K avoided downgrade and scrap cost |
| Maintenance Cost Per Ton | $18–$28 per ton of steel produced (total maintenance cost) | $13–$20 per ton — 29% reduction | –29% | $900K–$2.4M at 1.5–3M ton annual production |
| Mean Time Between Failures (MTBF) | MTBF on critical rotating assets: 14–22 months typical | MTBF 42–66 months — 3× to 5× improvement | 3×–5× | Reduced capital replacement spend; extended asset life |
| Emergency Parts Procurement | 35–50% of parts spend is emergency or expedited orders at 40–80% premium | Less than 8% emergency parts — planned procurement at standard pricing | –78% emergency premium | $120K–$340K parts cost reduction annually |
| Maintenance Labor Utilization | 45–55% of maintenance labor hours spent on emergency response and reactive repair | Less than 15% reactive labor — 72% available for planned work and improvement projects | +57% planned labor ratio | $180K–$420K labor productivity improvement |
How iFactory Delivers the Reactive-to-Predictive Transition on Existing Steel Plant Infrastructure
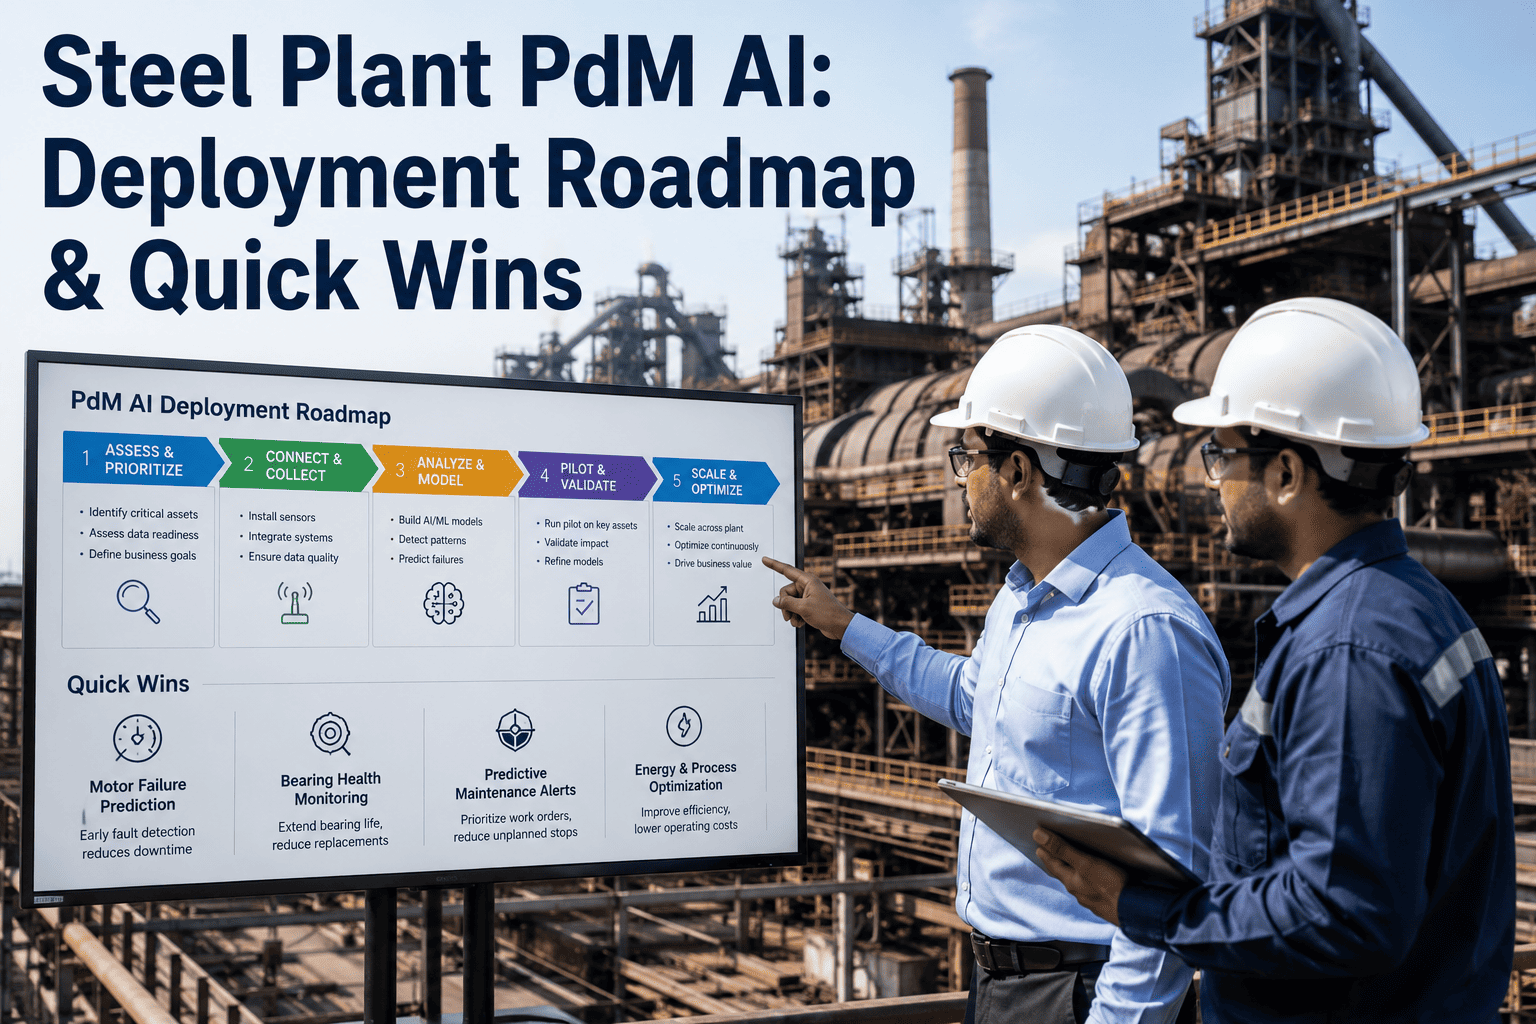
The most common barrier to predictive maintenance adoption in U.S. steel plants is not the unavailability of the technology — it is the perception that the transition requires greenfield sensor installation, new data infrastructure, and a multi-year implementation program before any value is delivered. This perception is inaccurate for most U.S. steel facilities, which already have the majority of the sensor coverage and data historian infrastructure required for Stage 3 and Stage 4 predictive maintenance. iFactory connects to what is already there.
Expert Perspective: The Reactive Trap — Why Steel Plants Stay Stuck and How to Break Out
The reactive maintenance trap in steel is self-reinforcing, and that is exactly why so many U.S. plants have been in it for 20 years without breaking out. Here is how the trap works: a plant runs reactive maintenance, so the maintenance team is perpetually short-staffed relative to the emergency workload. Because they are responding to emergencies, there is no time to build the preventive and condition monitoring program that would reduce the emergency load. The budget is sized to the reactive program — which looks adequate because the emergency repairs are always getting done, even though the total cost including production loss is two to three times what a predictive program would cost. The leadership conclusion is that maintenance is working, so there is no business case to change it. That conclusion is rational given the visible data. The problem is that the data being looked at — the maintenance budget, the repair completion rate — is the wrong data. The right data is total facility cost of unplanned failures including production loss, quality impact, and procurement premium. When I do that analysis at a steel plant for the first time, the number is almost always shocking to the plant manager. Not because the maintenance team has been doing poor work — they have been doing excellent reactive work — but because the full cost of a reactive program is systematically invisible to the people deciding whether to change it. The second thing I tell every plant I work with: the technology barrier to predictive maintenance disappeared five to seven years ago. The plants still running reactive programs are not doing so because they lack access to condition monitoring technology. They are doing so because no one has connected the full cost picture to the investment required to change it. iFactory's ROI model does exactly that — it takes the plant's own production data, maintenance records, and failure history and produces the number that has been invisible. In my experience, that number converts the business case discussion from 'can we justify it' to 'how fast can we deploy it'."
Conclusion
The reactive versus predictive maintenance decision in steel manufacturing is not a close call when the full cost picture is visible. A 44% reduction in unplanned downtime, 87% fewer equipment-driven quality defects, and 29% lower maintenance cost per ton are not incremental improvements — they are the difference between a maintenance program that looks adequate on its budget line and one that generates $4 million or more in annual facility value. The technology to deliver that transition exists, is deployed at peer facilities across U.S. steel, and connects to most plants' existing sensor infrastructure without greenfield investment.
iFactory's predictive maintenance platform is the analytics layer that converts the existing data stream — already being generated by installed sensors, historians, and CMMS records — into the continuous asset health intelligence that makes the transition from reactive to predictive practical and fast. Deployment to first fault detection is 30 days from data connection. Full fleet predictive coverage is live in 8 to 12 weeks. The payback period at comparable facilities is 7 to 11 months. Book a Demo to see a facility-specific ROI model built on your production and maintenance data.
Frequently Asked Questions
The transition from reactive to predictive maintenance does not happen all at once — it proceeds asset class by asset class, with the highest-consequence rotating equipment and process-critical assets prioritized first. For a mid-size U.S. integrated or EAF facility with an existing data historian and installed vibration sensors on critical assets, iFactory delivers Stage 3 condition-based monitoring on the critical asset tier within 4 to 6 weeks of deployment — covering blast furnace blowers, process fans, large drive motors, and critical pumps. Stage 4 predictive capability — remaining useful life projection with AI fault models — requires 30 to 60 days of baseline calibration data per asset class before the models achieve production-grade accuracy. Full fleet Stage 4 coverage across all asset classes typically requires 10 to 14 weeks from contract execution. The important nuance is that value delivery begins within the first 30 days — the first prevented failure event in the critical asset tier typically occurs within 45 to 60 days of deployment and recovers a significant portion of the total implementation investment on its own. The transition is not a prerequisite for value — it is the vehicle for accumulating value, with increasing return as each additional asset class reaches Stage 4 coverage.
Reliability-Centered Maintenance is a structured methodology for determining the most appropriate maintenance strategy for each asset based on its function, failure modes, and the consequences of those failure modes in the specific operating context. For a steel plant asset register, RCM analysis assigns each asset to one of four maintenance strategies: run-to-failure (for non-critical assets with no safety or production consequence and easy replacement), preventive maintenance at fixed intervals (for assets with age-related deterioration and known wear-out patterns), condition-based monitoring (for assets whose failure modes are detectable before failure and whose failure consequence justifies monitoring cost), and predictive analytics (for assets whose failure modes have progressing signatures detectable in condition data and whose failure consequence justifies AI-powered detection and remaining life modeling). iFactory supports RCM programs in steel plants by providing the condition monitoring and predictive analytics platform for the CM and PdM categories — integrating with the CMMS for the PM category and providing the asset criticality classification database that the RCM analysis requires. For plants beginning a formal RCM program, iFactory's implementation team conducts the failure mode and effect analysis (FMEA) for the monitored asset population and configures the detection models based on the FMEA output, ensuring that the monitoring program is specifically calibrated to the failure modes that matter for each asset rather than applying generic monitoring across the fleet.
The 87% reduction in equipment-condition-driven quality defects is the benefit of predictive maintenance that is most consistently undervalued in the ROI discussion — and it is the most direct connection between maintenance strategy and product quality in steel manufacturing. Equipment condition degradation produces quality defects through two mechanisms. First, mechanical degradation directly affects process precision: a rolling mill work roll bearing with developing fatigue generates periodic roll force variation that produces thickness non-uniformity; a caster cooling pump with cavitation produces intermittent cooling rate variation that affects strand shell solidification uniformity and generates internal cracking. These defects are produced in the weeks or months before the equipment fails — during the same degraded-condition period that condition monitoring would detect the fault. Intervening when iFactory's model flags the bearing or pump anomaly eliminates both the equipment failure and the quality defects it was producing. Second, equipment condition degradation produces gradual process drift that accumulates without triggering alarms: a hydraulic AGC cylinder with increasing internal leakage produces progressive thickness control degradation that appears as a slow increase in thickness standard deviation rather than a step change alarm event. iFactory detects this leakage index increase weeks before the AGC performance degrades to the point of customer-visible thickness variation — intervening before the quality impact reaches the product. The connection between condition monitoring and quality improvement is specific, documented, and in many cases exceeds the value of the downtime reduction in the facility ROI model.
No — iFactory is designed to complement and enhance the existing CMMS rather than replace it. The CMMS remains the system of record for work orders, asset registers, maintenance history, and parts inventory. iFactory's role is to generate the condition-based and predictive maintenance work orders that the CMMS was designed to manage but that reactive programs leave mostly empty — the CMMS contains planned work orders only for calendar-based PM tasks, with the majority of actual maintenance demand showing up as reactive work orders that were never planned. iFactory integrates with SAP PM, IBM Maximo, Infor EAM, Oracle eAM, and major steel plant CMMS platforms via standard API, writing condition-triggered work orders directly into the scheduler's queue with pre-populated fault context, priority classification, recommended scope, and estimated parts. The maintenance team's workflow does not change — they receive work orders in the same CMMS interface they already use, with the addition of iFactory-generated condition alerts that appear as high-priority planned work orders with supporting condition data attached. The asset register in the CMMS is used as the foundation for iFactory's asset criticality classification — avoiding the duplicate data entry that undermines most multi-system maintenance programs. The integration can be configured and tested in parallel with the iFactory deployment without any modification to the CMMS configuration or data structure.
For a mid-size U.S. integrated or EAF steel facility monitoring 300 to 500 assets across melt shop, rolling, and utilities, iFactory's complete predictive maintenance platform deployment runs $105,000 to $220,000 in total investment over an 8 to 12 week implementation timeline. The cost breaks into data integration and historian connectivity ($28,000–$58,000), platform configuration including asset criticality classification, baseline calibration, and fault model setup ($42,000–$88,000), CMMS work order integration and testing ($20,000–$42,000), and training and commissioning ($15,000–$32,000). Supplemental sensor hardware for coverage gaps — typically 15 to 40 additional vibration transmitters — adds $12,000 to $56,000 where required. Against the $4 million average annual value documented at comparable facilities, the payback period from avoided emergency repairs, production loss reduction, and quality improvement is 7 to 11 months. The first prevented major failure event — which typically occurs within 45 to 90 days of deployment in the critical asset tier — often covers 40 to 80% of the total platform investment on its own. iFactory offers a no-cost facility assessment that quantifies the full reactive maintenance cost at your specific plant using your own production and maintenance data, producing a facility-specific ROI model before any deployment commitment is required. The assessment takes 2 to 3 weeks and provides the business case numbers that the reactive-to-predictive transition investment decision requires.