Presenting a predictive maintenance investment to the C-suite is a fundamentally different challenge from presenting it to a reliability engineer. A reliability engineer wants to know about vibration spectra, bearing fault frequencies, and sensor sampling rates. A CFO wants to know three things: how much does our current failure profile cost the company annually, what does it cost to fix it, and when do we get the money back. Answering those three questions with facility-specific numbers — not industry averages — is what separates predictive maintenance proposals that get funded from ones that stall in committee. The data backing those numbers is unambiguous. Unplanned equipment downtime costs the average Fortune 500 manufacturer $2.8 billion per year — approximately 11% of revenue. Deloitte estimates unplanned downtime costs industrial manufacturers $50 billion annually across the sector. Fortune 500 companies are projected to save $233 billion in maintenance costs and 2.1 million hours of downtime annually with full adoption of condition monitoring and predictive maintenance. The gap between those numbers and what your facility is actually recovering today is the financial argument for a C-suite PdM proposal — and this guide gives you the structure, the numbers, and the narrative to build it. Book a Demo with iFactory's reliability team to run this framework against your facility's actual maintenance cost data.
Why Most PdM Proposals Fail at the Executive Level — and What Changes When They Succeed
The most common reason a predictive maintenance business case fails the C-suite review is not that the ROI is insufficient — it is that the proposal presents industry data instead of facility data. When a maintenance director tables a McKinsey statistic showing 18–25% maintenance cost reduction, a CFO has no analytical basis to conclude that number applies to their plant, their asset base, or their current maintenance posture. The numbers are defensible in the aggregate. They are not defensible for this budget line, this year, against this asset inventory.
The proposals that get approved do something structurally different. They open with the verified cost of the facility's two or three most expensive unplanned failures over the past 18 months — numbers that already appear in the P&L and that no one in the room can dispute. They build a conservative projection of prevented-cost value from a 40% reduction in those events. They put that projection against a deployment cost the finance team can verify. The result is not a technology pitch — it is a capital allocation decision framed in language the C-suite already uses. Book a Demo to see how iFactory structures this analysis for manufacturing facilities preparing a PdM capital request.
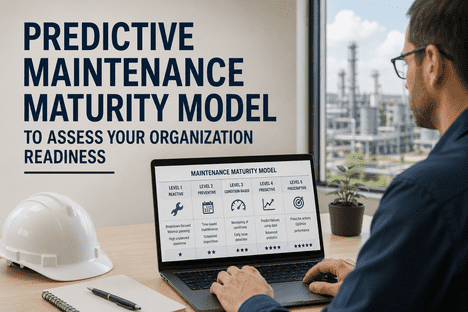
The Five-Section Business Case Framework Your CFO Can Evaluate in 20 Minutes
A C-suite predictive maintenance proposal does not need to be long — it needs to be structured so that a CFO or COO can identify the financial logic without reading every page. The framework below organizes the business case into five sections that map directly to how executive capital reviews evaluate investment proposals. Each section is described with the specific data inputs required and the sources within your facility where that data can be extracted.
Current State: The Verified Cost of Reactive Maintenance
Pull the three highest-cost unplanned failures from the past 18 months from your CMMS or maintenance work order history. For each, calculate the fully loaded incident cost: production output lost (hours down × hourly output value), emergency repair labor at overtime rates, expedited parts, secondary equipment damage, and quality scrap during restart. Present these as real events with real dollar figures — not estimates. This section ends the meeting debate about whether the problem is real.
The Opportunity: What a 40% Downtime Reduction Recovers Annually
Apply a conservative 40% reduction factor — below the 30–50% range documented by McKinsey — to your verified annual downtime cost. Add 70% of your emergency repair premium (the cost difference between emergency and planned repair on the same assets). Add the over-maintenance labor and parts cost you can defer by shifting from calendar-based PM to condition-based maintenance. This is your annual savings target — stated conservatively, so finance cannot dismiss it as optimistic.
The Investment: Platform, Sensors, and Implementation
Present the total deployment cost with a phased breakdown: sensor connectivity and OPC-UA integration, platform configuration and asset criticality registration, inspection workflow automation, and training. For a mid-size U.S. manufacturing facility with 100–200 monitored assets, iFactory's full deployment typically runs $85,000–$220,000 in Year 1, with platform-only cost declining substantially in Years 2–5 as capital spend recedes. Break this into one-time capital and recurring OpEx so the finance team can model it correctly.
Payback Period and ROI Multiple
Divide the total Year 1 investment by the annual savings target to produce the payback period in months. For most mid-size manufacturing facilities with meaningful unplanned downtime history, this number falls between 8 and 18 months. Present the 3-year and 5-year ROI multiple — total savings over the period divided by total platform cost — to give the CFO the long-term value capture picture that justifies the capital allocation against competing uses of budget.
Risk Mitigation: What Happens if We Don't Deploy
The final section reframes the proposal as risk management, not technology investment. Present the probability of a repeat of each verified incident at current monitoring capability. Add the regulatory exposure, insurance premium trajectory, and supply chain penalty risk that attach to a serious equipment failure. This section answers the CFO's unspoken question — what is the cost of doing nothing — and closes the case by making inaction the riskier financial position. Book a Demo to see how iFactory builds this section with facility-specific risk data.
Mapping the Four C-Suite Financial Metrics to PdM Program Outputs
A predictive maintenance proposal lands differently when each program output is mapped directly to a financial metric that already appears on the CFO's dashboard. The table below connects iFactory's platform capabilities to the four executive financial metrics most commonly cited in capital approval decisions at U.S. manufacturing facilities.
| C-Suite Metric | PdM Program Output | iFactory Platform Capability | Documented Impact Range | Measurement Mechanism |
|---|---|---|---|---|
| EBITDA Margin | Unplanned downtime reduction → production output recovery | Consequence-weighted asset monitoring; compound risk detection | 30–50% downtime reduction (McKinsey) | Prevented downtime hours × hourly output value |
| Maintenance OpEx | Emergency repair elimination; PM schedule optimization | Condition-based work order generation; over-maintenance deferral | 18–25% total maintenance cost reduction (Deloitte) | Emergency work order count and spend vs. prior period |
| Asset Utilization | Extended equipment life; reduced rebuild frequency | Asset-specific baseline trending; campaign limit enforcement | 20–40% asset life extension vs. reactive programs | Mean time between failures; rebuild interval vs. baseline |
| Working Capital | Spare parts optimization; emergency freight elimination | Advance work order generation; parts consumption prediction | 15–25% MRO inventory reduction in Year 2 | Emergency parts orders; expedited freight spend |
The Three Objections Finance Will Raise — and How to Answer Them
Every C-suite PdM proposal encounters a predictable set of financial objections. Preparing specific, data-backed responses to each objection before the meeting is what separates proposals that get deferred for "further analysis" from ones that receive capital approval in the same session.
The savings projection is not a forecast — it is a calculation against events that already occurred. The three incidents you presented in Section 1 cost $X. A 40% reduction in their recurrence recovers $Y annually. That is an arithmetic calculation against verified historical costs, not a technology promise. The uncertainty is in the reduction rate, not in the baseline — and 40% is documented as conservative against the 30–50% range across published PdM deployments.
A phased deployment means early-phase savings arrive before full deployment cost is incurred. Phase 1 — high-criticality asset monitoring — is live in 4–6 weeks and begins producing prevented-failure value immediately. The payback period calculation is against total program cost; the first prevented major failure event on a Tier 1 asset frequently recovers Phase 1 cost in a single event. Deferred phases are funded by early-phase savings, not by additional capital budget.
Single-system condition monitoring — vibration sensors on individual assets feeding SCADA alarms — fails because it produces alarm floods operators learn to dismiss. The capability gap is not sensor coverage; it is the analytics layer that aggregates signals across systems, applies consequence weighting, and delivers actionable work orders to the right person with enough lead time to act. iFactory's platform addresses the specific failure mode of previous deployments — not by adding more sensors, but by connecting the data those sensors already generate to a decision-layer that makes it actionable.
Expert Review: What Changes When Reliability Engineering Speaks the Language of Finance
I spent the first decade of my career presenting predictive maintenance proposals to finance teams and watching them get deferred. The proposals were technically sound. The ROI was real. The problem was the language. Reliability engineers speak in availability percentages, MTBF, and vibration trends. Finance teams speak in EBITDA impact, payback periods, and capital opportunity cost. Those are not different emphases on the same facts — they are genuinely different framings of the investment decision, and a proposal written in reliability language will not clear a CFO review no matter how good the underlying numbers are. The shift that changed everything for me was building every business case backward from the P&L. Start with the incidents that already showed up as variances in the operating budget. Put a fully loaded dollar figure on each one. Calculate the recovery from a conservative reduction in their frequency. Then bring in the platform cost and payback period. When you frame a PdM proposal as a calculation against losses the CFO already knows are real — rather than a claim about future technology performance — the conversation changes completely. The objection stops being "prove the ROI" and becomes "what is the deployment timeline." That is the conversation where capital gets approved.
Conclusion: The Business Case Is Already in Your Maintenance Records
The financial argument for predictive maintenance does not require external benchmarks or speculative projections. It requires extracting the verified cost of your three most expensive unplanned failures from the past 18 months, calculating the recovery from a conservative reduction in their frequency, and presenting that recovery against a platform investment your finance team can verify. That calculation — done with facility-specific numbers against a conservative reduction rate — produces a business case that a CFO can evaluate using the same analytical framework applied to every other capital allocation decision.
iFactory AI's platform delivers the operational layer that converts the projection into realized savings: consequence-weighted monitoring across critical assets, automated work order generation with enough lead time to intervene before failure, and an ROI tracking module that produces the documented savings record your organization needs for Year 2 budget justification and program expansion. The data supporting deployment is already in your maintenance records. The question is whether your current analytics architecture is connected to it. Book a Demo with iFactory to build the facility-specific business case your C-suite needs to approve a PdM program this budget cycle.
Frequently Asked Questions: Building a PdM Business Case for the C-Suite
What financial metrics should anchor a predictive maintenance business case for a CFO?
Lead with unplanned downtime cost recovery — the largest and most verifiable component — then add emergency repair premium elimination, over-maintenance deferral savings, and asset life extension value. These four metrics map directly to EBITDA margin, maintenance OpEx, and asset utilization lines the CFO already monitors.
What payback period should we project for a mid-size U.S. manufacturing facility?
For facilities with meaningful unplanned downtime history (two or more major failures per year), payback typically falls between 8 and 18 months. IoT Analytics (2023) found 27% of PdM adopters achieve full payback within 12 months; 95% report positive ROI within two years.
How does iFactory AI support the capital approval process specifically?
iFactory's reliability team works with facilities to extract verified incident cost data from CMMS records, build the four-variable ROI model against facility-specific baselines, and structure the output in a format aligned with how capital reviews evaluate manufacturing investments.
How should we handle the "we've tried condition monitoring before" objection in a C-suite review?
Address the specific failure mode: single-system monitoring fails because it creates alarm floods that operators dismiss. The iFactory platform adds the consequence-weighted analytics layer that makes existing sensor data actionable — it is not a sensor deployment, it is a decision-layer deployment on data you are already generating.
What does iFactory's ROI tracking module produce for Year 2 budget justification?
The module tracks prevented failures, avoided downtime hours, emergency work order reduction, and PM optimization savings against platform investment in real time — generating a documented savings record that closes the loop between the Year 1 business case projection and verified financial outcomes for Year 2 approval.