Predictive Maintenance Maturity Model to Assess Your Organization Readiness
By Daniel Carter on June 12, 2026
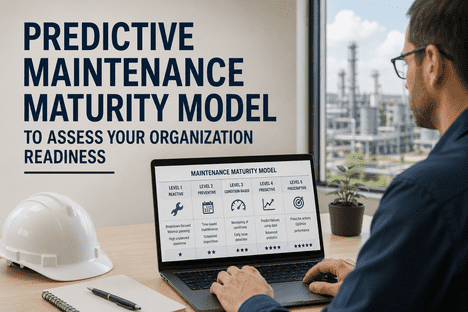
Most reliability and maintenance leaders recognize that their organization operates somewhere between reactive firefighting and world-class prescriptive maintenance — but few can accurately place themselves on the maturity spectrum. Industry research consistently shows that 60–70% of organizations overestimate their maturity level by one to two full levels: a plant running 60% reactive work orders will claim "preventive maintenance" status because they own a CMMS, even though PM compliance sits below 50% and the CMMS is used primarily for work order history rather than schedule-driven planning. The SMRP (Society for Maintenance & Reliability Professionals) maturity framework, refined over two decades by the Ledet model, ARC Advisory Group, and ISO 55000 asset management standards, defines five distinct levels: Reactive (run-to-failure), Preventive (time-based scheduling), Condition-Based (sensor-triggered intervention), Predictive (ML-driven failure forecasting), and Prescriptive (AI-optimized autonomous decision-making). Each level carries measurable benchmarks for reactive work percentage, PM compliance, schedule compliance, maintenance cost per operating hour, and unplanned downtime. iFactory AI's Shift Logbook and predictive maintenance platform provides a structured path for organizations to assess their current maturity, identify the highest-ROI transition, and deploy the data infrastructure, sensor integration, and machine learning models required to advance. Book a Demo to benchmark your maintenance organization against industry standards and build your advancement roadmap.
Predictive Maintenance Maturity Model: Assess Your Organization Readiness
Five-level assessment framework — Reactive · Preventive · Condition-Based · Predictive · Prescriptive — with industry benchmarks, self-scoring criteria, and a deployment roadmap for advancing your maintenance organization's capabilities.
Why Most Organizations Overestimate Their Maintenance Maturity
The gap between perceived and actual maturity is the single biggest obstacle to improvement. A 2026 industry survey found that 68% of maintenance leaders rated their organization at Level 3 (Condition-Based) or higher, yet objective assessment against SMRP benchmarks placed only 22% of those same organizations above Level 2. The discrepancy stems from conflating tool ownership with process maturity — buying a CMMS does not make an organization preventive, and installing vibration sensors does not make it condition-based. The four specific ceilings that trap organizations in maturity overestimation are well documented.
01
CMMS Ownership Without Adoption
Over 80% of industrial organizations own a CMMS, but fewer than 30% achieve >75% technician adoption. A CMMS used primarily for work order history logging rather than schedule-driven planning, parts reservation, and labor forecasting does not constitute Level 2 maturity.
Gap: Ownership vs Effective Use
02
Sensor Installation Without Workflow Integration
Installing vibration sensors, temperature probes, and oil analysis sampling creates data streams, not condition-based maintenance. Level 3 requires that sensor-triggered alerts automatically generate CMMS work orders with asset context, not emails to a reliability engineer who manually decides next steps.
Gap: Data Collection vs Automated Response
03
Dashboard Visibility Without Predictive Models
A real-time dashboard showing vibration trends and temperature readings provides visibility, not prediction. Level 4 requires machine learning models that ingest continuous telemetry, classify fault types with confidence scores, estimate remaining useful life from degradation trajectories, and generate intervention recommendations with specified lead times.
Gap: Monitoring vs Forecasting
04
Pilot Projects Without Organizational Scaling
A successful predictive maintenance pilot on three critical pumps does not constitute Level 4 maturity. True advancement requires the pilot to be replicable — same sensor configuration, model training pipeline, CMMS integration pattern, and operator workflow applied across the entire critical asset fleet with consistent results.
Gap: Pilot vs Fleet-Wide Deployment
The Five Levels of Maintenance Maturity
The SMRP body of knowledge, refined through the Ledet maturity model and ISO 55000 asset management standards, defines five distinct levels with measurable benchmarks. Each level represents a fundamentally different operating model — not just a technology stack but a shift in how maintenance decisions are made, how work is planned and scheduled, and how reliability performance is measured against business outcomes.
L1
Reactive — Run-to-Failure
60–80%+ of work is emergency repair. No structured PM schedules. CMMS absent or used only for cost tracking. Asset hierarchy incomplete. Spare parts inventory disorganized. Asset life averages 60–70% of design life. Maintenance cost per operating hour is 3–5× Level 4 baseline.
Reactive work: 60–80%+ · PM compliance: Informal
L2
Preventive — Time-Based Scheduling
CMMS deployed with calendar and meter-based PM schedules. Planned work reaches 50–70%. PM compliance 60–80% on Tier 1 assets. Schedule compliance 60–75%. Reactive work drops to 20–40%. Asset life improves to 80–90% of design. Basic asset registry exists with name, model, and location data.
Reactive work: 20–40% · PM compliance: 60–80%
L3
Condition-Based — Sensor-Triggered
Sensors deployed on critical assets — vibration, temperature, oil analysis, motor current. CMMS adoption exceeds 90%. Sensor alerts generate CMMS work orders automatically. Planned work reaches 80%+. Reactive work falls to 10–20%. Schedule compliance 75–85%. Asset hierarchy includes BOMs, failure history, criticality rankings.
Machine learning models ingest continuous telemetry, classify fault types with confidence scores, estimate remaining useful life from degradation trajectories validated against IEEE benchmark datasets. Planned work exceeds 95%. Reactive work below 5–10%. Unplanned downtime reduced 70%+ versus Level 1 baseline. 12–18 months of continuous failure history accumulated for model training.
Reactive work: <10% · Cost per op-hr: Baseline
L5
Prescriptive — AI-Optimized Autonomous
AI recommends specific actions, timing, required parts, and scheduling windows for every asset. Near-zero unplanned downtime on critical equipment. Adaptive PM schedules optimized continuously based on actual degradation data rather than fixed intervals. Fully integrated ERP/CMMS/IoT/AI stack. Maintenance strategy aligned with business strategy.
Reactive work: <5% · Asset life: 120%+ of design
What Each Maturity Level Actually Looks Like in Practice
The difference between maturity levels is not theoretical — it is visible in daily operations. A Level 2 plant and a Level 4 plant may own the same brand of CMMS and the same vibration sensor hardware, but their workflows, decision-making processes, and performance metrics are fundamentally different. The comparison table below maps each capability dimension across the five levels.
Capability Dimension
L1 Reactive
L2 Preventive
L3 Condition-Based
L4–L5 Predictive / Prescriptive
Work order origin
Operator reports failure
Calendar-triggered PM
Sensor alert triggers WO
AI model predicts and triggers WO with RUL
Maintenance planning
None — firefighting
Weekly schedule board
Condition-driven prioritization
AI-optimised schedule with parts and labour
Asset data
Paper or none
Basic registry
Full hierarchy with BOM
Digital twin with real-time telemetry feed
Spare parts strategy
Chaotic stockouts
Min-max reorder
Condition-based pre-position
AI-predicted demand with auto-procurement
Operator involvement
Call when broken
Follow PM checklist
Log shift observations
Shift Logbook + AI copilot interface
Performance metrics
MTTR, downtime cost
PM compliance, schedule compliance
OEE, sensor trend adherence
RUL accuracy, PdM precision, cost per op-hr
Unsure where your organization sits on this spectrum? Book a Demo to walk through a structured maturity assessment against SMRP benchmarks across all five levels.
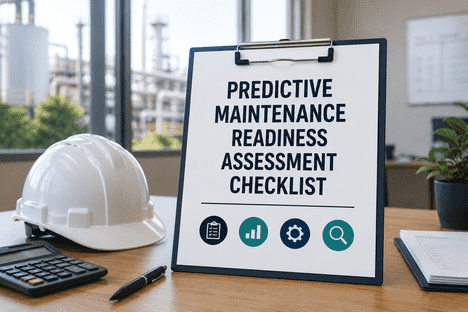
Self-Assessment: Where Does Your Organization Stand?
Honest self-assessment is the prerequisite for advancement. The following seven criteria, derived from the SMRP Body of Knowledge and ISO 55000 asset management standards, provide a structured framework for scoring your organization's maturity level. Each criterion is scored on a 1–5 scale corresponding to the five maturity levels.
01
Reactive work percentage
Ask honestly:
"What percentage of our total work orders are emergency or unplanned repairs?"
Score 1: >60% reactive · Score 2: 20–40% · Score 3: 10–20% · Score 4: 5–10% · Score 5: <5%. This single metric is the strongest indicator of maturity level. Organizations consistently underestimate their reactive percentage by 10–20 points.
02
PM compliance on critical assets
Ask honestly:
"What percentage of scheduled preventive maintenance tasks on Tier 1 assets are completed on time?"
Score 1: No formal PM tracking · Score 2: 60–80% · Score 3: 80–95% · Score 4: >95% · Score 5: >95% with adaptive schedules. PM compliance below 80% indicates that the organization has not achieved Level 2 regardless of CMMS ownership.
03
CMMS adoption depth
Ask honestly:
"Do our technicians use the CMMS daily for work execution, parts lookup, and data recording?"
Score 1: No CMMS · Score 2: Used for WO history only · Score 3: >75% technician adoption · Score 4: Full adoption with mobile · Score 5: CMMS fully integrated with AI layer.
04
Sensor-to-work-order automation
Ask honestly:
"Do sensor alerts automatically generate CMMS work orders with asset context and recommended actions?"
Score 1: No sensors · Score 2: Manual data collection only · Score 3: Sensor alerts generate WOs automatically · Score 4: Alerts include fault classification · Score 5: AI prescribes action and timing.
05
Failure data history
Ask honestly:
"How many months of structured, searchable failure history data do we have for model training?"
Score 1: No failure data · Score 2: Paper records · Score 3: 6–12 months digital · Score 4: 12–18 months continuous · Score 5: 24+ months with telemetry correlation.
06
Schedule compliance
Ask honestly:
"What percentage of planned maintenance work is completed on the scheduled day?"
Score 1: <50% · Score 2: 60–75% · Score 3: 75–85% · Score 4: 90–95% · Score 5: >95%. Schedule compliance below 75% indicates that reactive work is displacing planned maintenance — a Level 1 behaviour.
07
Operator shift log integration
Ask honestly:
"Do operators systematically log equipment observations, anomalies, and shift handover notes in a digital system linked to maintenance?"
Score 1: Paper shift logs · Score 2: Digital but siloed · Score 3: Digital integrated with CMMS · Score 4: Shift logs feed PdM models · Score 5: AI analyses shift log patterns.
Three Deployment Paths for Advancing Your Maintenance Maturity
Same starting point, three valid destinations. The right path depends on current maturity level, asset criticality mix, sensor coverage, and organizational readiness for change. Plants that pick the wrong path spend 12–18 months in pilot purgatory. Plants that pick the right path advance one full maturity level in 8–16 weeks.
Path A
Maturity Assessment & Foundation
6–8 weeks
Structured maturity assessment across all five SMRP levels. Current-state scoring against industry benchmarks. Gap analysis identifying the highest-ROI transition. CMMS adoption audit and Shift Logbook deployment. Best fit for organizations currently at Level 1 or Level 2.
Best fit
Organizations unsure of current maturity · no CMMS or low adoption · need baseline before investing in sensors or AI
Wk 1–2 Assessment against SMRP benchmarks
Wk 3–5 CMMS adoption + Shift Logbook
Wk 6–8 Gap analysis + transition plan
Path B
Condition-Based to Predictive Transition
8–12 weeks
Organizations with existing sensors and CMMS infrastructure deploy the AI predictive layer. Continuous telemetry ingestion replaces periodic data collection. ML models trained on 12+ months of failure history. CMMS-native work orders with fault classification and RUL estimates.
Best fit
Level 3 organizations with sensor infrastructure · mature CMMS adoption · ready for ML-driven failure forecasting
Wk 1–3 Sensor audit + data federation
Wk 4–8 AI model training + shadow mode
Wk 9–12 CMMS integration + operator rollout
Path C
Full Transformation to Prescriptive
12–16 weeks
End-to-end deployment from sensor federation through AI model training, CMMS integration, Shift Logbook rollout, and operator workflow redesign. All asset classes covered. Adaptive PM schedules. AI-optimised parts sparing and labour planning.
Best fit
Organizations with executive sponsorship · 500+ critical assets · strategic mandate for world-class maintenance
Wk 1–4 Fleet-wide asset + sensor inventory
Wk 5–12 Parallel AI build + CMMS integration
Wk 13–16 Cutover + legacy process sunset
Benchmark Your Maintenance Maturity in a 90-Minute Workshop
iFactory AI's reliability practice runs a focused maturity assessment against your specific asset classes, CMMS configuration, sensor coverage, and maintenance workflows. You leave with a scored maturity assessment, a defended path recommendation, an 8–16 week deployment plan, and a cost reduction projection grounded in your actual failure history.
The ROI Math — What Each Level Transition Delivers
The business case for advancing maintenance maturity is not theoretical — it is built on documented cost reduction and downtime avoidance data from industrial plants across every manufacturing vertical. Each level transition delivers measurable, compounding returns. Plants moving from Level 1 to Level 4 capture 50%+ cumulative reduction in maintenance cost per operating hour.
−12–18%
L1 → L2 Cost Reduction
Establishing basic PM discipline, CMMS adoption, and planned work scheduling reduces maintenance cost per operating hour by 12–18% within 6–12 months. Typical investment: $50K–$150K. Payback: 6–12 months.
−18–25%
L2 → L3 Additional Savings
Deploying sensors on critical assets and automating condition-based work orders delivers 18–25% additional cost reduction beyond PM-only savings. Unplanned downtime drops 50% cumulative versus Level 1 baseline.
−10–20%
L3 → L4 Predictive Gain
AI-driven failure forecasting adds 10–20% further cost reduction by eliminating emergency repairs entirely on modelled asset classes. Unplanned downtime reaches 70%+ cumulative reduction versus Level 1. ROI payback: 12–18 months.
10–30×
L4 → L5 ROI on Critical Assets
Prescriptive AI that autonomously optimises maintenance timing, parts ordering, and labour scheduling delivers 10–30× ROI on critical industrial assets with near-zero unplanned downtime.
Expert Perspective
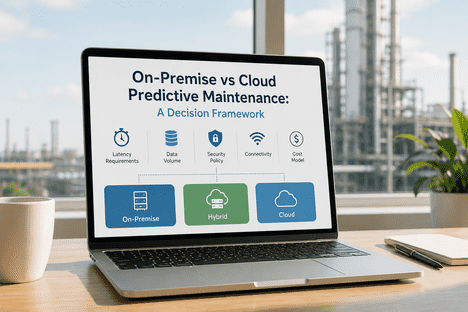
"The single biggest mistake organizations make in maintenance modernization is treating it as a technology deployment project. It isn't. Your CMMS, your vibration sensors, and your ERP system work as designed — there's no business case to replace them wholesale. What needs to change is the data ingestion density, the workflow integration, and the decision-making layer. Monthly route-based data collection needs to become continuous telemetry. Email-based alarm notification needs to become automated CMMS work order generation with fault classification and RUL estimates. Paper-based shift logs need to become digital operator observations feeding predictive model training. The architectural decision isn't buy-new-technology — it's integrate-what-you-have-and-add-the-intelligence-layer. Plants that frame it correctly advance one full maturity level in 8–16 weeks. Plants that frame it as rip-and-replace spend 12–18 months in pilot purgatory."
— Maintenance Reliability Practice, 2026 industry insight
8–16 wk
to advance one full SMRP maturity level
50%+
cumulative cost reduction L1 → L4
Zero rip
of existing CMMS, sensors, or ERP required
Conclusion: The Maturity Advancement Decision Has Three Right Answers
Maintenance maturity is not a destination — it is a continuous improvement discipline. The SMRP framework provides the diagnostic; iFactory AI provides the advancement engine. Whether your organization needs a foundational assessment and CMMS adoption push (Path A, 6–8 weeks), a condition-to-predictive transition (Path B, 8–12 weeks), or a full transformation to prescriptive maintenance (Path C, 12–16 weeks), the deployment path preserves existing CMMS, sensor infrastructure, and ERP systems while adding the AI intelligence layer that converts data into decisions. The decision worth making in 2026 isn't whether to assess and advance your maintenance maturity — it's which path fits your organization's current state and strategic goals. Benchmark your organization against SMRP standards and build your advancement roadmap.
Run the Maintenance Maturity Assessment Built for Your Organization
iFactory AI's reliability practice runs a 90-minute workshop against your real asset classes, CMMS configuration, sensor coverage, and maintenance workflows. You leave with a scored maturity assessment, a defended path recommendation, and a cost reduction projection grounded in your actual failure history.
Why do most organizations overestimate their maintenance maturity level?
The primary cause is conflating tool ownership with process maturity. An organization may own a CMMS (suggesting Level 2 readiness) but have technician adoption below 50%, PM compliance below 60%, and reactive work above 40% — all Level 1 indicators. Similarly, installing vibration sensors suggests Level 3, but if sensor alerts go to email rather than generating automated CMMS work orders, the organization remains at Level 2 operationally. Industry research consistently shows 60–70% of organizations overestimate their maturity by 1–2 levels. The most reliable single indicator is reactive work percentage: if more than 20% of your work orders are emergency repairs, you are not yet at Level 2 regardless of what technology you own.
Can an organization skip maturity levels — for example, jump directly from Level 1 to Level 4?
No. Attempting to skip levels is the most common cause of failed PdM deployments. Predictive models (Level 4) require 12–18 months of structured failure history data, consistent CMMS adoption, and established sensor-to-work-order workflows that are built during Levels 2 and 3. Deploying AI predictive models in a Level 1 organization yields expensive disappointments — the models have no quality training data, the CMMS cannot consume their output, and the organization lacks the workflow discipline to act on predictions. The advancement path is sequential: each level builds the data infrastructure, process maturity, and organizational capability required for the next. iFactory's deployment paths are designed to accelerate but not skip this progression.
How long does it take to advance from one maturity level to the next?
Timelines vary based on organizational readiness, but industry benchmarks provide reliable ranges. Level 1 to Level 2: 6–12 months with dedicated CMMS implementation and PM discipline. Level 2 to Level 3: 12–24 months including sensor deployment, workflow automation, and change management. Level 3 to Level 4: 24–36 months requiring data infrastructure, 12–18 months of failure history accumulation, and model training maturation. Level 4 to Level 5: 36–48 months as organizational trust in AI-driven decisions builds. However, structured programs with dedicated resources and proven platforms can accelerate this: iFactory's Path A delivers foundational maturity improvement in 6–8 weeks, Path B transitions condition-based to predictive in 8–12 weeks, and Path C achieves full transformation in 12–16 weeks — each representing one full level of advancement on the targeted capability dimensions.
Does advancing maturity require replacing our existing CMMS, sensors, or ERP system?
No. iFactory AI's platform is designed as an intelligence layer that integrates with existing infrastructure rather than replacing it. Your current CMMS work order engine, parts inventory system, ERP financial integration, and installed sensor hardware continue operating as designed. What changes is the data ingestion density (continuous telemetry replacing periodic collection), the pattern recognition capability (AI models replacing manual analysis), and the workflow automation (automatic work order generation replacing email notification). The Keep / Retire / Transform / Replace decision matrix applied during the maturity assessment identifies which components to preserve, which manual processes to retire, which workflows to transform with AI augmentation, and which legacy notification layers to replace. The vast majority of existing infrastructure falls into the Keep or Transform categories.
What is the single most important metric for measuring maintenance maturity improvement?
The most reliable leading indicator is the ratio of planned to reactive work. A Level 1 organization operates at 60–80%+ reactive. Level 2 achieves 50–70% planned work. Level 3 reaches 80%+ planned. Level 4 exceeds 95% planned with less than 5–10% reactive. Level 5 operates below 5% reactive. This single metric correlates strongly with every other maturity benchmark — maintenance cost per operating hour, asset life, unplanned downtime, schedule compliance, and PM compliance. iFactory's Shift Logbook provides real-time visibility into this ratio across your entire asset fleet, enabling reliability teams to track maturity advancement week over week rather than waiting for annual assessment cycles.