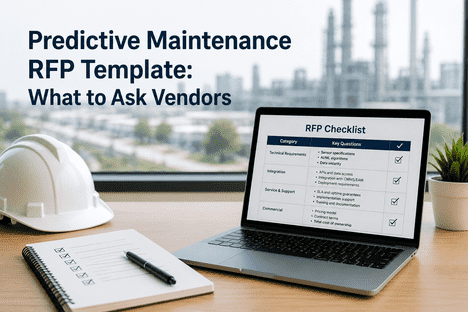
Every plant manager evaluating AI predictive maintenance faces the same dilemma: the potential ROI is compelling — 20–30% reduction in unplanned downtime, 25% fewer scrap parts, $50K+ avoided per catastrophic failure — but committing to an enterprise-wide deployment before proving the technology on your actual machines, with your actual operators, against your actual failure modes carries unacceptable risk. The solution is a structured 6-week pilot programme: 10–15 critical assets, one failure mode, a single NVIDIA edge server, and a clear go/no-go decision gate at week 6. iFactory's predictive maintenance platform fuses IoT vibration sensors, temperature probes, motor current signature analysis, and equipment telemetry into machine learning models that forecast equipment failure 2–3 weeks in advance. Book a Demo to see how iFactory's 6-week pilot programme de-risks your AI predictive maintenance investment before you scale to enterprise deployment.
Predictive Maintenance · Pilot Programme 2026
AI Predictive Maintenance Pilot: Start with 6 Weeks and Scale from There
Begin with 10–15 critical assets and one failure mode. Validate detection accuracy, measure avoided downtime, and build the business case for enterprise deployment — all in 6 weeks.
◉
Week 1–2
Asset selection · sensor deployment · data ingestion
▤
Week 3–4
Model calibration · shadow mode predictions
◈
Week 5
Accuracy validation · operator feedback integration
⟐
Week 6
Go/no-go decision · enterprise scale-up roadmap
Why a 6-Week Pilot Beats a 12-Month Enterprise Commitment
The industrial AI landscape is littered with enterprise-wide predictive maintenance programmes that spent 12–18 months in deployment, integration, and model tuning before delivering measurable value — and many never delivered at all. The root cause is rarely the AI technology. It is almost always scope: too many assets, too many failure modes, too many data sources integrated simultaneously, and too many stakeholder expectations to align before the first prediction alert reaches a maintenance team. A 6-week pilot inverts this approach. By constraining scope to 10–15 critical assets and a single failure mode — typically the highest-impact failure category on your maintenance dashboard — the pilot team focuses on proving three things: that the AI model detects the target failure mode with acceptable accuracy, that the prediction lead time is sufficient for planned intervention, and that operators trust and act on the alerts. Everything else — additional asset classes, failure modes, data sources, and stakeholder groups — expands from the proven foundation.
WHY PILOTS SUCCEED WHERE ENTERPRISE ROLLOUTS STALL
1
Focused scope wins — 10–15 assets, one failure mode. The team proves detection accuracy and operator trust before spending capital on enterprise licensing, full sensor coverage, and multi-site rollout
2
Real data, not synthetic — predictions are validated against your actual machine operating conditions, maintenance history, and failure events — not vendor demo data or industry benchmarks
3
Operator-led adoption — the pilot team includes the maintenance technicians who will use the system daily. Their feedback shapes alert thresholds, Shift Logbook workflows, and intervention procedures before scale-up
4
Data-driven business case — avoided downtime hours, prevented failure costs, and operator adoption metrics from the pilot feed directly into the enterprise deployment ROI model — no estimates, no assumptions
The 6-Week Pilot Framework — Week by Week
01
Week 1–2: Asset Selection and Sensor Deployment
The pilot begins with a structured asset selection workshop. The iFactory deployment team works with your maintenance and reliability engineers to identify 10–15 critical assets where unplanned failure carries the highest production, safety, or maintenance cost impact. The selection prioritises assets with existing sensor coverage (vibration, temperature, current) to minimise new hardware installation. For assets without sensors, wireless MEMS accelerometer kits are installed during a scheduled lubrication or inspection service. By the end of week 2, all pilot assets are streaming telemetry into the iFactory platform with Shift Logbook access configured for the maintenance team.
Asset selection workshopSensor auditTelemetry ingestion live
02
Week 3–4: Model Calibration and Shadow Mode
During weeks 3 and 4, iFactory's AI models ingest live sensor data and calibrate to your specific machine operating conditions — vibration baselines, temperature profiles, load cycles, and operating speed ranges. Predictions run in shadow mode: the model generates bearing health scores, fault classifications, and remaining useful life estimates, but no alerts are surfaced to the maintenance team. This allows the iFactory data science team to validate prediction accuracy against actual maintenance events and equipment history without overwhelming operators with unvalidated alerts. False positive rates are tuned during this phase.
Book a Demo to see how iFactory's shadow mode calibration works in practice.
Model calibrationFalse positive tuningShadow mode validation
03
Week 5: Accuracy Validation and Operator Feedback
Week 5 transitions from shadow mode to live operator review. Predicted failures — with confidence scores, sensor evidence, and recommended intervention windows — are surfaced to the maintenance team through the Shift Logbook. Operators follow a structured verification workflow: review dashboard evidence, perform physical inspection, confirm or override the prediction. Every override becomes a model training signal. By the end of week 5, the team has clear accuracy metrics — detection rate, false positive rate, average prediction lead time — measured against actual maintenance findings on the pilot asset set.
Operator verificationAccuracy measurementModel improvement loop
04
Week 6: Go/No-Go Decision and Scale-Up Roadmap
The final week delivers a structured go/no-go report: measured prediction accuracy on pilot assets, avoided downtime hours and cost, operator adoption metrics (alert response rate, verification completion rate, override ratio), and a scaled enterprise deployment roadmap with phased asset group expansion, additional failure mode coverage, and projected ROI across the full equipment fleet. The decision is driven by pilot data, not vendor promises. Plants that achieve target accuracy and operator adoption thresholds proceed to enterprise deployment. Plants that need additional calibration can extend the pilot by 2–4 weeks on the same asset set.
Go/no-go reportEnterprise roadmapROI projection
What the Pilot Measures — and What It Proves
A well-designed pilot programme produces measurable outputs that directly inform the enterprise deployment business case. These metrics are tracked weekly during the pilot and consolidated in the week 6 go/no-go report.
Detection Accuracy
True positive rate against confirmed maintenance events on pilot assets
≥70% accuracy on target failure mode
Validates AI model reliability for your specific equipment types and operating conditions
Prediction Lead Time
Days between first prediction alert and functional failure or maintenance intervention
≥14 days average lead time
Confirms sufficient window for planned intervention — weekend or low-demand scheduling
False Positive Rate
Percentage of predictions not confirmed by operator inspection or maintenance event
≤20% false positive rate
Ensures operator trust — alerts that require attention without overwhelming the team
Operator Response Rate
Percentage of high-confidence predictions receiving operator review within 24 hours
≥80% response rate by week 5
Demonstrates operator adoption and alert actionability — essential for enterprise scaling
Avoided Downtime
Hours of production downtime avoided through planned intervention vs historical failure data
Measured in pilot; projected across fleet
Direct cost avoidance that funds the enterprise deployment business case
Three Pilot Paths — Choose the Right Starting Point
iFactory offers three structured pilot paths differentiated by asset count, failure mode coverage, and deployment timeline. All three paths follow the same 6-week framework and produce the same go/no-go deliverables. The right path depends on your plant's equipment criticality profile, existing sensor coverage, and organisational readiness for AI adoption.
The entry-level pilot: 10 critical rotating assets (pumps, motors, compressors, fans) with a single target failure mode — typically bearing degradation. Existing accelerometers reused where available; wireless MEMS kits installed where not. Single NVIDIA edge server. Shadow mode weeks 3–4. Operator review week 5. Go/no-go week 6. Best fit: plants with limited sensor infrastructure and a clear highest-impact failure mode on their maintenance dashboard.
Assets10 critical rotating machines
InvestmentSingle edge server, minimal sensors
Talk to an Expert
The standard pilot: 15 critical assets spanning two failure mode categories — bearing degradation across rotating equipment plus a second mode such as tool wear, imbalance, or misalignment. Existing sensor infrastructure supplemented with additional accelerometer and temperature probe installations. Standard NVIDIA edge server. Best fit: plants with moderate sensor coverage and reliability teams ready to validate AI across multiple failure modes in a single pilot cycle.
Assets15 assets, two failure modes
InvestmentEdge server + supplemental sensors
Talk to an Expert
The comprehensive pilot: 15 critical assets across three or more failure modes with full sensor coverage (accelerometers, temperature, motor current, acoustic emission). Includes fleet-wide degradation baseline across all assets of the same class — not just the 15 pilot machines — to identify additional failure risks outside the pilot scope. Higher-capacity NVIDIA edge server for concurrent model inference. Best fit: large plants with multiple equipment classes and existing condition monitoring programmes ready for AI augmentation.
Assets15 pilot + fleet-wide baseline
InvestmentFull sensor coverage, higher-capacity server
Talk to an Expert
What iFactory Delivers in a 6-Week Pilot
6 wk
From order to go/no-go decision
Week 1–2: asset selection and sensor deployment. Week 3–4: model calibration. Week 5: operator validation. Week 6: decision.
10–15
Critical assets under AI prediction
Focused on your highest-impact failure modes — bearing degradation, tool wear, imbalance, misalignment
70%+
Prediction accuracy target
Measured against confirmed maintenance events on your specific equipment and operating conditions
1
NVIDIA edge server included
Turnkey pilot — server, sensors, software, and deployment engineer included in pilot package
FAQ: AI Predictive Maintenance Pilot Programme
Start Your 6-Week AI Predictive Maintenance Pilot
Focused pilot on 10–15 critical assets with one failure mode. Start small, validate fast, and scale with confidence. One package includes the NVIDIA edge server, sensors, software, deployment engineer, and go/no-go decision report.
6-Week Pilot
10–15 Assets
Single Failure Mode
NVIDIA Edge Server
Shift Logbook