Thermal imaging inspection is one of the most effective non-destructive condition monitoring techniques for electrical and mechanical assets in industrial facilities. From high-voltage switchgear and motor control centres to rotating equipment bearings and refractory-lined vessels, infrared thermography detects thermal anomalies that signal developing faults — loose connections, overloaded circuits, failing bearings, insulation degradation, and refractory hot spots — before they escalate to arc flash events, unplanned outages, or catastrophic equipment failures. NFPA 70B and ISO 18434 standards mandate regular thermographic surveys as part of a comprehensive electrical and mechanical preventive maintenance programme. Without a standardised thermal imaging inspection checklist, technicians collect inconsistent data with varying emissivity settings, environmental conditions, and camera configurations — producing non-comparable thermal images that mask critical temperature trends. iFactory's Shift Logbook and CMMS platform integrates thermal inspection route definitions, camera configuration templates, emissivity reference tables, ambient condition logging, and automated report generation into a unified workflow that connects thermography data directly to asset reliability analytics and corrective work orders. Book a Demo to see how iFactory digitises your thermal imaging inspection programme and connects temperature data to predictive maintenance intelligence.
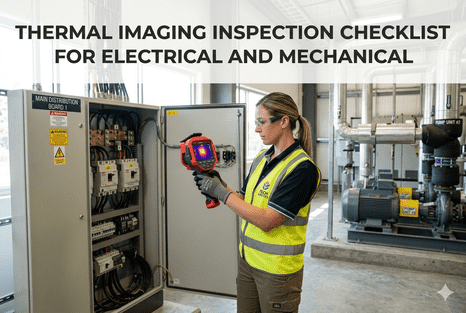
Standardised Thermal Imaging Inspections for Electrical and Mechanical Assets
Environmental condition logging · emissivity configuration · electrical panel scan protocol · mechanical equipment thermal survey · Severity classification per NFPA 70B · All integrated with iFactory Shift Logbook & CMMS.
Why a Standardised Thermal Imaging Checklist Is Essential for Reliable Inspections
Thermal imaging data is inherently sensitive to environmental conditions, surface properties, and camera configuration — factors that introduce measurement variability of 2–8°C even on the same target between consecutive inspections. A technician performing an electrical panel scan in the morning with 40% humidity and 22°C ambient temperature will record different absolute temperatures than an afternoon scan at 55% humidity and 30°C ambient, even if the electrical connection condition is unchanged. Without a standardised checklist that documents ambient temperature, relative humidity, distance to target, reflected apparent temperature, emissivity setting, and camera configuration at each inspection point, trend analysis becomes unreliable and severity classification loses its predictive value. NFPA 70B Annex O specifies the minimum documentation requirements for thermographic surveys, including the requirement to record load conditions at the time of inspection — a critical variable since a connection operating at 60% rated load will show a lower temperature rise than the same connection at 90% load, potentially masking a developing fault. iFactory's Shift Logbook captures all environmental and configuration parameters alongside each thermal image, with automated validation that flags missing or out-of-range documentation fields before the inspection is closed.
Environmental Condition Logging
Ambient temp · humidity · distance · reflected temp · wind speed
Emissivity & Background
Surface material reference · masking tape method · correction formula · painted target identification · background temp compensation
Electrical Scan Protocol
Load condition · panel access · arc flash PPE · connection-by-connection scan · delta-T calculation · NFPA 70B severity classification
Mechanical Thermal Survey
Bearing housing temp · motor winding temp · gearbox case · belt drive friction · refractory lining · insulation deficiency detection
Essential Components of a Thermal Imaging Inspection Checklist
A comprehensive thermal imaging inspection checklist must address five categories essential for reliable, repeatable, and auditable thermographic surveys of electrical and mechanical assets in industrial environments. Managers who have already booked a demo consistently report that standardising their thermal inspection documentation across all technician shifts is the single most impactful step in their condition monitoring programme modernisation. The following table maps each checklist category against the specific documentation requirements, quality criteria, and iFactory integration capabilities that ensure consistent thermal survey execution across electrical panels, motor control centres, switchgear, rotating machinery, and thermal process equipment.
| Checklist Category | Documentation Requirements | Quality Criteria | iFactory Integration |
|---|---|---|---|
| Pre-Inspection Setup | Camera warmed up · lens clean · battery charged · memory card formatted · calibration date verified | All items verified before first measurement | Shift Logbook pre-inspection checklist |
| Environmental Conditions | Ambient temp · relative humidity · distance to target · reflected apparent temp · wind speed · solar load | Logged per inspection route segment | Auto-logged with timestamp and GPS |
| Camera Configuration | Emissivity setting · reflected temp compensation · distance compensation · humidity compensation · temperature range span · focus verified · level/span optimised | Matched to target surface and environment | Template-based configuration per asset type |
| Electrical Panel Scan | Load condition (% rated) · panel ID · connection temp · delta-T from reference · NFPA 70B severity class · hot spot image · visual reference image | Delta-T > 3°C triggers investigation | Auto-severity classification · work order creation |
| Mechanical Equipment Scan | Bearing housing temp · motor winding temp · gearbox case temp · belt/pulley friction · coupler alignment · refractory lining temp · insulation surface temp | Compared against OEM limits and baseline | Trend chart · baseline comparison · alarm threshold |
Emissivity Settings and Surface Correction Techniques for Accurate Temperature Measurement
Emissivity is the single most critical parameter affecting thermal imaging measurement accuracy for electrical and mechanical inspections. A polished copper busbar in a switchgear panel has an emissivity of approximately 0.07 — meaning it reflects 93% of the infrared energy from the surrounding environment and emits only 7% of its own thermal radiation. If the technician leaves the camera at the default emissivity setting of 0.95 (typical for matte painted surfaces), the camera will drastically underestimate the busbar temperature, potentially missing a dangerous hot connection. The standardised checklist for thermaographic inspections must require technicians to identify the target surface material and set the appropriate emissivity value from a reference table. For low-emissivity targets such as bare copper, aluminium, or polished steel, the checklist should specify the use of masking tape (high-emissivity tape applied to the target surface) or a contact thermometer validation point adjacent to the IR measurement. iFactory's Shift Logbook stores emissivity reference tables for common electrical and mechanical surface materials — painted panels, bare copper, anodised aluminium, stainless steel, cast iron, rubber, insulation materials — and validates that the camera emissivity setting matches the documented target surface type before accepting the thermal image. Quality supervisors who book a demo consistently identify emissivity misconfiguration as their leading source of thermal inspection measurement error.
Identify Target Surface Material
Determine whether the target is painted metal, bare copper, aluminium, stainless steel, rubber, plastic, or insulation. Each material has a known emissivity range that must be set in the camera before measurement.
Apply Emissivity Correction Technique
For low-emissivity targets (ε < 0.5), apply high-emissivity masking tape or flat black paint to create a reference surface. For painted targets (ε ≈ 0.85–0.95), verify that the paint is not flaking or discoloured.
Set Camera Emissivity and Background Parameters
Configure camera emissivity to match the target surface. Set reflected apparent temperature by measuring a crumpled piece of aluminium foil at the target location. Input distance to target for atmospheric transmission correction.
Validate with Contact Measurement
Take a contact thermocouple or RTD measurement at a safe accessible point on the target. Compare the IR camera reading at the same location. If the difference exceeds 2°C, adjust camera parameters and re-measure before proceeding.
Document Emissivity and Validation in Shift Logbook
Record the emissivity setting, correction method used, reflected temperature, distance, and contact validation result in iFactory's Shift Logbook alongside the thermal image for full audit traceability.
The NFPA 70B standard for electrical equipment maintenance defines a four-level severity classification system for thermal anomalies detected during thermographic inspections of electrical connections and components. This classification, based on the temperature difference (delta-T) between a suspect connection and a similar reference connection under the same load conditions, determines the required response timeframe and corrective action. The Shift Logbook captures the delta-T measurement, applies the NFPA 70B severity classification automatically, and generates a colour-coded work order with the recommended response timeframe. Facilities that schedule a demo of iFactory's thermal inspection platform typically achieve a 60% reduction in the time from anomaly detection to corrective action completion through automated work order routing.
Automate Electrical Thermal Anomaly Classification with iFactory
Delta-T measurement · severity class assignment · colour-coded work order · response time routing · all integrated with Shift Logbook and CMMS for full audit trail from detection to corrective action completion.
The four severity classes defined by NFPA 70B are: Class 1 (delta-T 1–3°C) — minor temperature rise requiring monitoring. Class 2 (delta-T 4–15°C) — moderate temperature rise requiring corrective action during the next scheduled maintenance outage. Class 3 (delta-T 16–30°C) — significant temperature rise requiring immediate corrective action within 24–48 hours. Class 4 (delta-T greater than 30°C or greater than 40°C for high-current connections) — critical temperature rise requiring emergency shutdown and immediate corrective action for personnel safety and equipment protection.
Minor temperature rise. No immediate action required. Flag for monitoring during the next scheduled thermographic inspection cycle. Document in Shift Logbook for trend tracking.
Moderate temperature rise. Schedule corrective action during the next planned maintenance outage. iFactory generates a work order with priority classification and recommended corrective action.
Significant temperature rise. Corrective action required within 24–48 hours. Immediate notification to maintenance supervisor via Shift Logbook alert with thermal image attached.
Critical temperature rise. Emergency shutdown required. iFactory triggers immediate notification to electrical safety officer and generates emergency work order with isolation procedure checklist.
Delta-T severity thresholds are valid only when the electrical circuit is operating at 40% or greater of rated load. iFactory Shift Logbook records load % at time of inspection for each connection scanned.
Severity classification must account for ambient temperature variation between inspection rounds. iFactory applies correction factors automatically, ensuring consistent severity classification year-round.
Thermal Imaging Inspection Protocol for Mechanical Equipment
Thermal imaging of mechanical equipment — bearings, motors, gearboxes, belts, couplings, and refractory-lined vessels — follows a distinct protocol from electrical thermography due to the different failure modes and temperature characteristics. Mechanical thermal inspections focus on absolute temperature values relative to OEM limits, temperature rise above ambient, and thermal pattern recognition rather than the delta-T comparison method used for electrical connections. Bearing housing temperatures exceeding 80°C typically indicate lubrication failure, misalignment, or incipient bearing degradation. Motor winding temperatures above the Class F insulation limit (155°C) risk accelerated insulation ageing and stator winding failure. Gearbox case temperatures rising more than 20°C above the baseline established during commissioning indicate oil degradation, gear wear, or bearing distress. Refractory-lined vessels show hot spots on the external shell that indicate lining erosion, cracking, or material loss requiring immediate assessment. iFactory's Shift Logbook stores OEM temperature limits for each mechanical asset in the equipment register and automatically applies the appropriate threshold values when classifying thermal inspection results from mechanical equipment surveys.
Establish Mechanical Equipment Baseline Temperatures
Capture thermal images of all mechanical equipment — bearings, motor windings, gearbox cases, belt drives, refractory shells — immediately after installation or overhaul under steady-state operating conditions to establish the baseline thermal signature for each asset.
Configure Camera for Mechanical Targets
Set emissivity for mechanical surfaces: painted motor housings (ε=0.85–0.92), bare cast iron bearings (ε=0.81–0.89), aluminium gearbox cases (ε=0.10–0.20 with correction tape), rubber belts (ε=0.95), refractory (ε=0.70–0.85).
Document Operating Conditions
Record motor load current, shaft RPM, product temperature (for refractory vessels), and ambient temperature. Compare against baseline conditions and note any significant operational differences that could affect thermal readings.
Capture and Classify Thermal Data
Capture thermal images at each mechanical inspection point with full temperature data. Apply asset-specific alarm thresholds from the Shift Logbook equipment register. Classify findings as Normal, Monitor, Plan, or Immediate based on deviation from baseline.
Generate Inspection Report with Trend Analysis
iFactory automatically generates a thermal inspection report with all thermal images, temperature data, severity classifications, and trend charts comparing current readings against the full inspection history for each mechanical asset.
"Standardising our thermal imaging inspections with iFactory's Shift Logbook eliminated the data quality issues we had with our previous paper-based system. Our technicians now capture emissivity settings, ambient conditions, and load data with every image — and the automated NFPA 70B severity classification has reduced our anomaly-to-repair cycle time by 60%."
Common Gaps in Thermal Imaging Inspection Programmes
Most industrial facilities pursuing improvements to their thermographic inspection programmes encounter a predictable set of operational and documentation gaps. Understanding these gaps before deploying a thermal inspection platform dramatically improves implementation success and helps maintenance managers allocate inspection budgets more strategically across electrical and mechanical asset portfolios. Quality directors who book a demo early in their programme modernisation cycle consistently achieve faster inspection documentation standardisation and stronger regulatory outcomes.
Technicians routinely leave the camera at default emissivity settings without documenting the actual target surface emissivity, invalidating temperature accuracy and making trend comparison unreliable across inspection rounds.
Ambient temperature, humidity, and distance to target are not systematically recorded, making it impossible to distinguish genuine fault progression from seasonal measurement variation when comparing thermal images across inspection cycles.
Electrical connection temperatures are highly dependent on the circuit load at the time of inspection. Without recording load percentage, severity classification based on delta-T thresholds is invalid and potentially misleading.
Without automated severity classification, different technicians apply different judgment criteria to the same thermal anomaly, resulting in inconsistent prioritisation and delayed corrective action on critical findings.
Thermal inspection findings are stored separately from corrective work orders, making it impossible to track the complete lifecycle from anomaly detection through repair verification to baseline re-establishment.
Without a centralised thermal data repository with automated trend charting, slow-progressing thermal anomalies — such as gradual bearing degradation or insulation ageing — go undetected until they reach critical severity.
Integrating Thermal Imaging Data Into iFactory's Predictive Maintenance Platform
One of the most technically demanding aspects of thermographic inspection programme modernisation is the integration of thermal image data and temperature measurements into a unified asset reliability platform that connects inspection findings to predictive models, work order systems, and compliance documentation. iFactory provides the AI software intelligence layer that ingests thermal inspection data — thermal images in standard formats (JPEG, PNG, radiometric TIFF), temperature measurement tables from handheld thermal cameras and fixed thermal cameras, emissivity and environmental metadata — and maps each data point to the specific asset and inspection point in the equipment register. The Shift Logbook captures every thermal inspection event with full traceability to the technician, camera, configuration settings, and environmental conditions, enabling maintenance teams to track temperature trends over time and detect gradual degradation patterns that would be invisible in single-inspection snapshots. The platform's severity classification engine automatically applies NFPA 70B thresholds for electrical anomalies and asset-specific OEM limits for mechanical equipment, generating colour-coded work orders with the recommended corrective action and response timeframe.
Key iFactory Capabilities for Thermal Imaging Inspection Programmes
Pre-configured thermal inspection routes for electrical panels, switchgear, MCCs, motor bearings, gearboxes, and refractory vessels — with emissivity tables and camera configuration presets integrated.
NFPA 70B-compliant delta-T classification for electrical anomalies and asset-specific threshold comparison for mechanical equipment, with colour-coded dashboards and automated work order generation.
Automated trend charts comparing current temperature readings against full inspection history for each asset, with baseline comparison and early-warning alerts for slow-progressing thermal degradation patterns.
Every thermal image, temperature measurement, configuration parameter, environmental condition, and severity classification is stored with full traceability for NFPA 70B, ISO 18434, and regulatory compliance audits.
Standardise Your Thermal Imaging Inspection Programme Today
Deploy a unified thermal inspection platform that integrates standardised checklists, emissivity configuration, NFPA 70B severity classification, mechanical equipment thermal surveys, and automated trend analytics — built specifically for industrial electrical and mechanical asset reliability programmes.
Thermal Imaging Inspection Checklist — Common Questions Answered
What is the minimum thermal camera specification required for an NFPA 70B-compliant electrical inspection programme?
NFPA 70B recommends a thermal camera with a minimum detector resolution of 160×120 pixels (320×240 recommended for critical infrastructure), thermal sensitivity (NETD) of 0.10°C or better, temperature range covering at least -20°C to 350°C, interchangeable lenses (standard 24° plus optional 12° telephoto for live-front switchgear), and radiometric image capture capability that stores full temperature data for each pixel. The camera should have current calibration certification traceable to NIST or equivalent standards, with recalibration intervals not exceeding two years.
How does ambient temperature and humidity affect thermal imaging measurement accuracy for electrical connections?
Ambient temperature affects the camera's internal reference and the thermal contrast between the target and background. Relative humidity above 60% begins to attenuate infrared transmission through the atmosphere, particularly at longer distances and in the long-wave IR band (8–14 µm). For indoor electrical inspections at typical distances of 1–3 metres, the humidity effect is usually minimal (less than 0.5°C error), but for outdoor substation inspections at distances exceeding 10 metres, humidity compensation is essential. iFactory's inspection checklist template includes environment logging fields that enable the platform to apply correction factors automatically when comparing inspection results across different ambient conditions.
Can iFactory store radiometric thermal image data for trend analysis, or only JPEG snapshots?
iFactory's Shift Logbook stores both radiometric thermal image data (in native camera format and as exportable CSV temperature matrices) and visual-reference JPEG images alongside the inspection metadata. The platform extracts temperature data from radiometric images to populate automated trend charts, severity classification, and baseline comparison reports. For cameras that do not support radiometric image export, technicians can record spot temperature measurements at defined inspection points using the Shift Logbook's mobile interface, with manual entry of minimum, maximum, and average temperature values for each target area.
How often should thermal imaging inspections be performed on electrical panels and mechanical equipment?
NFPA 70B recommends annual thermographic inspections for electrical distribution equipment under normal operating conditions, with quarterly or monthly inspections for critical circuits, high-load connections, and equipment with a history of thermal anomalies. Mechanical equipment inspection frequency depends on criticality and operating hours: continuously operating critical motors and bearings should be inspected quarterly; standby equipment and non-critical mechanical assets can be inspected annually. iFactory's Shift Logbook manages inspection scheduling with automated task assignment to certified thermographers, real-time route completion tracking, and escalation of overdue inspections to maintenance supervision.
Do I need a certified thermographer to perform thermal inspections, or can maintenance technicians be trained in-house?
NFPA 70B requires that personnel performing thermographic inspections be trained and certified to a recognised standard such as ASNT SNT-TC-1A Level I or II in infrared thermography, or equivalent ISO 18436-1 Category I or II certification. In-house training can provide basic operational capability, but formal certification ensures the technician understands emissivity correction, reflected temperature compensation, atmospheric attenuation, and the thermal dynamics of electrical connections and mechanical components. iFactory's Shift Logbook can store technician certification records and validate that only certified personnel are assigned to formal inspection routes.
Can the platform integrate thermal images from multiple camera brands into a single inspection report?
Yes. iFactory's Shift Logbook supports thermal image import from all major camera manufacturers including FLIR, Fluke, Testo, Hikmicro, Guide, and InfiRay. The platform extracts radiometric data from supported file formats (FCF, IRB, IRT, JPG with embedded radiometric data) or accepts manual temperature readings for non-radiometric cameras. Inspection reports combine thermal images, visual reference images, temperature data tables, severity classifications, trend charts, and corrective work order status into a single auditable document format.