A cement plant's worst maintenance event is rarely a surprise — in hindsight. The kiln main bearing temperature trended upward for three weeks. The VRM gearbox vibration spectrum showed a developing tooth fault for eleven days. The ID fan imbalance was detectable in the FFT signature for a month before the blade separated. The data was there. The model was not. iFactory changes that — see it on your plant data.
Know What Fails Next — 30 to 90 Days Ahead
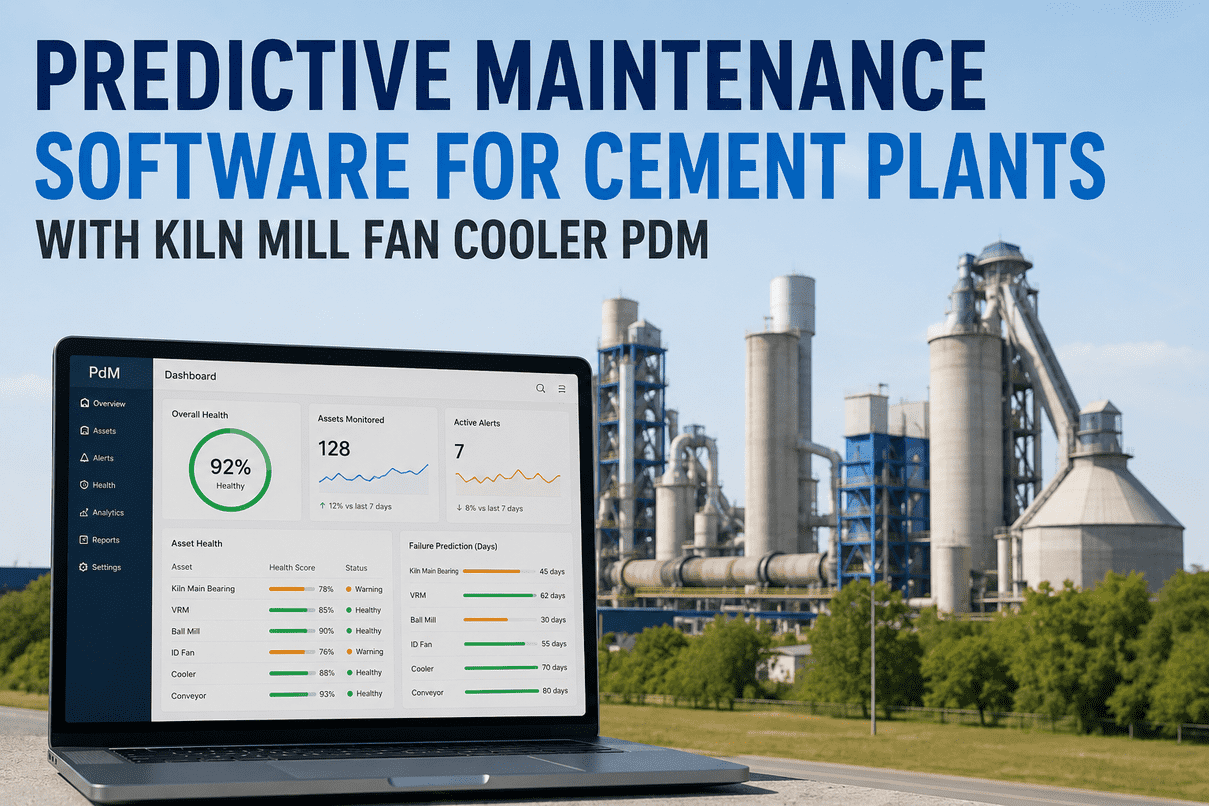
Multi-sensor fusion + LSTM + FFT running on an NVIDIA RTX Pro 6000 Blackwell on-site appliance. Six critical asset classes monitored continuously. Every alert summarised in plain language by an LLM — failure mode, time horizon, recommended action — and handed off directly to SAP PM or your CMMS as a work order.
Six Asset Classes. One Failure Any of Them Can Halt the Line.
Each asset class in a cement plant has distinct failure modes, distinct sensor signatures, and a distinct cost consequence when it goes down unplanned. iFactory monitors all six with models built for each — not a generic vibration threshold applied everywhere.
One Signal Is Not Enough. The Failure Is in the Pattern Across All of Them.
A bearing temperature rising 4°C over three weeks is ambiguous — it could be load, ambient, lubrication, or degradation. Add the vibration FFT showing a growing 1× and 2× sideband around the ball-pass frequency, and the oil particle count trending upward, and the ambiguity is gone. Multi-sensor fusion is what separates a prediction from a false alarm.
Raw vibration waveforms are transformed into frequency spectra on the edge appliance. Bearing defect frequencies (BPFO, BPFI, BSF, FTF), gear mesh frequencies, and their harmonics are extracted per sensor per asset — every sweep.
Long Short-Term Memory networks model how each frequency component — and each sensor channel — evolves over time. The LSTM learns the degradation trajectory specific to your equipment, your load conditions, and your operating envelope. Not a generic threshold. Your machine's pattern.
Outputs from all sensor streams are fused using a probabilistic model that weights each signal by its historical reliability for the specific failure mode. Vibration and oil analysis together carry far more weight for gear tooth fatigue than either alone. Confidence scores reflect the evidence stack, not just a single channel.
The fused output is passed to an on-device LLM that writes a one-paragraph alert in the language of your technician — failure mode, confidence, estimated time horizon, and the specific action recommended. No data science required to act on it.
From Sensor Signal to Work Order — in Under 60 Seconds
This is a representative alert as it appears in the iFactory dashboard and in the SAP PM work order it generates. The technician receives the full picture — see a live walkthrough with your asset data.
The drive-side main bearing shows progressive outer race defect development. BPFO amplitude at 147 Hz has increased 340% over the past 22 days — consistent with early spall initiation. Oil particle count (ISO 4406 Class 18/16/13) has risen in parallel over the same window. Temperature trend is currently within normal range, which is typical for this failure mode at this stage. Estimated useful life remaining: 18–26 days at current load. Recommended action: schedule bearing replacement during the next planned 48-hour maintenance window. Order part number KMB-DS-4432. Do not defer beyond 14 days without re-evaluation.
30–50% Downtime Cut. $1.5–3M Saved Per Kiln Line Per Year.
The numbers are not projections — they are the consequence of catching two or three major failure events per year that would otherwise have been unplanned. At $75K per hour of kiln downtime, the arithmetic is straightforward.
Prediction Is Only Useful If It Becomes a Work Order
Every iFactory alert that crosses the confidence threshold auto-generates a structured work order in SAP PM, OxMaint, or your CMMS of choice — with failure mode, RUL estimate, recommended parts, and the full sensor evidence package attached. Your maintenance team acts on a work order, not a dashboard notification they might miss.
Model confidence crosses threshold. Severity assigned: CRITICAL / HIGH / MEDIUM.
On-device LLM writes failure mode, estimated RUL, and recommended action in plain language — one paragraph, readable in 15 seconds.
SAP PM notification + order generated via REST API or message queue. Functional location, equipment ID, failure code, priority, and estimated labour populated automatically.
Where part numbers are mapped in the CMMS material master, a purchase requisition is auto-raised with the predicted lead time — so parts arrive before the repair window, not during it.
Post-repair findings logged against the prediction. Confirmation or deviation feeds back into model retraining — accuracy improves with every event, on your plant's data.
Turnkey. On-Site. Live in 6 Weeks.
iFactory ships a pre-configured NVIDIA RTX Pro 6000 Blackwell appliance with all models pre-loaded. Our field team installs sensors, runs cabling, connects to your DCS historian and CMMS, trains your operators, and activates 24/7 remote monitoring — all within a 6-week pilot. You evaluate the detections on your actual equipment before committing to full deployment.
Appliance delivered globally. Field tech on-site for sensor mounting on all monitored assets, cabling, network configuration, and DCS historian connection. No production shutdown required.
Models learn your equipment's healthy baseline. Asset-specific LSTM models calibrated to your operating conditions. First detection pilot begins — all alerts reviewed with your maintenance team.
Full production mode. SAP PM / CMMS integration activated. Operator and maintenance team training delivered on-site. 24/7 remote monitoring by iFactory from day one of go-live.
What Maintenance Managers Ask Before Sign-Off
In the first two weeks of pilot, more than after. The models run in a validation mode — every alert is reviewed with your team and used to tune sensitivity. By week four, false alarm rates are typically below 5% on the assets with stable operating patterns.
Yes. iFactory supplies and installs wireless vibration, temperature, and oil sensors as part of the turnkey package. No dependency on your existing sensor infrastructure — though if you have historian data, we use it to accelerate baseline training.
Yes — via REST API or message queue (Apache Kafka, IBM MQ). We map your functional location hierarchy, equipment IDs, failure codes, and material master during the installation phase. Work orders are generated in your SAP environment, not ours.
No. The fully-loaded NVIDIA RTX Pro 6000 Blackwell appliance ships as part of the turnkey package — racked, pre-configured, all models pre-loaded. You provide line power and Ethernet. Our field team handles all installation and commissioning on-site.
See What Will Fail on Your Plant — Before It Does
Bring 90 days of your DCS historian data and a list of your critical rotating assets. In one working session, our team runs your data through the iFactory model stack and shows you the failure signatures it would have flagged — on your kiln, your mills, your fans. No commitment. No slides. Your data, our models, real output.