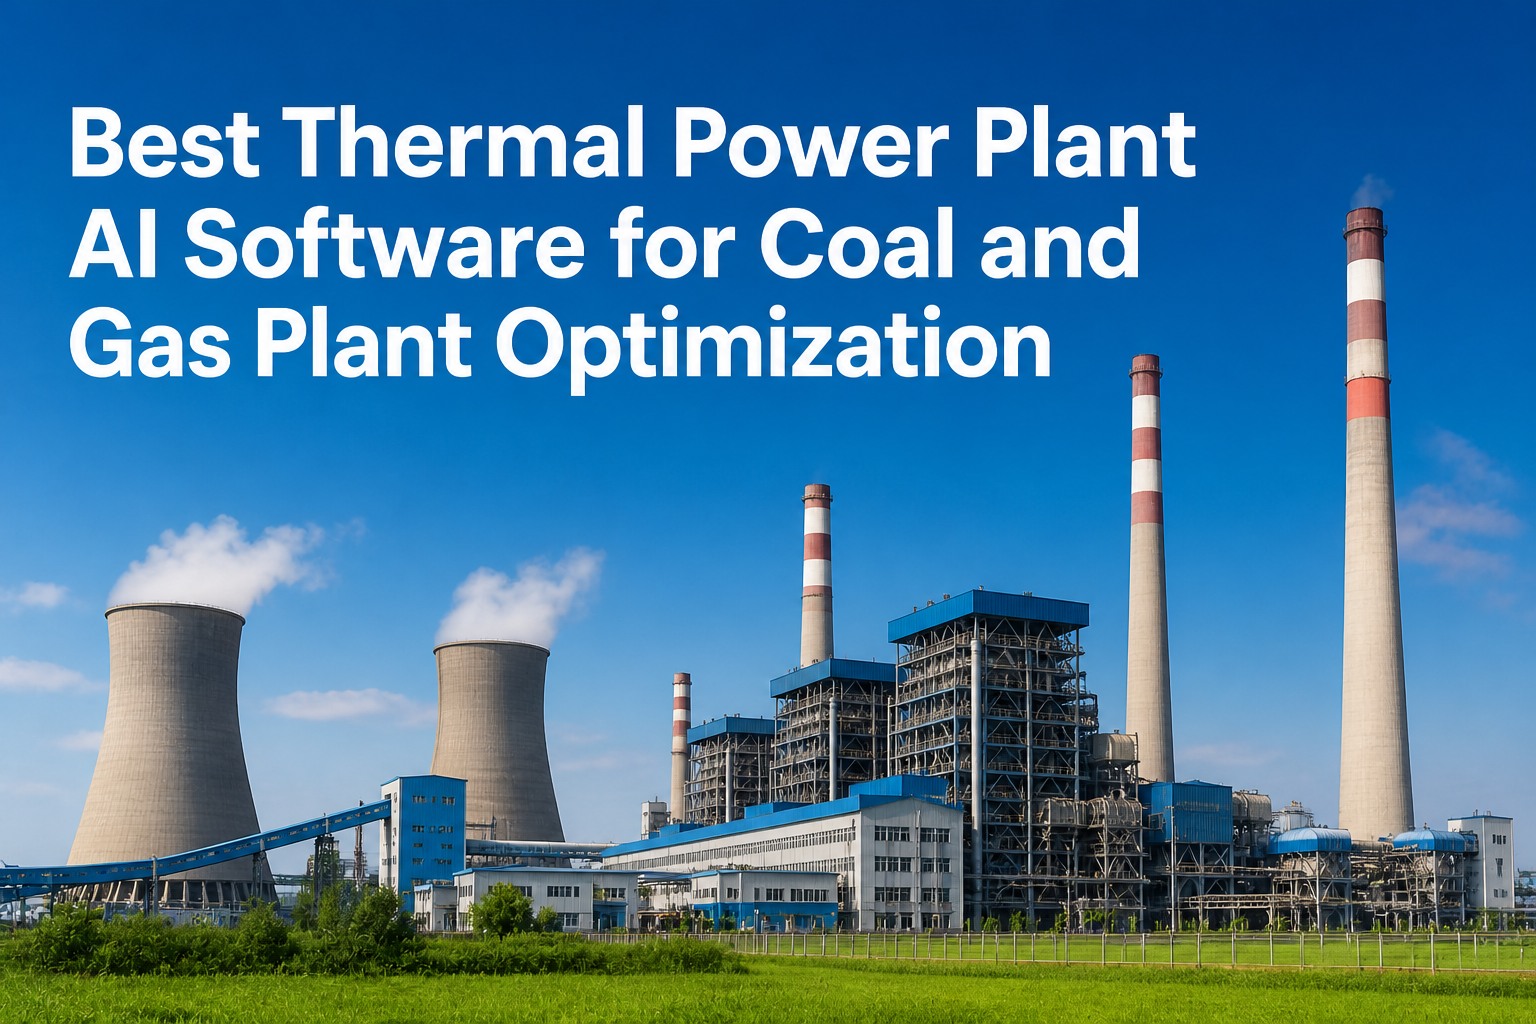
Thermal power plants—coal-fired, gas-turbine, and combined-cycle—still produce roughly 60% of the world's electricity in 2026. They also operate under tighter emission caps, more volatile fuel quality, and faster load-cycling than any time in their history. Static control logic and calendar-based maintenance can no longer hold the line on heat rate, NOx, slagging, or turbine reliability. The plants pulling ahead are running production-grade AI models on every layer of the thermal cycle: coal yard, boiler, turbine, condenser, and stack. This guide breaks down what "thermal power plant AI software" looks like in 2026, what it controls, and the GPU infrastructure that makes sub-second inference on a 660 MW supercritical unit possible.
Upcoming iFactory Ai Live Webinar:
Building Thermal Power Plant AI Architecture
Join the iFactory team for a live webinar on architecting AI software for coal-fired and gas-turbine plants. Walk through GB300 + Jetson reference stacks, boiler-turbine-condenser models, and the emission soft-sensor pattern—built on 1,000+ enterprise implementations.
Where AI Earns Its Keep — Layer by Layer
A thermal power plant is not one optimization problem. It is five tightly coupled ones, each with its own sensors, time constants, and failure modes. The right AI software treats them as a system. Book a 30-minute call with our plant engineers to map which layers deserve the first instrumentation budget on your unit.
GCV variability, blend ratios, moisture, stockpile rotation. AI predicts incoming consignment impact before coal hits the mill.
Combustion air staging, burner tilt, mill biasing, secondary air dampers. The largest efficiency lever in the plant.
Cylinder efficiency, blade fouling, bearing vibration, rotor eccentricity. Predictive maintenance lives here.
Backpressure rise, biofouling, ACC fan optimization. A 10 mbar drift can cost 30 kcal/kWh.
NOx, SOx, particulates, mercury. The model predicts SCR/FGD outlet before the CEMS catches it.
Four Pressures Forcing Thermal Plants to Adopt AI
If you operate a thermal plant in 2026, you are not adopting AI for novelty. You are adopting it because at least one of these pressures is showing up on your monthly P&L.
Boilers now operate at 40–50% load far more often. At ultra-low loads, combustion atmosphere worsens, heat transfer drops, and SCR inlet NOx spikes. Static control logic was never tuned for this regime.
Mercury, NOx, and PM2.5 limits keep dropping. Plants need real-time soft sensors that predict stack concentrations before the CEMS reading—not after the violation has already occurred.
Imported, domestic, and washery blends arrive with wildly different GCV, ash, and sulphur. Without AI-driven blend optimization, plants over-burn, slag, and pay more for the same MW.
The senior operators who could "feel" a boiler are retiring. AI captures their decision patterns from years of DCS history—turning tribal knowledge into a model that runs at 3 AM.
The Three AI Models Every Thermal Stack Needs
Every credible thermal AI software in 2026 is built around three predictive cores. Get all three working together and you have a heat rate optimizer. Get only one and you have a dashboard.
Trains on 2+ years of DCS history. Predicts thermal efficiency and NOx as a coupled output, then a PPO agent searches for setpoints that maximize efficiency under the NOx ceiling. Real deployments report 0.5–2% heat rate gain and 10–15% NOx cut.
Vibration spectra at 20 kHz from journal and thrust bearings, fed into CNN-spectral classifiers and GNN models. Detects bearing wear, blade fouling, and rotor eccentricity 4–16 weeks ahead of failure.
Predicts SCR-outlet NOx in real time, then closes the loop on ammonia dosing to keep emission within limit at minimum reagent cost. On 1000 MW units, prediction error stays under 5%.
The Five Levers Where AI Recovers the Most Heat Rate
Plants typically operate 200–600 kcal/kWh above design heat rate. Most of that gap is recoverable. Schedule a 30-minute heat rate audit and we'll rank your levers in order of expected recovery.
Excess air, fuel-air ratio, burner tilts, secondary air. The single largest recoverable lever in any thermal plant.
HP/IP blade fouling, condenser backpressure rise, feedwater heater performance. AI tracks degradation and recommends cleaning windows.
BFP, ID/FD fans, cooling water pumps. Setpoint drift and progressive wear silently consume MW. AI flags pumps running 8–15% above optimal.
Boiler tube deposits, condenser tube biofouling, air pre-heater plugging. Often undetected until significant loss has accumulated.
Valve sequencing, off-design ramping. Especially acute for plants on renewable-driven dispatch. AI re-tunes per load band.
The GB300 + Jetson Edge Reference Stack
Sub-50 ms turbine vibration inference is what separates a plant that catches a bearing failure on Tuesday from one that has a forced outage on Friday.
Traditional DCS vs Thermal AI Software
If your plant runs on DCS-only logic, you are leaving 0.5–2.0% heat rate, 10–15% NH3, and 4–16 weeks of failure lead time on the table.
| Capability | Traditional DCS / SCADA | Thermal AI Software (2026) |
|---|---|---|
| Combustion Tuning | Static PID, periodic manual | RL-PPO agent, continuous online |
| NOx Prediction | CEMS only, 30–90 s delay | DNN soft sensor, <5% error, 1-min ahead |
| Turbine Failure Lead | Alarm at threshold breach | 4–16 weeks via vibration spectra |
| Coal Quality Adaptation | Operator judgement, lab GCV | Vision + ML, real-time per rake |
| Heat Rate Recovery | Periodic 6–12 month audits | 0.5–2% continuous, retrains nightly |
| Cycling Performance | Tuned for base-load | Per-load-band setpoints, online |
| Operator Knowledge | Lost when staff retire | Captured in model weights, persists |
The 12-Week Production Cycle for a 660 MW Unit
A thermal AI deployment is not a six-month research project. The pattern below is what we run on a typical 500–800 MW supercritical unit.
What Plant Operators Actually Ask
These come up in every thermal AI scoping call. Ask them directly to our support team for a tailored answer.
No. Modern thermal AI integrates through PI Historian, OPC-UA, or direct DCS APIs. ABB, Emerson, Siemens, Yokogawa—all supported.
Most plants see measurable improvement within 4–8 weeks of closed-loop activation. The model needs that time to learn boiler characteristics across the load envelope.
No. All setpoint moves are constrained by hard physical limits and a safety envelope set by your operating engineer.
No. The reference deployment runs entirely on-prem on a GB300 node inside your plant network.
Why Operators Choose iFactory Over Generic Integrators
Reading whitepapers and shipping production AI on a 660 MW supercritical unit are different problems. We arrive with a validated stack, plant-floor engineers, and pre-built thermal connectors. Book a thermal architecture walkthrough and see the patterns running on real plants today.
Get a Heat Rate Audit + Turbine Risk Score for Your Unit
Thirty minutes with our thermal AI engineers. Bring your unit type, fuel mix, and one month of PI Historian samples. We'll identify which heat rate levers are worth the most on your specific plant—and give you a concrete 12-week deployment path.