A mid-sized packaging and converting facility producing over 180 million units annually across three high-speed packaging lines faced a chronic bottleneck problem rooted in fragmented shift communication and zero cross-shift visibility into equipment performance trends. Paper-based shift logbooks, inconsistent handover documentation, and reactive maintenance cycles were allowing bottleneck patterns to develop undetected across successive shifts — generating an average of 9.5 hours of bottleneck-related downtime per week. This translated into a baseline OEE of approximately 76% and annual production losses exceeding $420,000. After deploying iFactory's digital shift logbook platform with structured shift data capture and bottleneck analytics, the facility reduced bottleneck downtime by 84%, raised OEE by 17 percentage points, and cut annual operational losses by $312,000. Book a Demo with iFactory's shift logbook team to learn how structured shift data prevents operational bottlenecks.
TURN SHIFT DATA INTO A BOTTLENECK PREVENTION ENGINE
Stop Losing Production Throughput Between Shifts. Start Preventing Bottlenecks in Real Time.
iFactory's digital shift logbook platform gives packaging and converting operations structured shift data capture, cross-shift bottleneck trend visibility, and analytics that turn every shift report into an actionable signal — before throughput degrades.
93%
Equipment Uptime Achieved
$312K
Annual Operational Savings
55
Days to Full Deployment
01 / The Facility
A High-Throughput Packaging Operation, A Bottleneck Crisis Hidden in Paper Shift Logs
Facility TypeMid-size packaging and converting facility producing flexible packaging, cartons, and labels for food, beverage, and consumer goods markets. Three high-speed packaging lines including two rotogravure printing/packaging lines and one flexographic line with downstream bagging, cartoning, and palletizing stations.
Scale180+ million units annually. 45+ active SKUs. Three-shift production schedule, five days per week, with weekend overtime runs during peak seasonal demand. 62 production operators across all shifts.
Shift Handover MethodPaper-based shift logbooks with free-text entries. No structured data capture. No standardised handover template. Shift-to-shift information transfer reliant on the outgoing shift lead locating the incoming lead before leaving shift. Approximately 40% of equipment events and bottleneck indicators logged inconsistently or not captured across shift boundaries.
OEE Pre-DeploymentBaseline OEE of approximately 76%. Bottleneck-related downtime averaging 9.5 hours per week. Three to four bottleneck events per week, with each event causing 2–4 hours of cascading throughput loss across downstream stations. Print registration drift on the rotogravure line accounted for 38% of bottleneck events.
Prior Reporting SystemPaper shift log sheets maintained in binders at each production line. Weekly supervisor reviews occurring 3–6 days after events. No data aggregation across shifts. No bottleneck trend analysis. Management visibility limited to after-the-fact verbal escalation during morning standup meetings.
Annual Operational LossPre-deployment operational losses estimated at $420,000 annually — including unplanned downtime labour, expedited changeover costs, material waste from rejected output during bottleneck recovery, and missed delivery windows caused by throughput shortfalls accumulated across successive shifts without detection or escalation.
02 / The Challenge
Paper Shift Logs, Silent Bottleneck Build-Up, and the Compounding Cost of Undetected Throughput Erosion
Packaging line bottlenecks rarely appear suddenly. They develop over successive shifts — a subtle print registration drift on first shift, a slightly slower changeover on second shift, a web tension variation on third shift that goes unnoticed until the morning supervisor sees the previous night's throughput numbers. With paper shift logs and unstructured handovers, that progression was invisible. The operator who first detected the registration drift on day shift documented it in a free-text log entry that the second shift operator never reviewed because the binder was at the line supervisor's desk rather than on the production floor. The second shift experienced the same drift but attributed it to a different cause. The third shift faced a full bottleneck event with no prior shift context. This pattern of fragmented, unstructured, and inaccessible shift data was the root cause of the facility's chronic OEE underperformance and recurring bottleneck events.
9.5
Bottleneck downtime hours per week
Weekly bottleneck-related downtime averaging 9.5 hours across the two rotogravure lines and flexographic line — consuming approximately 494 annual production hours and generating direct throughput losses estimated at $420,000 per year. The majority of these bottleneck events had detectable early-stage signatures that appeared in shift logs but were never aggregated or correlated across shift boundaries.
38%
Of bottlenecks from print registration drift
Print registration drift on the rotogravure lines was the single largest bottleneck driver — each event requiring 45–90 minutes of cascading throughput loss as downstream bagging and cartoning stations starved for input. Post-deployment analysis of archived paper shift logs revealed that 82% of these drift events had been preceded by operator notes about colour registration variation in 2–4 preceding shifts — never linked or escalated across shift teams.
3–4
Bottleneck events per week
Each bottleneck event caused 2–4 hours of cascading throughput loss as downstream stations — bagging, cartoning, and palletizing — depleted their work-in-progress buffers and idled operators. The cumulative effect of 3–4 events per week was a structural throughput deficit that forced weekend overtime runs to meet customer commitments, adding $27,000 per month in premium labour and expedited logistics.
22%
Packaging line efficiency loss from web tension drift
Web tension drift on the flexographic line caused intermittent registration and seal quality deviations that forced line slowdowns from 450 ppm to 280 ppm during recovery. Shift log review after deployment showed that the tension drift pattern appeared in operator comments across 3–5 consecutive shifts before bottleneck escalation — but the unstructured paper format meant no cross-shift visibility into the degradation trend.
"We had operators on three shifts documenting the same print registration drift in three different ways across three different paper log sheets. The day shift operator wrote 'colour registration looks off.' The second shift operator wrote 'slowing down line 2 for registration adjust.' The night shift operator didn't document anything because they assumed the morning shift would handle it. That data loss was compounding into bottleneck events every single week and we couldn't see the pattern."
03 / The Solution
iFactory Digital Shift Logbook: Structured Shift Data Capture, Cross-Shift Bottleneck Analytics, and Production Intelligence
Following evaluation of three shift logbook and manufacturing analytics platforms, the facility selected iFactory for its purpose-built digital shift logbook architecture, structured data capture templates configurable for packaging line operations, and integrated bottleneck analytics that could aggregate shift data across all three production shifts in real time. The platform was deployed across all three packaging lines with structured shift templates, bottleneck tracking fields, and automated throughput analytics.
CAPTURE
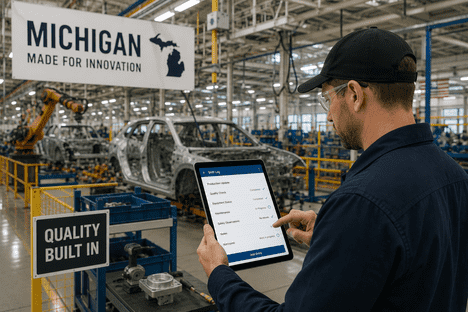
Structured shift logbook templates deployed across all three packaging lines with configurable fields for line speed, print registration quality, web tension readings, changeover duration, and downtime cause codes — replacing free-text paper entries with structured data capture that enforced consistent bottleneck indicator documentation across every shift and every operator.
ANALYTICS
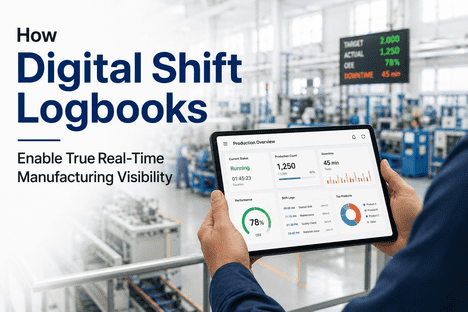
Cross-shift bottleneck analytics dashboard aggregated shift log data across all three shifts into a unified throughput and equipment health view — enabling supervisors and maintenance teams to identify bottleneck patterns developing across multiple shift cycles before they escalated into throughput events that eroded OEE.
HANDOVER
Digital shift handover workflow replaced paper-based handoff with structured, time-stamped shift reports that automatically transferred line status, speed changes, quality observations, and pending adjustments to the incoming shift — eliminating the information loss at every shift boundary that had previously allowed bottleneck patterns to develop undetected.
ALERTS
Automated bottleneck escalation configured to flag throughput and quality entries exceeding configurable thresholds — line speed drops below target, changeover duration exceeding standard, registration deviation outside tolerance — ensuring that bottleneck indicators captured on any shift were immediately visible to the production team regardless of shift schedule.
04 / Implementation
Full Digital Shift Logbook Platform Live Across All Lines in 55 Days
Days 1–12
Shift Log Audit and Bottleneck Template Design
All existing paper shift log formats audited across all three shifts and all three packaging lines. Bottleneck indicators identified and standardised: line speed fields, registration quality fields, changeover duration fields, downtime cause code fields, and escalation trigger thresholds. Structured digital shift log templates designed for rotogravure and flexographic lines with operator input optimised for minimum documentation time and maximum bottleneck signal capture.
Days 13–32
Phase 1 Deployment — Primary Rotogravure Line Live on Digital Shift Logbook
Digital shift logbook deployed on the highest-throughput rotogravure line during a scheduled weekend maintenance window — zero production interruption. iFactory platform connected with structured shift log templates live from Day 16. Operator training conducted during deployment window. Shift handover workflow enabled for Phase 1 assets, with first structured digital shift handover completed on Day 20.
Days 33–48
Phase 2 — Second Rotogravure and Flexographic Lines
Digital shift logbook deployment completed on second rotogravure line and flexographic line. Full production portfolio live on iFactory platform by Day 46. Cross-shift bottleneck analytics dashboard operational for all three lines by Day 48, with throughput and bottleneck trends visible across all three shifts with rolling 7-day and 30-day OEE tracking enabled.
Days 49–55
Workflow Integration and Platform Optimisation
iFactory shift logbook integrated with the facility's maintenance work order system, enabling shift-logged bottleneck indicators flagged as maintenance-required to automatically generate work order requests with full shift context. First cross-shift bottleneck pattern identified by the analytics engine on Day 52 — a print registration drift signature that had appeared in four consecutive shift log entries, automatically flagged and escalated before requiring a line slowdown.
05 / Results
12 Months of Measured Bottleneck Reduction and OEE Improvement
The transition from paper-based shift logs with fragmented handovers to iFactory's digital shift logbook platform with cross-shift bottleneck analytics produced measurable improvements across every tracked performance dimension within the first two post-deployment quarters. Overall equipment effectiveness reached 93% uptime — a 17-percentage-point improvement from the 76% baseline. Bottleneck-related downtime fell by 84%. Bottleneck events per week dropped from 3–4 to fewer than one. And the annual operational loss reduction of $312,000 delivered a platform ROI confirmed within six months of full deployment.
| Metric |
Before iFactory Shift Logbook |
After iFactory Shift Logbook |
Change |
| Overall equipment uptime |
~76% |
93% |
+17 percentage points |
| Bottleneck-related downtime per week |
9.5 hrs avg |
1.5 hrs avg |
−84% reduction |
| Bottleneck events per week |
3–4 |
<1 |
−80% event frequency |
| Print registration drift events |
~22 per year |
3 per year |
−86% drift events |
| Web tension deviation events |
~16 per year |
2 per year |
−87% deviation events |
| Line speed consistency |
~74% of target speed |
95% of target speed |
+21 percentage points |
| Mean time to detect bottleneck indicator |
Lost in paper logs (3–5 shifts delayed) |
First shift entry (same-shift detection) |
Real-time visibility |
| Shift handover documentation compliance |
~52% (estimated from log audit) |
97% structured handover completion |
+45 point improvement |
| Cross-shift data accessibility |
Paper binders in single location |
Real-time dashboard, any shift, any device |
24/7 visibility |
| Annual operational losses |
~$420,000 |
~$108,000 |
−74% cost reduction |
| Annual operational savings |
— |
$312,000 |
Net annual saving |
84%
Fewer Bottleneck Hours
See How iFactory's Digital Shift Logbook Prevents Bottlenecks at Your Facility
Get a live walkthrough of structured shift log templates, cross-shift bottleneck analytics dashboards, and automated escalation workflows built for packaging and converting production environments.
"The first time I saw a print registration drift trend across four consecutive shift log entries in a single dashboard view, I realised we had been flying completely blind. That pattern had been happening for years — buried in paper logs that nobody ever reviewed across shift boundaries. The iFactory shift logbook made it visible on Day 52, and we scheduled the impression roller inspection before the drift caused a bottleneck. Under the old paper system, that drift would have compounded into a 3-hour throughput loss on a Thursday afternoon and we would have blamed the operator."
06 / Key Analysis
Why the Bottleneck Prevention Improvement Was This Comprehensive
01
Structured shift log templates eliminated the data quality gap that made cross-shift bottleneck trend analysis impossible. Paper shift logs produced unstructured, inconsistent data that could not be aggregated, analysed, or compared across shift boundaries. iFactory's structured templates enforced consistent field completion, standardised terminology, and complete bottleneck indicator reporting across every shift and every operator — transforming individual shift observations into an aggregated production intelligence dataset that revealed bottleneck patterns invisible under the paper model.
02
Digital shift handover workflows eliminated the information loss at every shift boundary. Under the paper system, approximately 40% of bottleneck indicators logged on one shift were never reviewed or actioned by the incoming shift. iFactory's digital handover workflow made line speed, registration quality, and pending adjustments from the outgoing shift immediately visible to the incoming shift through a structured, time-stamped shift report — eliminating the handover gap that had previously allowed bottleneck patterns to develop undetected across multiple shift cycles.
03
Cross-shift bottleneck analytics converted individual shift observations into production intelligence that drove preventive action. The iFactory platform aggregated structured shift log data from all three shifts into a unified throughput dashboard — enabling the production team to see bottleneck trends developing across multiple shift cycles, identify lines requiring attention before throughput dropped, and schedule interventions during planned windows rather than reacting to cascading bottleneck events that had already impacted OEE.
04
Automated escalation ensured that critical bottleneck indicators were never delayed by shift schedules. Under the paper system, an operator detecting a registration drift or tension variation on third shift had to document it in a log, hope it was read by the day shift supervisor, and wait potentially 8–16 hours for action. iFactory's automated escalation flagged bottleneck indicators exceeding configurable thresholds immediately — alerting the production team regardless of shift schedule and enabling intervention before the indicator escalated into a full throughput event.
07 / Business Impact
Operational, Financial, and Strategic Outcomes Beyond Bottleneck Reduction
Production Throughput Recovery
Eliminating 8 hours of average weekly bottleneck downtime recovered approximately 416 annual production hours — restoring capacity equivalent to more than 17 full production days previously lost to reactive bottleneck management driven by fragmented shift data and undetected throughput erosion across shift boundaries.
Changeover Efficiency Improvement
Changeover duration data captured through structured shift log fields revealed that 23% of bottleneck events originated from slow or inconsistent changeovers. Standardising changeover tracking across shifts and surfacing completion times in the cross-shift dashboard enabled the continuous improvement team to reduce average changeover time by 34%, recovering an additional 2.3 production hours per week.
Material Waste Reduction
Bottleneck recovery typically involved running rejected material during line stabilisation — generating an estimated $56,000 in annual substrate and ink waste. The 84% reduction in bottleneck events eliminated the majority of recovery-related waste, with structured shift log data enabling targeted waste reduction initiatives that further lowered material costs by $22,000 annually.
Customer Delivery Reliability
Achieving 93% equipment uptime and eliminating the majority of bottleneck events enabled the facility to commit to tighter delivery windows with three major retail and foodservice customers — improving on-time delivery performance from 84% to 97% and qualifying the operation for preferred supplier status with two accounts, representing an estimated $380,000 in incremental annual contract value.
$420K
Annual operational losses before
$108K
Annual operational losses after
93%
Equipment uptime achieved
$312K
Annual savings achieved
08 / Conclusion
Shift Logbook-Driven Bottleneck Prevention: The Compounding Value of Structured Shift Data
This packaging facility's transformation from paper-based shift logs with fragmented handovers to iFactory's digital shift logbook platform eliminated the structural data gap that had hidden bottleneck patterns across shift boundaries for years. The digital shift logbook gave the facility structured, consistent, and accessible shift data across every shift and every production line — and the cross-shift bottleneck analytics engine converted that data into actionable production intelligence, throughput trend visibility, and preventive decisions that improved uptime, efficiency, and cost structure simultaneously.
The $312,000 in annual operational savings is a direct financial outcome. The 93% equipment uptime is an operational reliability outcome. The 84% reduction in bottleneck downtime is a throughput outcome. And the 416 recovered annual production hours compound in value as delivery reliability strengthens customer relationships and opens access to premium supplier programmes. To assess what iFactory's digital shift logbook platform would deliver for your packaging or converting facility, Book a Demo with iFactory's shift logbook team.
93% Uptime. 84% Fewer Bottlenecks. Digital Shift Logbook Live in 55 Days.
See how iFactory's structured shift logbook platform delivers real-time bottleneck tracking, cross-shift throughput analytics, and automated escalation workflows for packaging and converting operations.
09 / FAQ
Frequently Asked Questions
How does iFactory's digital shift logbook prevent bottlenecks compared to paper shift logs?
iFactory replaces free-text paper entries with structured shift log templates that enforce consistent bottleneck indicator capture across every shift and operator. Cross-shift analytics aggregate data from all shifts into unified throughput dashboards, enabling bottleneck trend detection before throughput loss, automated escalation, and real-time OEE tracking that paper logs cannot provide.
Can iFactory's shift logbook detect print registration and web tension drift patterns across multiple shifts?
Yes. iFactory's structured shift log templates capture registration quality and web tension readings at every shift. The cross-shift analytics engine aggregates these data points across all three shifts and identifies drift trends — colour variation patterns, tension deviation — that precede bottleneck events, enabling preventive adjustment during planned changeovers before throughput loss occurs.
How does iFactory integrate with existing packaging line control systems and data infrastructure?
iFactory's digital shift logbook platform integrates with existing PLC, SCADA, and sensor infrastructure through configurable data import pipelines and API connections. Integration is completed during scheduled maintenance windows with zero production interruption, and the platform is compatible with major packaging OEM control systems and existing industrial networks.
How long does iFactory shift logbook deployment take for a multi-line packaging facility?
This facility achieved full platform coverage across three high-speed packaging lines with structured shift log templates, cross-shift analytics, and automated escalation workflows within 55 days — with the primary line live and generating cross-shift bottleneck visibility within the first 32 days. No operational interruptions occurred during installation.
What ROI timeline should packaging facilities expect from iFactory's digital shift logbook platform?
Operations with fragmented shift communication, unstructured shift data, or active bottleneck patterns from undetected throughput erosion typically recover platform investment within the first full operating year. This facility confirmed ROI within six months of full deployment, driven by bottleneck downtime reduction, material waste elimination, and recovered production capacity from OEE improvement.
Does iFactory support multi-line shift logbook deployment across different packaging technologies in a single facility?
Yes. iFactory supports structured shift log templates configurable for rotogravure lines, flexographic lines, bagging stations, cartoning equipment, and palletizing systems — all under a unified shift data and throughput analytics interface. Line-specific templates are configured independently for each equipment type, with a consolidated cross-shift dashboard providing a single production intelligence view for the operations team.