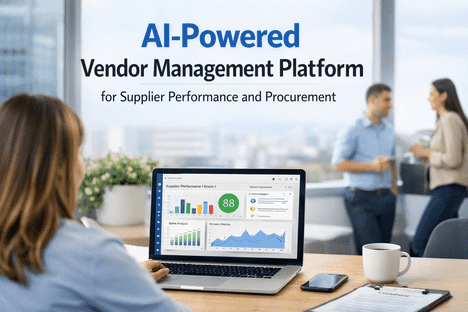
Manufacturing procurement teams manage hundreds — sometimes thousands — of suppliers across raw materials, components, MRO, packaging, and services. Yet most still evaluate vendor performance through quarterly spreadsheet reviews, subjective buyer feedback, and reactive conversations after a quality escape or delivery failure has already disrupted production. A 2026 Gartner report found that companies using formal vendor evaluation frameworks reduce procurement costs by 12-15% while improving supplier quality. Meanwhile, more than 60% of organizations say poor vendor visibility leads to unexpected costs and delays. AI enhances supplier performance scoring accuracy by 30% by analyzing real-time data including delivery times, quality rejection rates, and compliance records — turning subjective gut feelings into quantified, comparable, and actionable intelligence. iFactory's AI-powered Vendor Performance Index (VPI) scores every supplier in your supply base continuously — not quarterly — using live ERP, quality, receiving, and inspection data to surface the 20% of suppliers causing 80% of your supply chain problems. Schedule a demo to see your vendor performance data transformed into actionable intelligence.
Why Manual Vendor Scorecards Fail at Scale
Manual vendor scorecards worked when your supply base had 20 suppliers. With 200-2,000 suppliers across multiple categories, geographies, and quality tiers, spreadsheet-based evaluation creates dangerous blind spots. The problem isn't lack of data — your ERP, QMS, receiving logs, and inspection records already contain everything needed to score every supplier in real time. The problem is that no one is connecting the data.
Quarterly Reviews Miss Real-Time Problems
A supplier's delivery performance collapses in week 3, but the next scorecard review isn't until end of quarter. By then, 8 weeks of production disruptions have occurred. AI scores continuously — flagging deterioration within days, not months.
Subjective Buyer Feedback Biases Scores
Buyers unconsciously rate familiar suppliers higher and new suppliers lower. 83% of engineers spend 4+ hours per week on procurement workflows — leaving little time for objective data analysis. AI replaces opinions with measurements.
Data Silos Prevent Holistic Evaluation
Delivery data lives in the ERP, quality rejections in the QMS, compliance certificates in shared drives, and cost data in procurement files. No single person sees the complete picture — and spreadsheets cannot connect live data sources automatically.
Scorecard Sprawl Kills Consistency
Different buyers, categories, and plants create their own scorecard versions — different metrics, different scales, different weighting. Results become incomparable. AI applies a standardized, weighted scoring framework across your entire supply base.
Still running quarterly vendor reviews on spreadsheets? Schedule a demo to see how iFactory replaces manual scorecards with continuous, AI-powered vendor intelligence.
AI-Powered Vendor Performance Index (VPI)
iFactory's VPI calculates a composite score for every supplier by weighting five performance pillars — with weights configurable by category, criticality, and strategic importance. A manufacturing company might weight quality at 35%, delivery at 30%, cost at 20%, compliance at 10%, and responsiveness at 5% — while a food manufacturer might weight compliance at 40% given regulatory stakes. AI adjusts scores dynamically as new data arrives.
Quality
Incoming inspection pass rate, PPM defect rates, NCR frequency, corrective action response time, SCAR closure rate
Delivery
On-time delivery percentage, early/late distribution, quantity accuracy, lead time consistency, expedite frequency
Cost
Price competitiveness vs market benchmarks, total cost of ownership, invoice accuracy, payment term compliance
Compliance
ISO/IATF/FSSC certification status, audit scores, document currency, ESG reporting, regulatory adherence
Responsiveness
RFQ response time, issue resolution speed, communication quality, engineering change support, flexibility
iFactory's VPI isn't a static number — it's a living score that updates with every receiving transaction, every inspection result, every NCR, and every delivery. AI detects performance trend changes (improving or deteriorating) and alerts procurement teams before a slow decline becomes a supply chain crisis. Scores are comparable across categories and plants, enabling enterprise-wide supplier benchmarking.
Delivery Reliability & Lead Time Accuracy Tracking
On-time delivery is the metric most procurement teams track — but it's a blunt instrument. A supplier with 92% OTD looks acceptable until you discover that the 8% late deliveries cluster around your highest-volume, most-critical components and consistently arrive 3+ weeks late. AI disaggregates delivery performance to reveal the patterns that aggregate metrics hide.
On-Time / Early / Late Distribution
Not just OTD percentage — AI analyzes the distribution: how early (wasting warehouse space) and how late (disrupting production), segmented by part number, PO value, and criticality classification.
Lead Time Consistency
Average lead time matters less than lead time variability. A supplier with 6-week average and 1-week standard deviation is far more plannable than one with 5-week average and 3-week standard deviation. AI calculates both.
Quantity Accuracy
Suppliers who consistently ship 95% of ordered quantities force you to maintain higher safety stock. AI tracks quantity fill rate per supplier and calculates the working capital impact of under-shipment patterns.
Lead Time Drift Detection
AI detects gradual lead time creep — when a supplier's lead time slowly extends from 4 weeks to 5 to 6 over several months. This drift signals capacity problems or deprioritization that, unchecked, leads to stockouts.
Which suppliers are silently getting slower? Book a demo to see lead time drift detection that catches supply chain degradation before it becomes a production stop.
Quality Rejection Rate & NCR Correlation
A supplier's quality score should reflect the full cost of their quality failures — not just the incoming inspection reject rate. iFactory's AI correlates incoming rejections, in-process NCRs, field returns, and corrective action responsiveness into a unified quality score per supplier.
Incoming Inspection Metrics
Pass/fail rates per supplier per part number, PPM tracking, inspection lot skip eligibility based on demonstrated quality history, and trend analysis for deteriorating quality before it crosses rejection thresholds.
NCR & SCAR Tracking
Non-conformance reports linked to supplier and part number. AI tracks NCR frequency, severity, recurrence patterns, and corrective action closure time. Suppliers with recurring NCRs for the same defect type are flagged for escalation.
Cost of Poor Quality (COPQ)
AI calculates the true cost of each supplier's quality failures: inspection labor, rework hours, production line stops, scrap value, expedited replacement shipping, and customer complaint resolution costs attributed to supplier-origin defects.
Supplier Development Triggers
When quality scores drop below configurable thresholds, iFactory auto-generates supplier development actions — corrective action requests, audit scheduling triggers, and sourcing diversification recommendations with alternative supplier suggestions.
Know your true Cost of Poor Quality per supplier? Schedule a quality analytics demo — iFactory calculates COPQ per supplier including hidden costs most procurement teams never quantify.
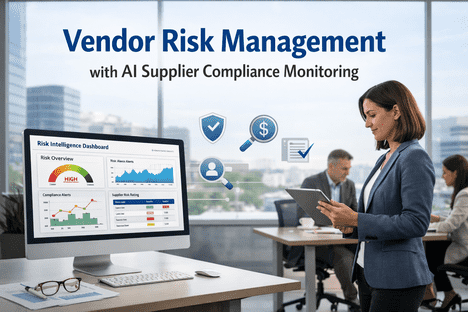
Vendor Compliance & Certification Monitoring
Expired ISO certificates, lapsed insurance policies, and outdated regulatory approvals create compliance risk that surfaces during audits — not during daily operations. iFactory tracks every vendor document with expiration dates and auto-alerts before compliance gaps occur. In 2026, 72% of Fortune 500 companies include ESG scoring in vendor scorecards.
Quality management system certification tracking with expiration alerts, recertification status, and audit result logging
Automotive quality standard compliance for Tier 1/2/3 suppliers with process audit scores and customer-specific requirements
Food safety certification for ingredient and packaging suppliers with GFSI benchmark equivalency tracking
Environmental management certification for ESG compliance scoring and sustainable procurement requirements
General liability, product liability, and workers compensation certificate tracking with coverage amount verification
Environmental, social, and governance scoring — carbon footprint, ethical labor, diversity metrics, and sustainability reporting
How many supplier certifications have expired without anyone noticing? Schedule a compliance gap analysis — we'll show you exactly which vendors have lapsed documents creating audit risk.
Vendor Risk Scoring & Single-Source Alerts
AI calculates a composite risk score for every supplier by combining performance data with financial health indicators, geographic concentration risk, and dependency analysis. The suppliers that look fine on a quarterly scorecard may be your highest risk when you factor in single-source dependency and lead time vulnerability.
Single-Source Dependency
AI flags every part number sourced from a single supplier — your highest supply chain risk. For each single-source component, iFactory calculates the production impact if that supplier fails and recommends qualification of alternative sources.
Performance Trend Deterioration
A supplier delivering 98% OTD last quarter but trending to 92% this quarter is a bigger risk than one consistently at 94%. AI detects the direction of change — deteriorating suppliers get early warning flags before they cause disruptions.
Concentration Risk
AI maps spend concentration — if 40% of critical material spend goes to one geographic region or supplier group, that's a disruption vulnerability. Dashboard visualization shows spend distribution across regions, suppliers, and categories.
Financial Health Signals
AI monitors publicly available financial indicators, payment pattern changes, and credit risk signals that may indicate supplier financial distress — providing early warning before a critical supplier reduces capacity or goes bankrupt.
Auto-Generated Vendor Review Reports
iFactory generates comprehensive vendor review reports automatically — eliminating the 4-6 hours procurement teams spend preparing for each quarterly business review. Reports are data-driven, consistent, and shareable with suppliers to drive transparent improvement conversations.
Vendor Scorecard Summary
Composite VPI score with pillar breakdown, trend arrows, and peer benchmarking — generated automatically from live data
Performance Trend Analysis
Rolling 3/6/12-month trends per metric with AI-highlighted inflection points and deterioration warnings
Quality Performance Report
NCR summary, SCAR status, COPQ calculation, PPM trends, and defect Pareto by part number per supplier
Vendor Risk Assessment
Composite risk score, single-source alerts, concentration risk map, and recommended mitigation actions
Spending hours preparing quarterly vendor review presentations? Book a demo to see auto-generated vendor reports that update in real time — ready for any QBR without manual preparation. Visit iFactory support for integration details.
Frequently Asked Questions
Stop Guessing Which Suppliers Are Your Weakest Link.
iFactory's AI-powered Vendor Performance Index scores every supplier continuously — surfacing delivery failures, quality deterioration, compliance gaps, and single-source risks before they disrupt your production.