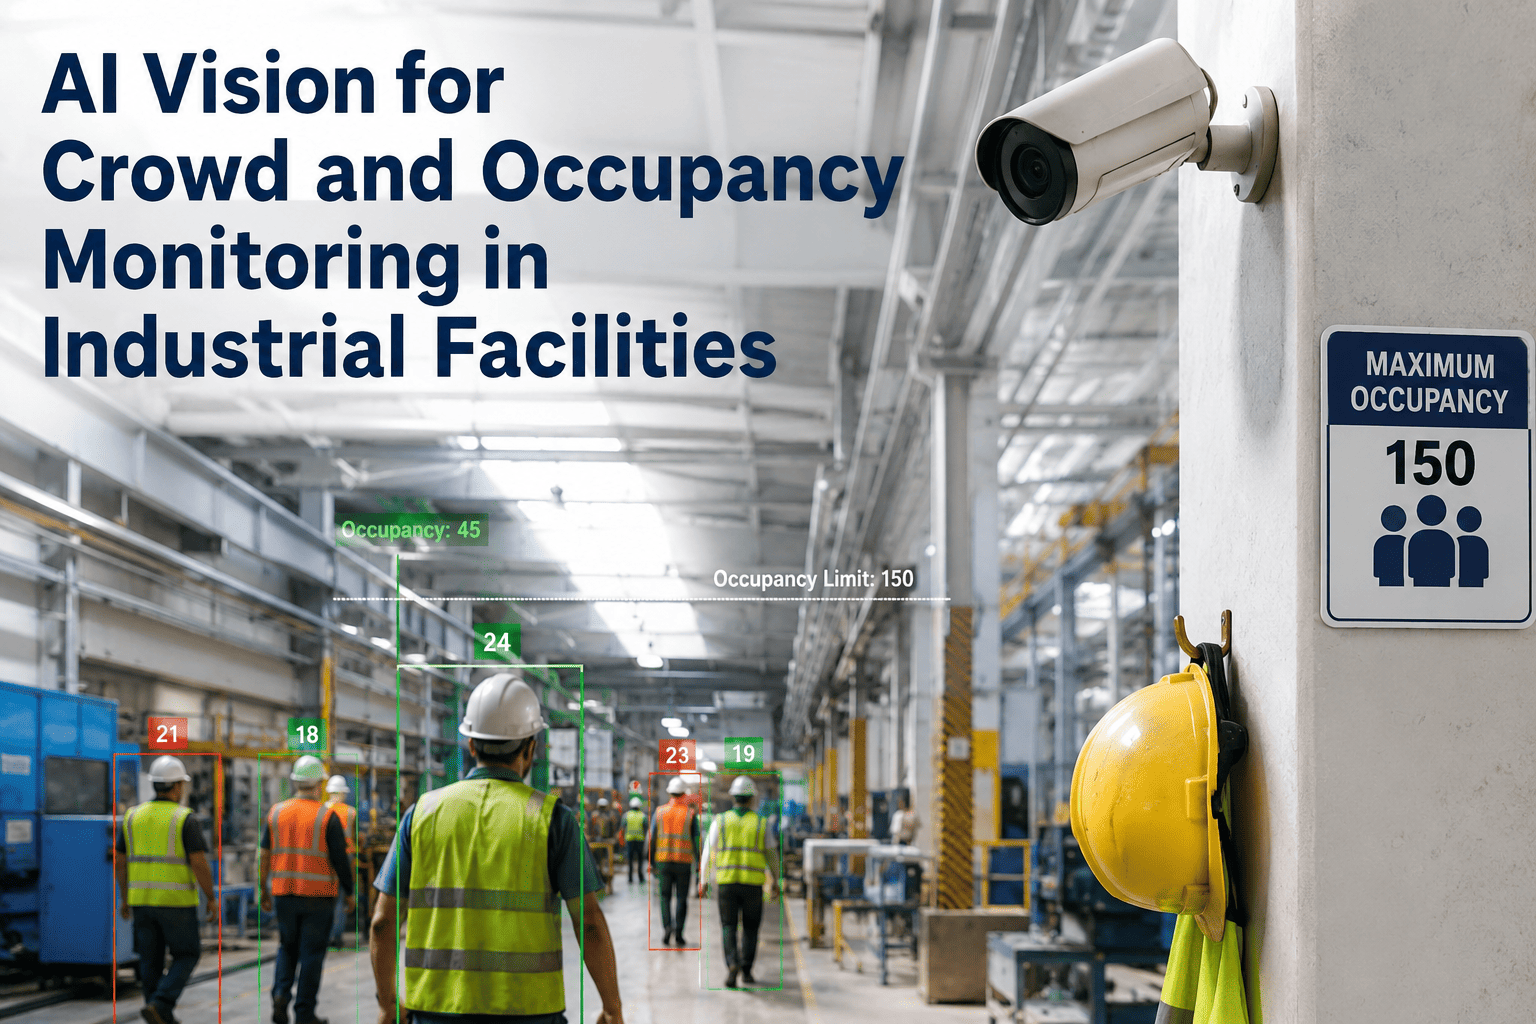
When an alarm sounds in a chemical plant, a refinery, or a multi-story manufacturing facility, the first question every incident commander asks is how many people are inside and where they are right now. In most industrial facilities, the answer depends on sign-in sheets, badge swipe logs, and supervisors doing headcounts — methods that are slow, incomplete, and unreliable when seconds matter. AI vision cameras mounted at zone entrances and throughout facility areas count people in real time, track movement between zones, and maintain a live occupancy map that is instantly available during normal operations and emergencies alike. The technology does not require wearables, badges, or active participation from personnel — it sees people the way a camera sees them, turning that visual data into actionable occupancy intelligence for safety teams and facility managers.
AI Occupancy Monitoring
AI Vision for Crowd and Occupancy Monitoring in Industrial Facilities
Real-time personnel counting by zone, live occupancy dashboards, automated muster verification, and evacuation tracking — all from standard surveillance cameras enhanced with deep learning.
Live Zone Occupancy View
Total Personnel on Site
94
Why Manual Muster Fails When It Matters Most
Emergency muster procedures in industrial facilities depend on a chain of human actions that each introduce delay and error. Workers must remember to sign in at the start of their shift, visitors must be logged by reception, contractors must be tracked by their supervisors, and during an evacuation everyone must report to a designated assembly point where a designated person counts heads against the expected roster. Research on emergency evacuation performance shows that manual muster typically takes 15 to 45 minutes to complete, and produces accuracy rates between 70 and 85 percent even under ideal conditions. Under the stress, noise, and confusion of a real emergency, accuracy drops further. AI vision eliminates every step in that unreliable chain by maintaining a continuous, automated count that does not depend on anyone remembering to do anything.
Manual Muster Failure Points
01
Forgot to Sign In
Workers enter through alternate doors, forget to badge in, or sign in and then leave the facility without signing out, creating phantom occupants.
02
Visitor and Contractor Gaps
Transient workers, delivery drivers, and visitors are inconsistently logged or logged into wrong areas, making the roster inaccurate before the alarm even sounds.
03
Evacuation Chaos
During an actual evacuation, people scatter to different assembly points, responders cannot find their muster leader, and the counting process breaks down under time pressure.
04
Stale Roster Data
The expected headcount is based on the shift schedule, not the actual number of people present. Overtime workers, early departures, and schedule swaps create mismatches.
15-45 minTime to complete manual muster
70-85%Manual muster accuracy
30-50%Accuracy drop under real emergency stress
Three Scenarios Where Occupancy Intelligence Changes Outcomes
Occupancy monitoring is not a single use case — it is a capability that delivers different value in different operational contexts. The following scenarios represent the highest-impact applications in industrial facilities, each with distinct technical requirements and measurable outcomes.
Emergency
Mustard Verification and Evacuation Tracking
When an alarm triggers, the system immediately switches from normal monitoring to emergency mode. The live occupancy map shows exactly how many people are in each zone, and as cameras at evacuation routes detect people exiting, the zone counts decrease in real time. The incident commander sees a closing balance per zone — who has evacuated and who has not — without waiting for a single headcount. Zones that still show occupants after the evacuation window trigger targeted search alerts, directing responders to the specific areas where people may be trapped or unaware. The entire status picture is available within seconds of the alarm, not minutes or tens of minutes.
Secondsto full occupancy status after alarm
Capacity
Zone Capacity Enforcement
Certain areas in industrial facilities have maximum occupancy limits defined by fire codes, process safety regulations, or operational constraints — control rooms, confined space entry areas, scaffolding platforms, and clean rooms. AI vision counts people entering and exiting these zones in real time and compares the live count against the defined capacity threshold. When the count approaches the limit, the system issues a warning to the zone supervisor. When the limit is exceeded, it triggers an alert that requires acknowledgment and can be integrated with access control to prevent additional entry until the count drops below threshold. This eliminates the honor-system approach where capacity limits exist on paper but are never enforced in practice.
100%enforcement of posted capacity limits
Operations
Shift Workforce Verification and Contractor Tracking
At shift change, the system compares the actual headcount in each zone against the expected roster, flagging discrepancies before the shift begins. During the shift, it tracks contractor crews moving between authorized and unauthorized zones, alerting safety officers when personnel enter areas they are not cleared for. At shift end, it confirms that all personnel have exited the facility, preventing the scenario where a worker remains in a confined space or hazardous area after the shift crew has left. This continuous verification replaces the end-of-shift walkthrough that supervisors often skip or perform incompletely.
Continuousroster verification across entire shift
How AI Detects and Tracks People in Industrial Settings
People detection in an industrial facility is harder than people detection in an office or retail space. Workers wear high-visibility clothing, helmets, and sometimes respirators that alter their silhouette. They carry tools, push carts, and operate equipment that partially occludes them. Lighting varies from well-lit control rooms to dim warehouse aisles and outdoor loading docks with glare and shadow. Cameras are mounted at various heights and angles, and the field of view often includes machinery, structural elements, and moving equipment that creates visual clutter. The detection pipeline is specifically engineered for these conditions.
Industrial People Detection Pipeline
1
Detect
Object detection model identifies every person in the camera frame using a YOLO-family architecture trained on industrial worker imagery including PPE, helmets, and carried objects
2
Track
Multi-object tracker assigns a unique ID to each detected person and maintains that identity across frames as they move through the camera field of view
3
Count
Line-crossing algorithm counts each tracked person as they cross a virtual tripwire at zone boundaries, incrementing or decrementing the zone total based on direction of travel
4
Aggregate
Counts from all cameras covering a zone are aggregated, deduplicated for overlapping camera fields of view, and reconciled to produce a single authoritative zone count
5
Display
Live zone counts, trend histories, and alert status are pushed to the occupancy dashboard, mobile app, and integration endpoints for SCADA and BMS systems
Every minute spent trying to figure out how many people are inside a facility during an emergency is a minute where responders cannot act on reliable information. Manual muster is a procedure designed for a world before cameras could count. See the live occupancy dashboard running on your facility layout.
Book a 30-minute demo and bring your floor plan.
Accuracy Across Industrial Environments
People counting accuracy varies significantly depending on the physical environment, camera placement, and the technical approach used. Simple motion-based counters produce 70 to 80 percent accuracy in open spaces but degrade rapidly when people walk close together, cross paths, or are partially occluded by equipment. AI-based detection and tracking maintains high accuracy across these challenging conditions because the model recognizes people by their visual features rather than by motion blobs, and the tracker maintains identity through occlusion events. The table below documents accuracy benchmarks from AI occupancy systems deployed across common industrial environment types.
| Environment |
Motion Counter |
AI Detection + Tracking |
Key Challenge |
| Open production floor |
80-88% |
97-99% |
Workers walking in groups |
| Warehouse aisles |
72-80% |
95-98% |
Forklift occlusion, racking shadows |
| Doorways and gates |
85-92% |
98-99.5% |
Bi-directional flow, simultaneous entry |
| Outdoor loading dock |
65-75% |
93-97% |
Glare, shadows, weather, vehicles |
| Stairwells and corridors |
60-70% |
94-97% |
Close proximity, overlapping paths |
| Low-light utility areas |
50-60% |
90-95% |
Poor lighting, confined space |
Using Your Existing Camera Infrastructure
Most industrial facilities already have surveillance cameras installed at entry points, along corridors, and covering production areas for security purposes. These cameras are typically underutilized — recording footage that is reviewed only after an incident, if at all. AI occupancy monitoring runs on these existing cameras by receiving the video stream and processing it through the people detection and tracking pipeline. The cameras do not need to be replaced, repositioned, or upgraded in most cases. The AI inference runs on edge computing devices installed near the cameras or in a central server room, and the processed count data is transmitted over the existing network to the dashboard. The incremental hardware cost is limited to the edge devices and network switches, which is typically 60 to 80 percent lower than deploying a new dedicated sensor network.
What Reuses vs What Adds
Reuses Existing
IP cameras at doors, gates, and zones
Network infrastructure and cabling
Video management system (VMS) streams
Camera mounting positions and housings
Existing lighting (with AI low-light compensation)
Adds New
Edge inference devices per camera group
AI detection and tracking software license
Occupancy dashboard application
Zone configuration and calibration
Integration connectors for SCADA or BMS
60-80%
Lower hardware cost vs deploying new dedicated sensors
Compliance Mapping: Regulations That Require Occupancy Data
Industrial occupancy monitoring is not only an operational improvement — it directly supports compliance with regulations that mandate personnel accountability in hazardous environments. The requirements vary by jurisdiction and industry, but the common thread is that facilities must know who is inside, where they are, and be able to account for everyone during an emergency. AI vision provides the real-time data that these regulations require but that manual systems consistently fail to deliver reliably.
OSHA 1910.38
Emergency Action Plans
Requires procedures for accounting for all employees after evacuation. AI provides real-time zone-by-zone occupant count that satisfies the accountability requirement without manual headcount.
OSHA 1910.146
Permit-Required Confined Spaces
Requires accurate identification of personnel inside confined spaces. AI vision counts entrants and exits in real time, triggering alerts if the count does not match the permit roster.
NFPA 101
Life Safety Code — Occupancy Limits
Establishes maximum occupancy for various space types. AI enforces these limits in real time with automated alerts and optional access control integration when thresholds are exceeded.
API 752/753
Management of Hazards — Occupied Buildings
Requires occupancy accountability for buildings in process hazard zones. AI maintains continuous count and provides instant occupant list during incident response.
IEC 61511
Safety Instrumented Systems
For facilities using SIS, personnel count data can be integrated as an input to safety system logic for area evacuation and shutdown decisions based on actual occupancy.
Frequently Asked Questions
Does the system identify individual workers by name or face?
No, and that is by design. AI occupancy monitoring counts people as anonymous objects — it detects human figures, tracks them through the camera field of view, and counts them as they cross zone boundaries. It does not perform facial recognition, does not store biometric data, and does not link a count to a specific individual's identity. This approach avoids the privacy and regulatory complications associated with facial recognition while still delivering the exact occupancy data that safety and compliance require. If name-level accountability is needed, the system can be integrated with badge reader or access control data to associate a count event with a badge swipe, but the vision system itself remains anonymous. This architecture is specifically designed to satisfy works councils, privacy officers, and GDPR-style requirements that restrict biometric surveillance in the workplace.
Discuss privacy architecture with our team.
How does it handle people walking close together or in groups?
This is the primary technical challenge in people counting, and it is where AI detection fundamentally outperforms simpler methods like motion sensors or basic blob counters. When two or three people walk through a doorway side by side, a motion-based counter sees a single blob and counts one person. An AI detection model sees three distinct human figures because it recognizes individual body shapes, head positions, and limb patterns even when they overlap in the image. The multi-object tracker then maintains separate identities for each person, so when they cross the virtual tripline, each one is counted individually. In benchmark testing on industrial doorways with bidirectional group traffic, AI tracking achieves 98 to 99.5 percent accuracy compared to 75 to 85 percent for motion-based counters. The system is specifically trained on group-traffic scenarios common in industrial shift changes and evacuation routes.
What happens to the count if a camera goes offline?
The system is designed for resilience. Each zone is typically covered by multiple cameras with overlapping fields of view, so the loss of a single camera does not create a blind spot — the remaining cameras continue counting for that zone. If all cameras covering a zone go offline simultaneously, the system flags the zone count as "degraded" on the dashboard, holds the last known count with a timestamp, and triggers a maintenance alert. The zone count is not reset to zero, because that would create a false sense of an empty zone. During a degraded state, the system can fall back to integration with badge reader data if available, providing a lower-confidence estimate until camera service is restored. The dashboard clearly distinguishes between live-verified counts and degraded estimates so that incident commanders always know the confidence level of their occupancy data.
Review redundancy architecture in a demo session.
Can it distinguish between workers and other moving objects like forklifts?
Yes. The detection model is trained to recognize the visual features that distinguish people from vehicles, equipment, and other moving objects. A forklift, a pallet jack, or an automated guided vehicle has a completely different shape, size, and movement pattern than a human figure, and the model classifies them as separate object categories. Only detections classified as "person" are counted toward the occupancy total. Vehicles are tracked separately if desired, providing additional operational data like forklift traffic density by zone, but they do not inflate the people count. The model is also trained to ignore common false-positive sources in industrial environments — swinging doors, moving shadows, steam, and reflective surfaces that might trigger a motion sensor but are correctly rejected by the AI classifier as non-person objects.
How long does it take to deploy across a full facility?
Deployment timeline scales with the number of cameras and zones but follows a structured process. The assessment and zone-design phase takes one to two weeks, mapping camera coverage to zone boundaries and defining capacity thresholds. Software installation on edge devices takes one to two days per device, and most facilities need four to twelve edge devices depending on camera count and network topology. Zone calibration and count validation — verifying that the AI count matches manual counts at each zone boundary — takes an additional one to two weeks as the system is tuned for the specific camera angles, lighting, and traffic patterns at each location. For a typical mid-size facility with 20 to 40 cameras and 5 to 10 zones, the full deployment from assessment to validated go-live is four to eight weeks. Larger facilities with hundreds of cameras are deployed in phases, with the highest-priority zones going live first and additional zones brought online in subsequent waves.
Know Exactly Who Is Inside — Every Second of Every Shift
See Live Occupancy Monitoring on Your Facility Layout — in 30 Minutes
Send us your floor plan or a list of zones and camera positions. We will configure a live occupancy dashboard with your zone names, capacity thresholds, and camera layout, and demonstrate the people detection and tracking pipeline on sample industrial footage. See the data that your incident commander would see during an alarm — in real time, zone by zone, without a single manual headcount.
Seconds
Full occupancy status after alarm
97-99%
People counting accuracy
Anonymous
No facial recognition or biometrics
Existing
Uses your current cameras