Most businesses drown in data but starve for insight. These 10 KPIs cut through the noise — giving every team, in every industry, the exact numbers that separate growing companies from stagnating ones. In 2026, tracking the right performance indicators is not optional. It is the difference between scaling with confidence and guessing your way to stagnation.
iFactory Blog · Business Intelligence · 2026 Edition
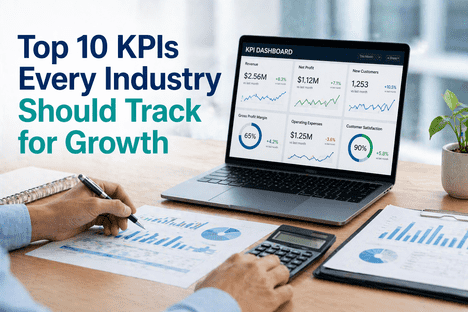
Top 10 KPIs Every Industry Should Track for Growth
Most teams track what is easy to measure, not what drives growth. These 10 KPIs connect directly to revenue, retention, efficiency, and quality — across every sector, at every scale.
90%
of startups fail by ignoring the right metrics
15%
faster growth in companies with clear KPI benchmarks
5–7x
more costly to acquire a customer than retain one
+53%
labor productivity lift from real-time analytics
Sources: Forbes · Harvard Business Review · LivePlan 2024 · McKinsey · WEF Global Lighthouse Network · Spider Strategies · Kacinka Business KPI Report
Why Most Businesses Track the Wrong Things
Follower counts, page views, app downloads — these numbers feel productive but rarely drive business decisions. A true KPI passes one test: if this number improves by 20%, does revenue, margin, or operational output benefit directly? If the answer is no, it is a vanity metric — interesting data, not a performance indicator. The 10 KPIs below all pass that test, across every major industry.
The Business Case for Getting KPIs Right
Measurable performance gains from structured KPI adoption · 2026 research data
+53%
Labor productivity lift
WEF Global Lighthouse Network
−26%
Conversion cost reduction
WEF Global Lighthouse Network
3:1
Minimum healthy CLV to CAC ratio
Industry Standard Benchmark
30%
Budget variance reduction with daily visibility
FinOps Research 2026
The 10 KPIs at a Glance
Each KPI below applies whether you run a manufacturing plant, a SaaS company, a retail chain, or a healthcare system. The benchmarks shift by sector — the KPI itself does not. These are the metrics that consistently appear on the dashboards of organizations that outperform their peers.
01
Financial
Revenue Growth Rate
The most fundamental signal of business health. Consistent growth here means your model works.
02
Growth
Customer Acquisition Cost
Total cost to win one new customer. A rising CAC without rising value is a silent margin killer.
03
Retention
Customer Lifetime Value
Total revenue per customer relationship. Drives smart acquisition budget decisions. Target CLV:CAC 3:1.
04
Financial
Gross Profit Margin
Revenue remaining after direct costs. The true earning power of each unit you sell.
05
Customer
Net Promoter Score
Measures loyalty. Predicts retention better than any satisfaction survey. Above 50 is excellent.
06
Operations
Operational Efficiency
OEE for manufacturing. Cost-to-income for services. World-class OEE sits at 85%+.
07
Workforce
Employee Productivity
Revenue per employee. Rising signals efficient scaling. Declining signals process bloat early.
08
Quality
Defect / Error Rate
Outputs failing quality standards. Destroys margin, trust, and brand equity simultaneously.
09
Financial
Cash Flow & Burn Rate
Real liquidity health beyond profit numbers. A profitable business can still fail from poor cash timing.
10
Financial
Return on Investment
Efficiency of every rupee invested. The ultimate accountability metric that closes strategy to outcome.
Each KPI — Explained, Benchmarked, and Formulated
Understanding what a KPI measures is only step one. The benchmark tells you whether your number is strong, average, or a warning sign. The formula tells you exactly how to calculate it. All ten are below.
Revenue Growth Rate
WhatThe percentage increase in net revenue from one period to the next — quarterly or annually.
WhyThe most fundamental signal of business health. Stagnation here is an early warning — well before profits feel the impact.
BenchmarkSaaS startups 20–30% MoM · Manufacturing 5–12% YoY · Retail 3–8% YoY
(Current Revenue − Prior Revenue) ÷ Prior Revenue × 100 = Growth %
Customer Acquisition Cost (CAC)
WhatThe total cost — marketing, sales, onboarding — to win one new customer in a given period.
WhyA rising CAC without a corresponding rise in customer value is a silent margin killer that compounds over time.
BenchmarkeCommerce $10–$86 · SaaS B2B $200–$1,500 · Education $500–$1,143+
Total Marketing + Sales Spend ÷ New Customers Acquired = CAC
Customer Lifetime Value (CLV)
WhatThe total revenue a single customer generates across their entire relationship with your business.
WhyCLV determines how much you can afford to spend on CAC. Without it, every acquisition budget decision is a guess.
BenchmarkCLV:CAC ratio 3:1 minimum · 4:1 or higher is excellent · Below 2:1 is unsustainable
Avg Order Value × Purchase Frequency × Customer Lifespan = CLV
Gross Profit Margin
WhatThe percentage of revenue remaining after subtracting the direct cost of goods or services delivered.
WhyThis tells you the true earning power of each unit before overhead, marketing, or admin costs are applied.
BenchmarkSaaS 60–70% · eCommerce 30%+ · Manufacturing 20–40% depending on product complexity
(Revenue − Cost of Goods Sold) ÷ Revenue × 100 = Gross Margin %
Net Promoter Score (NPS)
WhatMeasures customer loyalty by asking: "How likely are you to recommend us?" Scores range from −100 to +100.
WhyNPS predicts retention better than satisfaction surveys. A loyal base is the cheapest driver of organic growth.
BenchmarkAbove 0 = Good · Above 50 = Excellent · Above 70 = World-class
% Promoters (score 9–10) − % Detractors (score 0–6) = NPS
Overall Equipment Effectiveness (OEE)
WhatFor manufacturing: OEE measures availability, performance, and quality simultaneously in one score.
WhyMost facilities run at 40–60% OEE. World-class is 85%+. Closing that gap is where the biggest margin gains hide.
BenchmarkWorld-class 85%+ · Industry average 40–60% · Below 40% = urgent intervention needed
Availability × Performance Rate × Quality Rate = OEE %
Employee Productivity Index
WhatRevenue or output generated per employee — the simplest proxy for workforce and process effectiveness.
WhyDeclining revenue per employee signals process bloat or under-investment in tools months before attrition appears.
BenchmarkTrack the trend over time · Growth = efficient scaling · Decline = investigate process and tools immediately
Total Revenue ÷ Total Number of Employees = Revenue per Employee
Defect / Error Rate
WhatThe percentage of outputs — products, transactions, or service deliveries — that fail the defined quality standard.
WhyA high defect rate destroys margin, customer trust, and brand equity simultaneously and silently.
BenchmarkTarget below 1% · Six Sigma standard = 3.4 defects per million opportunities
Defective Units ÷ Total Units Produced × 100 = Defect Rate %
Cash Flow & Burn Rate
WhatNet cash flow tracks real liquidity health. Burn rate shows monthly cash consumption during growth phases.
WhyA profitable business can still fail from poor cash timing. Cash flow visibility is non-negotiable at every growth stage.
BenchmarkPositive and growing month-over-month = healthy runway · Negative = prioritize receivables immediately
Total Cash Inflows − Total Cash Outflows = Net Cash Flow
Return on Investment (ROI)
WhatMeasures the efficiency of every rupee invested — in machinery, software, marketing, or headcount.
WhyROI closes the loop between strategy and outcome. High performers calculate it at the initiative level, not portfolio level.
BenchmarkPositive and above cost of capital · Calculate per initiative to cut poor performers fast
(Net Gain − Cost of Investment) ÷ Cost of Investment × 100 = ROI %
Industry Benchmark Comparison
The same KPI reads differently across industries. Here is how the five most universal KPIs benchmark across three major sectors — so you know instantly whether your number is strong, average, or a warning sign that needs attention.
KPI Benchmarks Across Industries · 2026
Manufacturing · SaaS / Tech · Retail · Based on published industry benchmarks
Revenue Growth Rate
5–12% YoY
20–30% MoM
3–8% YoY
Gross Profit Margin
20–40%
60–70%
30–50%
Customer Acquisition Cost
$500–$2,000
$200–$1,500
$10–$86
OEE / Efficiency
85%+ world-class
99.9%+ uptime
12× inventory/yr
Net Promoter Score
30–50 average
40–60 average
30–45 average
KPI Adoption Priorities in 2026
Based on industry research and adoption patterns across high-performing organizations, these are the KPIs receiving the most investment in tracking infrastructure this year. Companies that prioritize the top four are 15% more likely to hit their annual growth targets.
Customer Lifetime Value
82%
Customer Acquisition Cost
79%
Cash Flow & Burn Rate
61%
The Operator Playbook — How to Build a KPI Culture
Tracking KPIs is not the hard part. Building a culture where those numbers drive daily decisions — that is what separates growing companies from the ones still running on spreadsheets and monthly reviews. The organizations that outperform sequence deliberately.
Step 1 · Define
Choose the Right 5–7
5–7 KPIs per role is the proven limit. Beyond that, attention dilutes and decision speed drops. Add a new KPI only when you retire one. Align every KPI directly to a strategic objective.
Step 2 · Target
Set Benchmarks and Deadlines
A KPI without an explicit target is just data. Set a number, a timeframe, and a responsible owner. Reference industry benchmarks to calibrate ambition versus reality before committing.
Step 3 · Automate
Eliminate Manual Reporting
Automate data collection to remove reporting lag and human error. Weekly visibility beats monthly reviews by an order of magnitude. Real-time dashboards make KPIs actionable — not retrospective.
Step 4 · Accelerate
Connect KPIs to Incentives
Link KPIs to team goals and recognition so every person knows how their daily work moves the number. Organizations that connect KPIs to incentives report measurably higher accountability and faster response to downward trends.
Want to see how iFactory's AI analytics platform tracks all 10 KPIs in real time across production, quality, and operations? Book a 30-minute platform walkthrough.
Frequently Asked Questions
How many KPIs should a business track at once?
Research consistently points to 5–7 KPIs per role or team as the optimal range. Beyond that, attention dilutes and decision speed drops. The goal is focus — choose metrics that directly connect to strategic objectives and retire one before adding another. Tracking 50 KPIs is not 10 times better than tracking 5 — it is 10 times more confusing.
What is the difference between a KPI and a vanity metric?
A KPI passes this test: if this number improves by 20%, does revenue, margin, or operational output benefit directly? Vanity metrics — page views, social followers, app downloads — fail this test. They look impressive in reports but rarely drive business decisions or connect to financial outcomes. Focus only on metrics that force action when they move.
Which KPI matters most for manufacturing specifically?
Overall Equipment Effectiveness (OEE) is the defining operational KPI for manufacturing. It combines availability, performance, and quality into one score. World-class operations hit 85%+, while most facilities run at 40–60%. Closing that gap with real-time analytics is where the most significant productivity and margin gains are found in 2026.
Book a demo to see how iFactory tracks OEE live.
How often should KPIs be reviewed and updated?
Operational KPIs like OEE and defect rate should be visible in real time. Growth KPIs like revenue growth rate and CAC should be reviewed weekly with monthly trend analysis. Strategic KPIs — CLV, ROI — are best evaluated quarterly. KPI targets themselves should be reviewed whenever business strategy shifts significantly, and at minimum once per year.
Contact iFactory support for guidance on your specific industry.
What is a healthy CLV to CAC ratio?
A CLV:CAC ratio of 3:1 is the minimum benchmark for a sustainable business — meaning each customer generates three times what it cost to acquire them. A ratio of 4:1 or higher is excellent. Below 2:1 means acquisition costs are eating into long-term value and the model needs adjustment. Above 5:1 may actually signal you are under-investing in growth and leaving market share on the table.
Stop Guessing · Start Growing with Live KPI Dashboards
See All 10 KPIs Tracked Automatically in iFactory
iFactory connects your production, quality, operations, and financial data into one live performance view — every KPI above tracked automatically, benchmarked against your industry, and actionable from day one. No spreadsheets. No reporting lag.
10 KPIs
Tracked live across production, quality, and operations
+53%
Labor productivity lift from connected analytics
Real-Time
Dashboard visibility — not monthly reporting
All Industries
Manufacturing, process, discrete, and hybrid operations