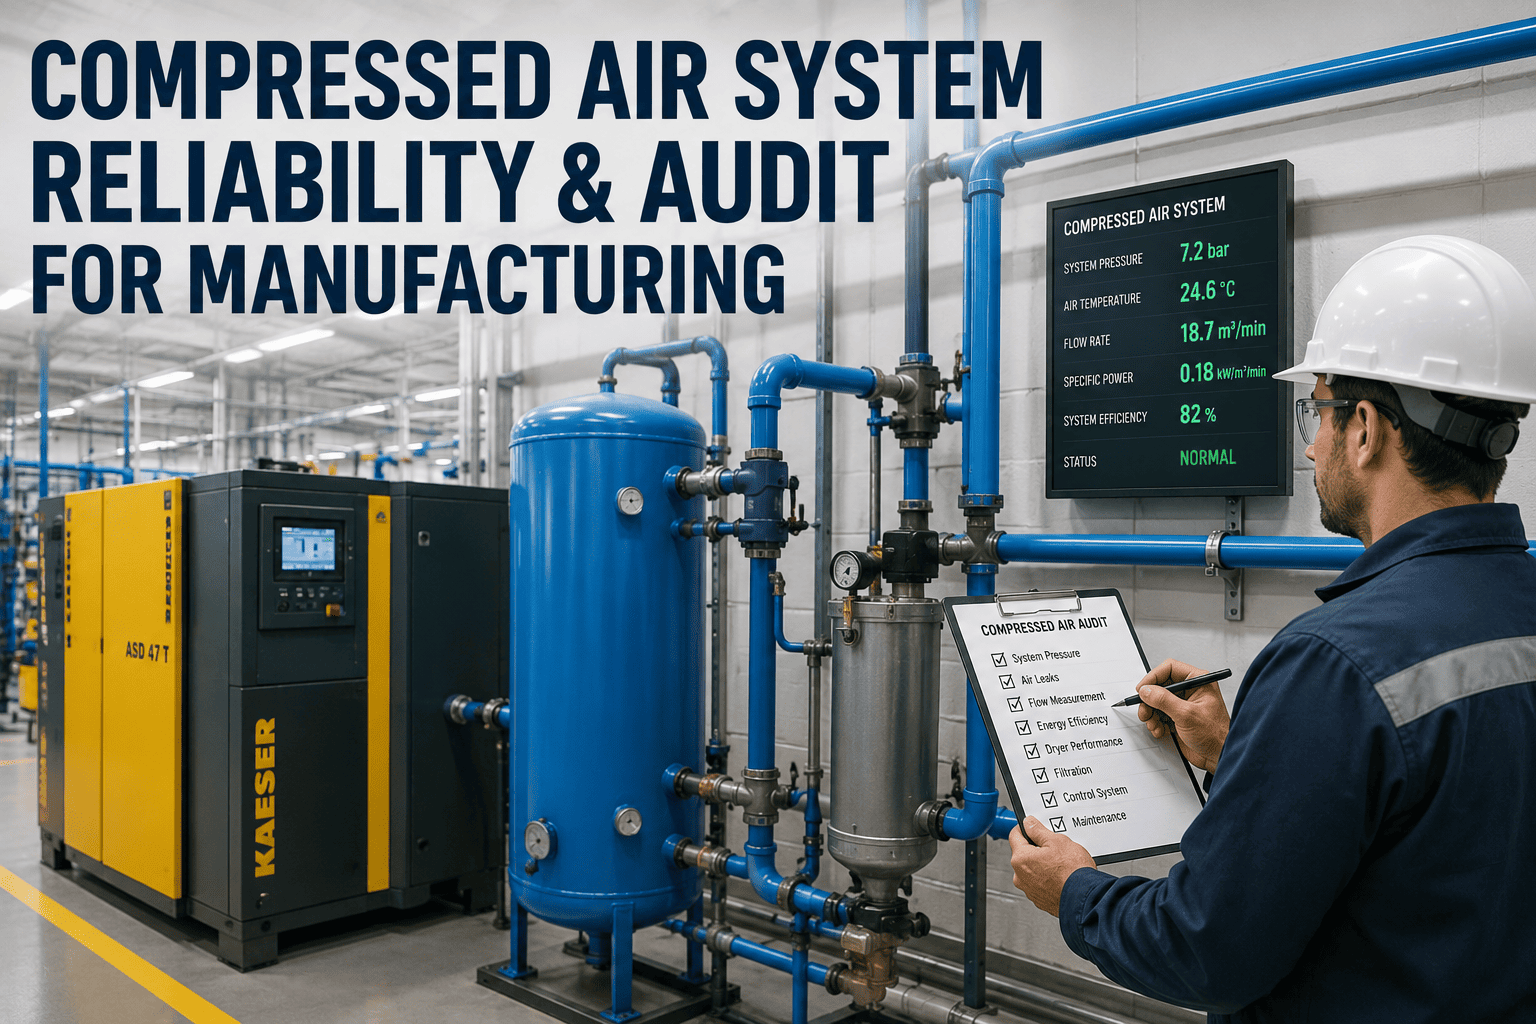
Walk into any U.S. manufacturing facility on a Sunday afternoon when production is down and the lines are silent, and you will still hear something: the unmistakable hiss of compressed air escaping from threaded fittings, quick-disconnect couplings, worn pneumatic cylinder seals, and the dozens of small breaches that have accumulated across the air distribution network over years of operation. That sound — barely audible to the human ear under normal production noise — is the single largest source of energy waste in most U.S. plants. Industry studies from the U.S. Department of Energy and the Compressed Air Challenge consistently find that the average industrial facility loses 20 to 30% of its compressed air production to leaks, and that compressed air itself is the most expensive utility in the plant on a per-unit-of-work basis — typically 7 to 8 times more expensive than the electricity used to produce it. A facility running a 200 HP compressor at $0.10 per kWh and 6,000 operating hours per year is spending roughly $89,000 annually just on that compressor's electricity bill, and 20 to 30% of that — $18,000 to $27,000 — is being thrown away through leaks that take 10 minutes and a $2 fitting to fix. The reason this waste persists across thousands of U.S. plants is not that maintenance teams are unaware of it. It is that finding leaks during production is operationally difficult, prioritizing repairs against competing maintenance work is uncoordinated and measuring the impact of completed repairs against the energy bill is rarely closed-loop. iFactory's compressed air leak detection workflow, built on top of the Energy Monitoring module and integrated with the CMMS and analytics layer, converts this fragmented process into a structured discipline — ultrasonic survey scheduling, leak tagging and prioritization, repair work order routing, and post-repair energy verification — that consistently delivers payback periods of 3 to 9 months and sustained energy savings of 12 to 22% on the compressed air line. Facilities that have deployed iFactory's leak detection workflow alongside the energy monitoring module report verified savings of $35,000 to $180,000 per year depending on facility size, with the first repair sweep typically paying for the entire program within the first quarter.
Compressed Air Leak Detection for Energy Savings in Manufacturing
Compressed air is the most expensive utility in your plant — and 20 to 30% of it is leaking through fittings, couplings, and seals you cannot hear over production noise. iFactory's leak detection workflow converts ultrasonic surveys, prioritized repair work orders, and post-repair verification into one closed-loop discipline that delivers 3 to 9 month payback and 12 to 22% sustained energy savings.
Why Compressed Air Is the Single Highest-ROI Target in Plant Energy Management
Compressed air sits in a peculiar position in U.S. manufacturing energy economics. It is universally used — virtually every plant runs pneumatic tools, actuators, conveyance systems, blow-off applications, and process air — and yet it is universally misunderstood as a utility. Most plant managers can tell you the cost of a kilowatt-hour to within a tenth of a cent, but cannot tell you the cost of producing 1,000 cubic feet of compressed air at their own facility. That cost is typically $0.18 to $0.30 per 1,000 cubic feet for a well-maintained system, and $0.30 to $0.50 per 1,000 cubic feet for a system running with significant leaks and pressure drops — because every compressor on the floor is working harder than it needs to in order to maintain header pressure against the cumulative leak load. The arithmetic of leak detection is therefore unusually favorable. A single 1/8-inch leak at 100 PSI releases approximately 25 standard cubic feet per minute, which over a year of 24/7 operation translates to roughly $1,500 to $2,500 in wasted electricity depending on the local utility rate and the compressor's efficiency. A typical mid-size U.S. plant has 50 to 200 leaks of varying sizes across its distribution network. The math is not subtle: fixing the leaks pays back faster than virtually any other energy efficiency investment available to manufacturing.
What changes when iFactory's leak detection workflow is deployed is not the underlying physics — leaks have always been expensive. What changes is the operational discipline that surrounds detection, repair, and verification. Ultrasonic survey results stop living in a PDF report that sits on a shared drive after the consultant leaves. Leaks become tagged work orders in the CMMS with priority scores driven by estimated leak rate, accessibility, and production impact. Repair completion triggers an energy verification routine that compares pre-repair and post-repair compressor load to confirm that the fix actually delivered the projected savings — and flags repairs that did not produce the expected reduction for re-inspection. The result is a leak detection program that compounds in value over time rather than reverting to baseline waste levels 18 months after the consultant's report has been forgotten.
The Four Building Blocks of an Effective Compressed Air Leak Detection Program
An effective compressed air leak detection program is built on four operational capabilities that must work as a connected system rather than as independent activities. iFactory's Energy Monitoring module delivers all four capabilities inside the same data model — so leak surveys, repair work orders, energy meter readings, and verification reports are all referenced against the same plant asset hierarchy and the same compressor electrical signature.
Ultrasonic Detection
Ultrasonic leak detectors pick up the high-frequency sound (typically 35 to 45 kHz) generated by turbulent airflow at a leak point — sound that is inaudible to humans but easily isolated by directional ultrasonic sensors even in noisy production environments. iFactory supports survey data import from major ultrasonic platforms and tagged-photo capture from mobile devices.
Leak Tagging and Prioritization
Each detected leak is captured as a digital record with location, asset reference, estimated CFM, photo, and accessibility notes. Priority scoring weighs leak rate, production impact, safety considerations, and parts availability to produce a ranked repair queue rather than a flat list of findings.
Repair Work Order Routing
Prioritized leaks flow into the CMMS as work orders with the right craft assignment, parts requisition, and scheduling window. Quick-fix leaks accessible from the floor are batched for shift technician sweeps; complex leaks requiring isolation or scaffolding are routed to planned maintenance windows.
Energy Verification
Compressor electrical load is monitored continuously through the Energy Monitoring module, and post-repair compressor load is compared to pre-repair baseline to verify that the projected savings were delivered. Repairs that fail to produce the expected reduction are flagged for re-inspection — closing the loop on the program.
Ready to see how iFactory's leak detection workflow would integrate with your existing compressed air system and CMMS? Book a Demo and walk through the program design with iFactory's energy team.
Leak Detection Methods Compared: What Actually Works in a Production Plant
Several leak detection methods are used across U.S. manufacturing, and the choice of method has a significant impact on how much of the leak population is actually found, how quickly the survey can be completed, and how reliably the results can be acted on. The comparison below shows the practical performance of the major methods against the realities of a production environment — ambient noise, access constraints, scheduling pressure, and the need for actionable, repair-ready output.
| Detection Method | Production Environment Performance | Leak Population Captured | Survey Speed | iFactory Integration |
|---|---|---|---|---|
| Soap Solution / Bubble Test | Limited — only works on accessible fittings during shutdown | 10–20% of total population (large, accessible leaks only) | Very slow — manual application required at every joint | Manual tag entry only |
| Audible Inspection | Fails in normal production noise — only large leaks detected | 5–15% of total population (only the largest leaks) | Slow — operator must physically approach each suspect point | Manual tag entry only |
| Ultrasonic Detection (Handheld) | Excellent — works during production at full plant noise level | 75–90% of total population including small leaks | Fast — experienced technician covers 500–1,500 sq ft per hour | Native data import from major ultrasonic platforms |
| Fixed Ultrasonic Sensors | Continuous — detects new leaks as they develop on critical assets | Limited to monitored zones but with 24/7 coverage | Continuous monitoring; no survey required | Direct sensor integration with alerting and trend analytics |
| Compressor Load Analysis | Indirect — confirms total leak load but does not localize | Aggregate measurement only — no per-leak data | Continuous from existing meters | Used for baseline establishment and post-repair verification |
| Pressure Decay Testing | Requires plant shutdown — operationally difficult | Aggregate measurement at zone level | Slow — requires isolation and stabilization | Periodic validation of total system tightness |
The practical answer for most U.S. manufacturing facilities is a combined approach: handheld ultrasonic survey as the primary detection method for periodic comprehensive sweeps, fixed ultrasonic sensors on critical or high-leak-risk assets for continuous monitoring, and compressor load analysis through the Energy Monitoring module as the aggregate verification layer that confirms the overall program is producing the projected savings. iFactory's workflow supports all three layers in a single dashboard, with the leak register, the work order queue, and the compressor load trend visible to the maintenance team in one view.
The End-to-End Leak Detection Workflow Inside iFactory
iFactory's compressed air leak detection workflow is delivered through a structured six-step process that takes a facility from initial baseline establishment through verified, sustained energy savings. The workflow below reflects the program architecture that has delivered the documented 3 to 9 month payback periods at U.S. manufacturing deployments.
Baseline Establishment and Cost Modeling
The program begins by establishing the compressed air baseline — compressor electrical load profile, average operating pressure, estimated total air production, and the actual cost per 1,000 cubic feet at the facility's utility rate. iFactory's Energy Monitoring module captures compressor load data continuously and produces the baseline against which all future savings are measured.
Ultrasonic Survey Execution
A comprehensive ultrasonic survey is conducted across the air distribution network — production floor headers, drops, end-use equipment, regulators, and quick-disconnect points. Each detected leak is captured with location, photo, estimated CFM, and accessibility notes, uploaded directly to the iFactory leak register from the survey tool or mobile device.
Prioritization and Work Order Generation
The leak register is automatically scored against leak rate, production impact, accessibility, and parts availability. Prioritized leaks generate CMMS work orders with appropriate craft assignment and scheduling window — quick-fix leaks batched for shift sweeps, complex leaks routed to planned windows.
Repair Execution and Documentation
Maintenance technicians execute repairs in the prioritized sequence, with each repair documented in the CMMS with the parts used, the time taken, and a confirmation photo of the completed fix. Failed repairs — leaks that cannot be fixed without major parts replacement — are reclassified for capital planning rather than left in the open work queue.
Post-Repair Energy Verification
After the repair sweep is complete, compressor electrical load is compared to the established baseline over a stabilization period of 7 to 14 days. The actual energy savings are measured and compared against the projected savings from the leak survey. Repairs that did not produce the expected reduction trigger re-inspection of the affected zone.
Continuous Monitoring and Re-Survey Cadence
The program shifts from initial sweep to sustained discipline through continuous compressor load monitoring with drift detection — when total air consumption begins climbing back toward the pre-repair baseline, an alert triggers the next survey. Fixed ultrasonic sensors on high-risk assets provide continuous coverage between full surveys.
ROI Modeling: What a Typical U.S. Plant Recovers in Year One
The economic case for compressed air leak detection is best understood through a worked example that reflects the typical conditions at a mid-size U.S. manufacturing facility. The model below uses conservative assumptions — a modest compressor fleet, average leak density, and typical U.S. industrial electricity rates — to show what the verified payback looks like in practice.
Expert Review: What Plant Energy Managers Say About Sustained Leak Programs
I have run energy management programs at three U.S. manufacturing facilities over the last 17 years, and I will tell anyone who asks that compressed air leaks are the most consistently underappreciated cost in our industry. The technology to find them has existed for decades. The savings math is genuinely overwhelming. And yet I still walk into plants every year where the leak load is sitting at 25 to 30% of total air production because nobody has built the operational discipline around detection, repair, and verification that turns a one-time survey into a sustained program.
Conclusion
Compressed air leak detection is the fastest-payback energy investment available to U.S. manufacturing — but only when it is implemented as a closed-loop discipline rather than as a one-time survey activity. The difference between a facility that captures 12 to 22% sustained savings on its compressed air line and a facility that captures a brief 8% improvement that erodes within 18 months is not the quality of the ultrasonic detector or the experience of the survey technician. It is whether the plant has built the operational workflow around detection, prioritization, repair, and verification that turns leak survey findings into compounding annual savings.
iFactory's Energy Monitoring module, integrated with the CMMS work order system and the analytics layer, delivers that closed-loop workflow as a configured, deployable capability. The 3 to 9 month payback periods, the 12 to 22% sustained savings, and the $25,000 to $30,000 annual run-rate value at typical mid-size facilities are not aspirational figures — they are documented outcomes at iFactory-deployed sites that have moved leak detection from a fragmented activity to a structured energy management discipline. Book a Demo to see how iFactory's leak detection workflow would integrate with your facility's compressed air system, CMMS, and existing energy infrastructure.
Frequently Asked Questions
Turn Your Compressed Air Leaks Into the Fastest Energy ROI in the Plant.
iFactory's Energy Monitoring module, integrated with the CMMS and analytics layer, delivers ultrasonic survey workflow, prioritized repair routing, and post-repair energy verification in one closed-loop discipline — converting 20 to 30% leak waste into 12 to 22% sustained energy savings with 3 to 9 month payback.